Marble Falls, TX (Texas) Houses and Residents
| Marble Falls: | $305,601 |
| Texas: | $275,400 |
Total population: 6,185 (Urban population: 4,310 (all inside urban clusters), Rural population: 662 (all nonfarm))
Houses: 3,353 (2,906 occupied: 1,397 owner occupied, 1,552 renter occupied)
| % of renters here: | 53% |
| State: | 38% |
Housing density: 546 houses/condos per square mile
Median price asked for vacant for-sale houses and condos in 2022 in this county: $429,748.
Median contract rent in 2022: $1,093 (lower quartile is $872, upper quartile is $1,394)
Median rent asked for vacant for-rent units in 2022: $1,536
Median gross rent in Marble Falls, TX in 2022: $1,322
Housing units in Marble Falls with a mortgage: 615 (14 second mortgage, 0 home equity loan, 0 both second mortgage and home equity loan)
Houses without a mortgage: 6
Median household income for houses/condos with a mortgage: $80,789
Median household income for apartments without a mortgage: $78,568
Median monthly housing costs: $1,233
Compare current foreclosures near Marble Falls, TX:
| Photo | Address | Area | Beds / Baths | Price | Details |
|---|---|---|---|---|---|

|
#1
Boulder Creek Dr
Marble Falls, TX 78654
|
4,402 sq. feet
|
- baths - beds |
show details | |

|
#2
Mormon Mill Rd
Marble Falls, TX 78654
|
- sq. feet
|
- baths - beds |
show details | |

|
#3
E Fm 1431
Marble Falls, TX 78654
|
- sq. feet
|
- baths - beds |
show details | |

|
#4
Horseshoe Dr
Kingsland, TX 78639
|
1,680 sq. feet
|
2 baths - beds |
show details | |

|
#5
S Boundary St
Burnet, TX 78611
|
776 sq. feet
|
1 baths - beds |
show details | |

|
#6
Southwood Dr
Mar-Horseshoe Bay, TX 78657
|
1,496 sq. feet
|
1 baths - beds |
show details | |

|
#7
Ridgeway St
Kingsland, TX 78639
|
2,248 sq. feet
|
2 baths - beds |
show details | |

|
#8
Airway St
Kingsland, TX 78639
|
1,624 sq. feet
|
2 baths - beds |
show details | |

|
#9
Fm 2340
Burnet, TX 78611
|
1,568 sq. feet
|
- baths - beds |
show details | |

|
#10
Elmer Ave
Burnet, TX 78611
|
1,543 sq. feet
|
- baths - beds |
show details |
| Photo | Address | Area | Beds / Baths | Price | Details |
|---|---|---|---|---|---|

|
#11
W Highway 29
Burnet, TX 78611
|
- sq. feet
|
- baths - beds |
show details | |

|
#12
W State Highway 29
Burnet, TX 78611
|
1,600 sq. feet
|
- baths - beds |
show details | |

|
#13
Farm To Market 2340
Burnet, TX 78611
|
- sq. feet
|
- baths - beds |
show details | |

|
#14
Possum Trot St
Burnet, TX 78611
|
- sq. feet
|
- baths - beds |
show details | |

|
#15
Old Spanish Trl
Buchanan Dam, TX 78609
|
2,350 sq. feet
|
- baths - beds |
show details | |

|
#16
Highland Loop
Kingsland, TX 78639
|
1,192 sq. feet
|
- baths - beds |
show details | |

|
#17
Sagebrush Trl
Kingsland, TX 78639
|
- sq. feet
|
- baths - beds |
show details | |

|
#18
Spur 191 # C
Spicewood, TX 78669
|
- sq. feet
|
- baths - beds |
show details | |

|
#19
Three Creeks Dr
Bertram, TX 78605
|
- sq. feet
|
- baths - beds |
show details | |

|
#20
Granite St
Kingsland, TX 78639
|
- sq. feet
|
- baths - beds |
show details |
| Photo | Address | Area | Beds / Baths | Price | Details |
|---|---|---|---|---|---|

|
#21
Deer Dr
Llano, TX 78643
|
- sq. feet
|
- baths - beds |
show details | |

|
#22
Free Rein # 2
Mar-Horseshoe Bay, TX 78657
|
- sq. feet
|
- baths - beds |
show details | |

|
#23
Ranchview Rd
Spicewood, TX 78669
|
- sq. feet
|
- baths - beds |
show details | |

|
#24
Oak Crest Dr
Bertram, TX 78605
|
- sq. feet
|
- baths - beds |
show details | |

|
#25
Saddlebrook Canyon Ct
Spicewood, TX 78669
|
- sq. feet
|
- baths - beds |
show details | |

|
#26
Ranch Road 261
Buchanan Dam, TX 78609
|
- sq. feet
|
- baths - beds |
show details | |

|
#27
Wood Forest Rd # 2
Kingsland, TX 78639
|
- sq. feet
|
- baths - beds |
show details | |

|
Check over 1 million property listings on Foreclosure.com!
|
browse all offers | |||


Median year apartment built: 2008
Household type by relationship:
Households: 7,258- Male householders: 1,231 (339 living alone), Female householders: 1,634 (656 living alone)
1,093 spouses (1,093 opposite-sex spouses), 274 unmarried partners, (274 opposite-sex unmarried partners), 2,112 children (1,787 natural, 54 adopted, 270 stepchildren), 202 grandchildren, 70 brothers or sisters, 293 parents, 0 foster children, 49 other relatives, 215 non-relatives
- In group quarters: 80
Size of family households: 631 2-persons, 441 3-persons, 134 4-persons, 97 5-persons, 312 6-persons, 116 7-or-more-persons.
Size of nonfamily households: 1,049 1-person, 135 2-persons, 42 3-persons.
1,232 married couples with children.
331 single-parent households (132 men, 199 women).
84.2% of residents of Marble Falls speak English at home.
16.0% of residents speak Spanish at home (68% speak English very well, 29% speak English well, 3% speak English not well, 1% don't speak English at all).
Foreign born population: 689 (9.5%)
(71.8% of them are naturalized citizens)
| Here: | 6.1 |
| State: | 6.3 |
| Here: | 4.5 |
| State: | 4.0 |

- Bedrooms in owner-occupied houses and condos in Marble Falls, Texas
- 24no bedroom
- 211 bedroom
- 952 bedrooms
- 8483 bedrooms
- 3234 bedrooms
- 865+ bedrooms

- Bedrooms in renter-occupied apartments in Marble Falls, Texas
- 47no bedroom
- 3531 bedroom
- 4972 bedrooms
- 6163 bedrooms
- 274 bedrooms
- 135+ bedrooms

- Cars and other vehicles available in Marble Falls in owner-occupied houses/condos
- 25no vehicle
- 4821 vehicle
- 5172 vehicles
- 2103 vehicles
- 1634 vehicles
- 05+ vehicles

- Cars and other vehicles available in Marble Falls in renter-occupied apartments
- 144no vehicle
- 6351 vehicle
- 5922 vehicles
- 773 vehicles
- 1054 vehicles
- 05+ vehicles

- Rooms in owner-occupied houses in Marble Falls, Texas
- 151 room
- 02 rooms
- 103 rooms
- 1044 rooms
- 4235 rooms
- 2676 rooms
- 1947 rooms
- 2458 rooms
- 1409+ rooms

- Rooms in renter-occupied apartments in Marble Falls, Texas
- 471 room
- 972 rooms
- 1813 rooms
- 4034 rooms
- 3895 rooms
- 3416 rooms
- 497 rooms
- 68 rooms
- 409+ rooms


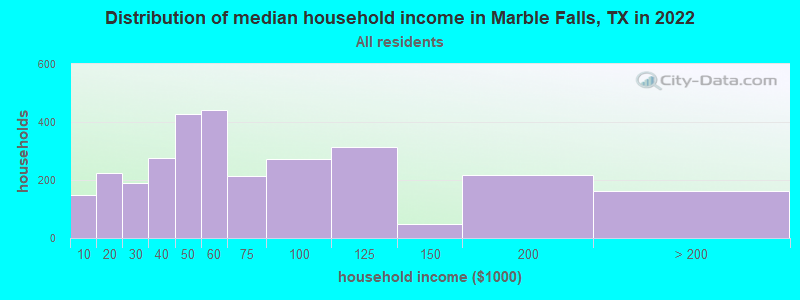
Marble Falls, TX household income distribution

- 148Less than $10,000
- 223$10,000 to $19,999
- 191$20,000 to $29,999
- 277$30,000 to $39,999
- 427$40,000 to $49,999
- 441$50,000 to $59,999
- 214$60,000 to $74,999
- 271$75,000 to $99,999
- 314$100,000 to $124,999
- 50$125,000 to $149,999
- 217$150,000 to $199,999
- 161$200,000 or more
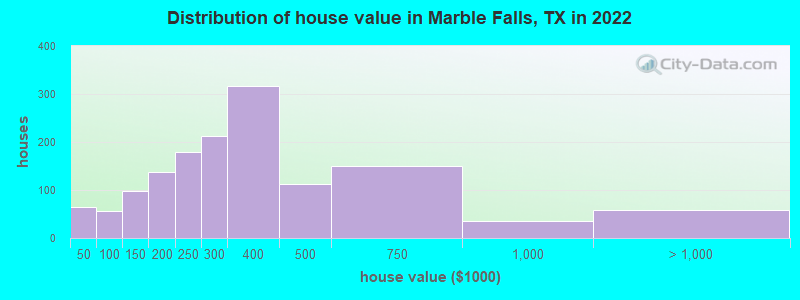
Home value of owner - occupied houses in 2022 in Marble Falls, TX
-
- 12Less than $10,000
- 7$10,000 to $14,999
- 13$15,000 to $19,999
- 22$20,000 to $24,999
- 8$40,000 to $49,999
- 15$50,000 to $59,999
- 15$60,000 to $69,999
- 15$90,000 to $99,999
- 27$100,000 to $124,999
- 70$125,000 to $149,999
- 58$150,000 to $174,999
- 78$175,000 to $199,999
- 179$200,000 to $249,999
- 212$250,000 to $299,999
- 315$300,000 to $399,999
- 113$400,000 to $499,999
- 149$500,000 to $749,999
- 35$750,000 to $999,999
- 58$1,000,000 to $1,499,999
Rent paid by renters in 2022 in Marble Falls, TX
-
- 46$150 to $199
- 24$300 to $349
- 10$450 to $499
- 98$500 to $549
- 11$550 to $599
- 13$600 to $649
- 64$650 to $699
- 13$700 to $749
- 11$750 to $799
- 147$800 to $899
- 204$900 to $999
- 359$1,000 to $1,249
- 263$1,250 to $1,499
- 127$1,500 to $1,999
- 106$2,500 to $2,999
- 18$3,000 to $3,499
- 24No cash rent


Percentage of workers working in this county: 81.9%
Number of people working at home: 330 (9.0% of all workers)
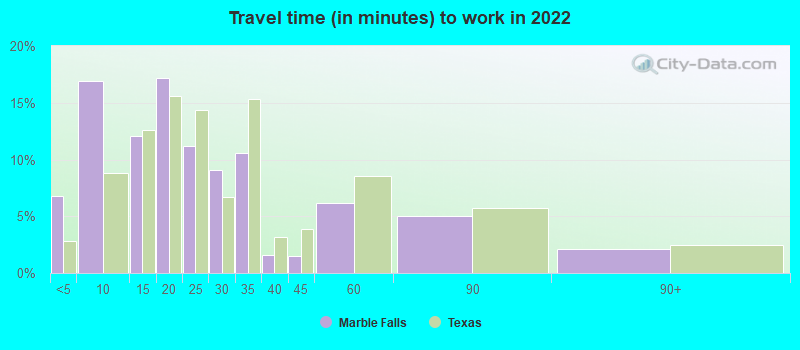
Travel time to work (commute)
- Less than 5 minutes: 336
- 5 to 9 minutes: 1,235
- 10 to 14 minutes: 453
- 15 to 19 minutes: 449
- 20 to 24 minutes: 82
- 25 to 29 minutes: 122
- 30 to 34 minutes: 95
- 35 to 39 minutes: 75
- 40 to 44 minutes: 235
- 45 to 59 minutes: 57
- 60 to 89 minutes: 128
- 90 or more minutes: 12
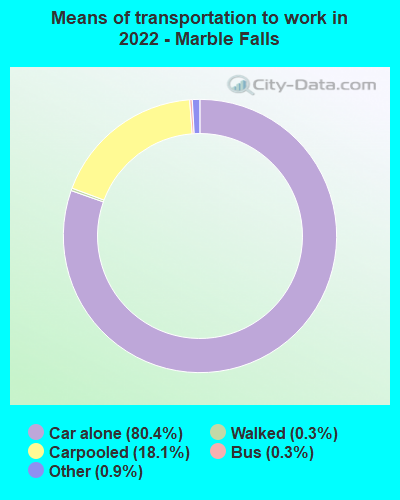
Means of transportation to work:
- Drove a car alone: 6,346 (74.0%)
- Carpooled: 1,552 (18.1%)
- Bus: 23 (0.3%)
- Taxi: 88 (1.0%)
- Walked: 21 (0.2%)
- Worked at home: 330 (3.8%)

- Unemployment by race in 2022
- Unemployment rate for White non-Hispanic residents
- 2.6%Males
- 0.7%Females
- Unemployment rate for Black residents
- 43.8%Males
- 22.6%Females
- Unemployment rate for two or more race residents
- 15.5%Males

- Year of entry for the foreign-born population in Marble Falls, Texas
- 02010 or later
- 1512000 to 2009
- 781990 to 1999
- 941980 to 1989
- 571970 to 1979
- 31Before 1970

First ancestries reported:
- English: 383 (9.9%)
- German: 383 (9.9%)
- Irish: 261 (6.7%)
- American: 178 (4.6%)
- Scotch-Irish: 63 (1.6%)
- European: 37 (1.0%)
- Italian: 24 (0.6%)
- Scottish: 20 (0.5%)
- British: 13 (0.3%)
- Israeli: 13 (0.3%)
- French: 11 (0.3%)
- Austrian: 10 (0.3%)
Most common places of birth for foreign-born residents (%):
| Marble Falls: | 73.0% (503) |
| Texas: | 48.4% (2,411,723) |
| Marble Falls: | 18.4% (127) |
| Texas: | 4.5% (224,455) |
| Marble Falls: | 4.8% (33) |
| Texas: | 0.4% (18,642) |
| Marble Falls: | 1.6% (11) |
| Texas: | 0.1% (5,041) |
Place of birth for U.S.-born residents:
- This state: 4,110
- Other state: 2,444
- Northeast: 261
- Midwest: 409
- South: 560
- West: 1,244
87.1% of Marble Falls residents lived in the same house 1 years ago.
Out of people who lived in different houses, 38.1% lived in this county.
Out of people who lived in different counties, 93.1% lived in Texas.
| Marble Falls: | 87.1% |
| State average: | 85.7% |
Education attainment for males 25 years and older:
- No schooling: 55
- Nursery to 4th grade: 17
- 5th and 6th grade: 122
- 7th and 8th grade: 0
- 9th grade: 62
- 10th grade: 68
- 11th grade: 35
- 12th grade, no diploma: 33
- High school graduate (or equivalency): 668
- Less than 1 year of college: 61
- Some college more than 1 year, no degree: 186
- Associate degree: 178
- Bachelor's degree: 502
- Master's degree: 192
- Professional school degree: 0
- Doctorate degree: 84

Education attainment for females 25 years and older:
- No schooling: 40
- Nursery to 4th grade: 0
- 5th and 6th grade: 0
- 7th and 8th grade: 11
- 9th grade: 14
- 10th grade: 0
- 11th grade: 82
- 12th grade, no diploma: 23
- High school graduate (or equivalency): 540
- Less than 1 year of college: 303
- Some college more than 1 year, no degree: 405
- Associate degree: 201
- Bachelor's degree: 567
- Master's degree: 358
- Professional school degree: 33
- Doctorate degree: 18


Housing units in structures:
- One, detached: 1,663
- One, attached: 100
- Two: 258
- 3 or 4: 271
- 5 to 9: 448
- 10 to 19: 181
- 20 to 49: 170
- 50 or more: 22
- Mobile homes: 235
Median worth of mobile homes: $112,762
Housing units lacking complete kitchen facilities in 2022: 4.8%
House/condo owner moved in on average 9 years ago
Renter moved in on average 3 years ago

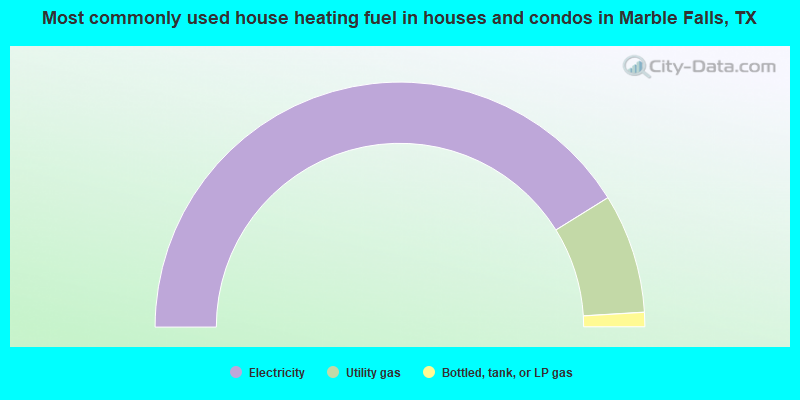
- 82.3%Electricity
- 15.8%Utility gas
- 1.9%Bottled, tank, or LP gas
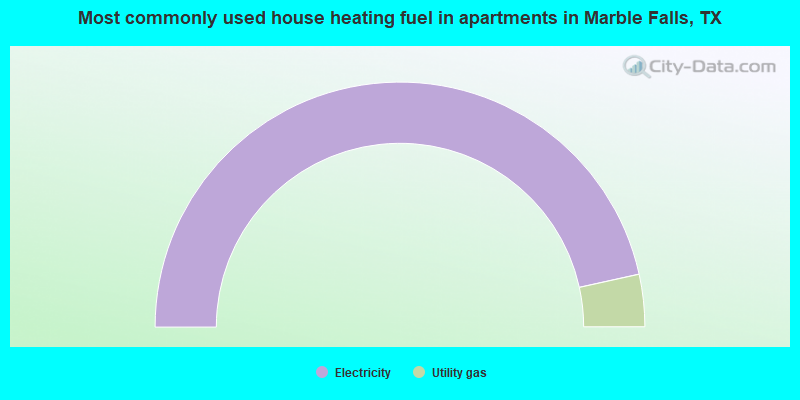
- 93.1%Electricity
- 6.9%Utility gas
Private vs. public school enrollment:
| Here: | 11.2% |
| Texas: | 8.8% |
| Here: | 2.2% |
| Texas: | 8.0% |
| Here: | 1.9% |
| Texas: | 16.2% |


