Rowlett, TX (Texas) Houses and Residents
| Rowlett: | $366,500 |
| Texas: | $275,400 |
Mean price in 2022:
Detached houses: $332,120
Here: $332,120 State: $369,058 Townhouses or other attached units: $197,495
Here: $197,495 State: $327,631 Mobile homes: $68,125
Here: $68,125 State: $124,413
Total population: 58,407 (Urban population: 43,434, Rural population: 892 (34 farm, 858 nonfarm))
Houses: 22,997 (22,742 occupied: 17,619 owner occupied, 5,123 renter occupied)
| % of renters here: | 23% |
| State: | 38% |
Housing density: 1,137 houses/condos per square mile
Median price asked for vacant for-sale houses and condos in 2022: $318,195.
Median contract rent in 2022: $1,827 (lower quartile is $1,453, upper quartile is over $2,000)
Median rent asked for vacant for-rent units in 2022: $1,517
Median gross rent in Rowlett, TX in 2022: $1,910
Housing units in Rowlett with a mortgage: 13,111 (414 second mortgage, 0 home equity loan, 346 both second mortgage and home equity loan)
Houses without a mortgage: 240
Median household income for houses/condos with a mortgage: $128,926
Median household income for apartments without a mortgage: $95,170
Median monthly housing costs: $1,865
Compare current foreclosures in Rowlett, TX:
| Photo | Address | Area | Beds / Baths | Price | Details |
|---|---|---|---|---|---|

|
#1
Fairfield Dr
Rowlett, TX 75089
|
1,693 sq. feet
|
2 baths 4 beds |
show details | |

|
#2
Straits Dr
Rowlett, TX 75088
|
1,690 sq. feet
|
2 baths 3 beds |
show details | |

|
#3
Kingston Dr
Rowlett, TX 75089
|
2,860 sq. feet
|
2 baths 4 beds |
show details | |

|
#4
Sailors St
Rowlett, TX 75089
|
3,251 sq. feet
|
3 baths 4 beds |
show details | |

|
#5
Summer Solstice
Rowlett, TX 75088
|
3,113 sq. feet
|
2 baths 4 beds |
show details | |

|
#6
Luna Dr
Rowlett, TX 75088
|
1,771 sq. feet
|
2 baths 3 beds |
show details | |

|
#7
Augusta Ln
Rowlett, TX 75089
|
2,381 sq. feet
|
2 baths 4 beds |
show details | |

|
#8
Gulfport Dr
Rowlett, TX 75088
|
2,864 sq. feet
|
2 baths 3 beds |
show details | |

|
#9
Glenside Dr
Rowlett, TX 75089
|
2,076 sq. feet
|
2 baths 4 beds |
show details | |

|
#10
Journeys End
Rowlett, TX 75089
|
2,722 sq. feet
|
2 baths 3 beds |
show details |
| Photo | Address | Area | Beds / Baths | Price | Details |
|---|---|---|---|---|---|

|
#11
Mark Ln
Rowlett, TX 75089
|
1,844 sq. feet
|
2 baths 3 beds |
show details | |

|
#12
Tidewater Dr
Rowlett, TX 75088
|
2,710 sq. feet
|
2 baths 4 beds |
show details | |

|
#13
Euclid Dr
Rowlett, TX 75089
|
2,131 sq. feet
|
2 baths 4 beds |
show details | |

|
#14
Dove Creek Dr
Rowlett, TX 75088
|
4,183 sq. feet
|
3 baths 4 beds |
show details | |

|
#15
Alazan Bay Dr
Rowlett, TX 75089
|
2,994 sq. feet
|
2 baths 4 beds |
show details | |

|
#16
Christine St
Rowlett, TX 75088
|
966 sq. feet
|
1 baths 3 beds |
show details | |

|
#17
Vanderbilt Ct
Rowlett, TX 75088
|
2,222 sq. feet
|
2 baths 3 beds |
show details | |

|
#18
Dunhill Pl
Rowlett, TX 75089
|
2,410 sq. feet
|
2 baths 4 beds |
show details | |

|
#19
Sara Dr
Rowlett, TX 75088
|
1,340 sq. feet
|
2 baths 3 beds |
show details | |

|
#20
Miller Rd
Rowlett, TX 75088
|
1,116 sq. feet
|
2 baths 2 beds |
show details |
| Photo | Address | Area | Beds / Baths | Price | Details |
|---|---|---|---|---|---|

|
#21
Toscano Dr
Rowlett, TX 75089
|
3,054 sq. feet
|
2 baths 4 beds |
show details | |

|
#22
Terence Dr
Rowlett, TX 75089
|
4,169 sq. feet
|
3 baths 4 beds |
show details | |

|
#23
Castle Dr
Rowlett, TX 75089
|
1,831 sq. feet
|
2 baths 3 beds |
show details | |

|
#24
Freeman Dr
Rowlett, TX 75089
|
2,483 sq. feet
|
2 baths 4 beds |
show details | |

|
#25
Osage Dr
Rowlett, TX 75088
|
1,728 sq. feet
|
2 baths 3 beds |
show details | |

|
#26
Buckeye Dr
Rowlett, TX 75089
|
2,436 sq. feet
|
2 baths 4 beds |
show details | |

|
#27
River Bend Dr
Rowlett, TX 75089
|
3,506 sq. feet
|
2 baths 4 beds |
show details | |

|
#28
Wayne Pl
Rowlett, TX 75088
|
2,715 sq. feet
|
2 baths 3 beds |
show details | |

|
#29
Nairn St
Rowlett, TX 75089
|
1,976 sq. feet
|
2 baths 3 beds |
show details | |

|
#30
San Marino Dr
Rowlett, TX 75089
|
3,854 sq. feet
|
2 baths 5 beds |
show details |
| Photo | Address | Area | Beds / Baths | Price | Details |
|---|---|---|---|---|---|

|
#31
Handen Dr
Rowlett, TX 75089
|
3,314 sq. feet
|
3 baths 4 beds |
show details | |

|
#32
Lakeview Cir
Rowlett, TX 75089
|
1,872 sq. feet
|
2 baths 4 beds |
show details | |

|
#33
Liberty Ln
Rowlett, TX 75089
|
2,010 sq. feet
|
2 baths 3 beds |
show details | |

|
#34
Faulkner Dr
Rowlett, TX 75088
|
2,501 sq. feet
|
2 baths 4 beds |
show details | |

|
#35
Sunrise Dr
Rowlett, TX 75088
|
3,290 sq. feet
|
3 baths 4 beds |
show details | |

|
#36
Hartford Dr
Rowlett, TX 75089
|
2,186 sq. feet
|
2 baths 4 beds |
show details | |

|
#37
Silver Lake Dr
Rowlett, TX 75089
|
2,838 sq. feet
|
2 baths 4 beds |
show details | |

|
#38
Chesham Dr
Rowlett, TX 75088
|
1,755 sq. feet
|
2 baths 3 beds |
show details | |

|
#39
Skyline Dr
Rowlett, TX 75088
|
1,265 sq. feet
|
2 baths 2 beds |
show details | |

|
#40
Kings Ct
Rowlett, TX 75089
|
2,742 sq. feet
|
2 baths 3 beds |
show details |
| Photo | Address | Area | Beds / Baths | Price | Details |
|---|---|---|---|---|---|

|
#41
Kensington Dr
Rowlett, TX 75088
|
1,931 sq. feet
|
2 baths - beds |
show details | |

|
#42
Pine St
Rowlett, TX 75089
|
1,436 sq. feet
|
2 baths - beds |
show details | |

|
#43
Ridgeview Dr
Rowlett, TX 75089
|
1,857 sq. feet
|
2 baths - beds |
show details | |

|
#44
Larkspur Ln
Rowlett, TX 75089
|
1,722 sq. feet
|
2 baths - beds |
show details | |

|
#45
George W Bush Hwy
Rowlett, TX 75088
|
- sq. feet
|
- baths - beds |
show details | |

|
#46
Battlefield Dr
Rowlett, TX 75089
|
- sq. feet
|
- baths - beds |
show details | |

|
#47
President George Bush Hwy, Apt 10408
Rowlett, TX 75088
|
- sq. feet
|
- baths - beds |
show details | |

|
#48
Stone Meadow Cir
Rowlett, TX 75088
|
- sq. feet
|
- baths - beds |
show details | |

|
#49
Dalrock Rd # 1116
Rowlett, TX 75088
|
- sq. feet
|
- baths - beds |
show details | |

|
Check over 1 million property listings on Foreclosure.com!
|
browse all offers | |||

Latest news about housing in Rowlett, TX collected exclusively by city-data.com from local newspapers, TV, and radio stations


Median year apartment built: 2010
Household type by relationship:
Households: 65,284- Male householders: 12,346 (815 living alone), Female householders: 10,396 (2,225 living alone)
15,685 spouses (15,271 opposite-sex spouses), 1,816 unmarried partners, (1,816 opposite-sex unmarried partners), 19,801 children (18,130 natural, 440 adopted, 1,231 stepchildren), 2,424 grandchildren, 200 brothers or sisters, 1,019 parents, 0 foster children, 906 other relatives, 431 non-relatives
- In group quarters: 260
Size of family households: 8,312 2-persons, 3,575 3-persons, 3,946 4-persons, 1,930 5-persons, 223 6-persons, 401 7-or-more-persons.
Size of nonfamily households: 3,040 1-person, 1,315 2-persons.
9,464 married couples with children.
2,750 single-parent households (600 men, 2,150 women).
76.4% of residents of Rowlett speak English at home.
14.5% of residents speak Spanish at home (74% speak English very well, 17% speak English well, 8% speak English not well, 2% don't speak English at all).
2.5% of residents speak other Indo-European language at home (81% speak English very well, 18% speak English well, 1% don't speak English at all).
4.2% of residents speak Asian or Pacific Island language at home (65% speak English very well, 18% speak English well, 13% speak English not well, 4% don't speak English at all).
2.8% of residents speak other language at home (70% speak English very well, 19% speak English well, 11% speak English not well).
Foreign born population: 9,832 (15.1%)
(72.4% of them are naturalized citizens)
| Here: | 7.3 |
| State: | 6.3 |
| Here: | 4.4 |
| State: | 4.0 |

- Bedrooms in owner-occupied houses and condos in Rowlett, Texas
- 0no bedroom
- 01 bedroom
- 5452 bedrooms
- 7,8643 bedrooms
- 7,1864 bedrooms
- 2,0245+ bedrooms

- Bedrooms in renter-occupied apartments in Rowlett, Texas
- 228no bedroom
- 1,0941 bedroom
- 1,7862 bedrooms
- 1,0003 bedrooms
- 1,0154 bedrooms
- 05+ bedrooms

- Cars and other vehicles available in Rowlett in owner-occupied houses/condos
- 119no vehicle
- 2,7631 vehicle
- 7,8842 vehicles
- 3,7673 vehicles
- 2,0424 vehicles
- 1,0445+ vehicles

- Cars and other vehicles available in Rowlett in renter-occupied apartments
- 78no vehicle
- 1,6641 vehicle
- 2,1662 vehicles
- 5463 vehicles
- 3264 vehicles
- 3435+ vehicles

- Rooms in owner-occupied houses in Rowlett, Texas
- 01 room
- 02 rooms
- 03 rooms
- 6624 rooms
- 2,5345 rooms
- 3,0466 rooms
- 3,1817 rooms
- 2,8848 rooms
- 5,3129+ rooms

- Rooms in renter-occupied apartments in Rowlett, Texas
- 2281 room
- 5312 rooms
- 5063 rooms
- 1,4764 rooms
- 1,0935 rooms
- 1956 rooms
- 1067 rooms
- 1788 rooms
- 8109+ rooms


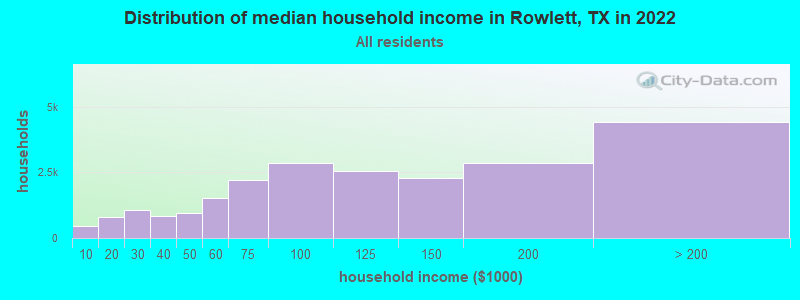
Rowlett, TX household income distribution

- 454Less than $10,000
- 795$10,000 to $19,999
- 1,066$20,000 to $29,999
- 839$30,000 to $39,999
- 939$40,000 to $49,999
- 1,523$50,000 to $59,999
- 2,199$60,000 to $74,999
- 2,840$75,000 to $99,999
- 2,542$100,000 to $124,999
- 2,273$125,000 to $149,999
- 2,858$150,000 to $199,999
- 4,414$200,000 or more
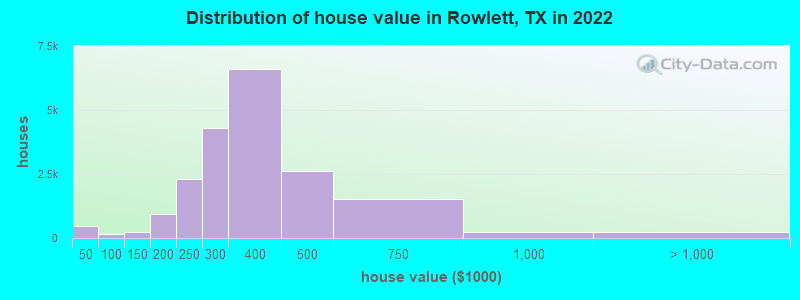
Home value of owner - occupied houses in 2022 in Rowlett, TX
-
- 11Less than $10,000
- 80$10,000 to $14,999
- 8$15,000 to $19,999
- 79$20,000 to $24,999
- 93$25,000 to $29,999
- 32$30,000 to $34,999
- 69$35,000 to $39,999
- 108$40,000 to $49,999
- 6$50,000 to $59,999
- 16$60,000 to $69,999
- 8$80,000 to $89,999
- 12$90,000 to $99,999
- 127$100,000 to $124,999
- 99$125,000 to $149,999
- 472$150,000 to $174,999
- 458$175,000 to $199,999
- 2,291$200,000 to $249,999
- 4,286$250,000 to $299,999
- 6,584$300,000 to $399,999
- 2,626$400,000 to $499,999
- 1,520$500,000 to $749,999
- 234$750,000 to $999,999
- 36$1,000,000 to $1,499,999
- 30$1,500,000 to $1,999,999
- 185$2,000,000 or more
Rent paid by renters in 2022 in Rowlett, TX
-
- 23Less than $100
- 45$100 to $149
- 11$350 to $399
- 46$400 to $449
- 121$500 to $549
- 10$550 to $599
- 12$700 to $749
- 71$800 to $899
- 25$900 to $999
- 724$1,000 to $1,249
- 982$1,250 to $1,499
- 1,612$1,500 to $1,999
- 885$2,000 to $2,499
- 116$2,500 to $2,999
- 51$3,000 to $3,499
- 8$3,500 or more
- 316No cash rent


Percentage of workers working in this county: 70.7%
Number of people working at home: 5,356 (15.5% of all workers)
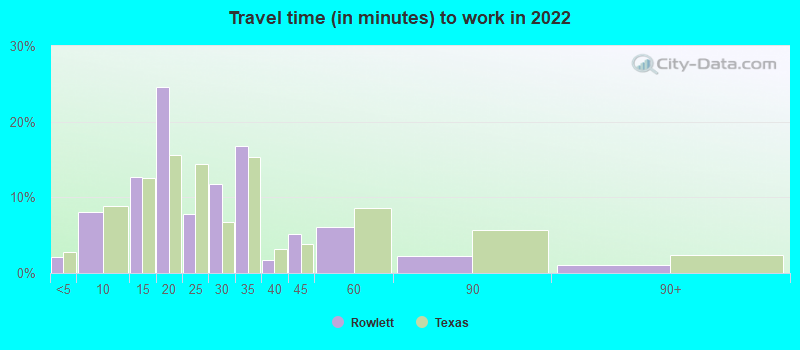
Travel time to work (commute)
- Less than 5 minutes: 337
- 5 to 9 minutes: 865
- 10 to 14 minutes: 2,164
- 15 to 19 minutes: 3,694
- 20 to 24 minutes: 3,243
- 25 to 29 minutes: 2,182
- 30 to 34 minutes: 5,716
- 35 to 39 minutes: 1,649
- 40 to 44 minutes: 2,993
- 45 to 59 minutes: 4,342
- 60 to 89 minutes: 3,337
- 90 or more minutes: 519
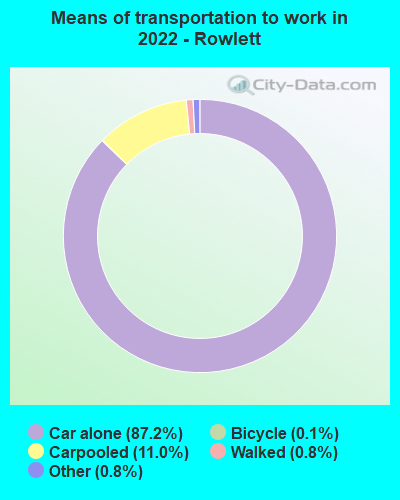
Means of transportation to work:
- Drove a car alone: 11,839 (65.5%)
- Carpooled: 1,537 (8.5%)
- Taxi: 137 (0.8%)
- Bicycle: 21 (0.1%)
- Walked: 119 (0.7%)
- Worked at home: 5,356 (29.6%)

- Unemployment by race in 2022
- Unemployment rate for White non-Hispanic residents
- 2.3%Males
- 3.8%Females
- Unemployment rate for Black residents
- 9.4%Males
- 5.6%Females
- Unemployment rate for American Indian and Alaska Native residents
- 9.2%Females
- Unemployment rate for Asian residents
- 1.0%Males
- 2.4%Females
- Unemployment rate for two or more race residents
- 0.6%Males
- Unemployment rate for Hispanic or Latino residents
- 0.2%Males
- 2.7%Females

- Year of entry for the foreign-born population in Rowlett, Texas
- 1,9982010 or later
- 2,6822000 to 2009
- 2,2921990 to 1999
- 1,0771980 to 1989
- 5211970 to 1979
- 358Before 1970

First ancestries reported:
- English: 2,654 (8.0%)
- Irish: 2,218 (6.7%)
- American: 1,869 (5.6%)
- German: 1,592 (4.8%)
- Ethiopian: 1,336 (4.0%)
- Italian: 496 (1.5%)
- Nigerian: 384 (1.2%)
- European: 372 (1.1%)
- Scottish: 297 (0.9%)
- Scotch-Irish: 257 (0.8%)
- African: 210 (0.6%)
- Polish: 208 (0.6%)
- Egyptian: 164 (0.5%)
- Dutch: 150 (0.5%)
- Czech: 146 (0.4%)
- French Canadian: 134 (0.4%)
- French: 114 (0.3%)
- Welsh: 105 (0.3%)
- British: 89 (0.3%)
- Swedish: 83 (0.2%)
- Northern European: 76 (0.2%)
- Jamaican: 69 (0.2%)
- Eastern European: 59 (0.2%)
- Haitian: 57 (0.2%)
- Iranian: 49 (0.1%)
- Slavic: 46 (0.1%)
- Lebanese: 42 (0.1%)
- South African: 41 (0.1%)
- Belgian: 31 (0.09%)
- Norwegian: 30 (0.09%)
- Ukrainian: 29 (0.09%)
- Cajun: 26 (0.08%)
- Swiss: 23 (0.07%)
- Basque: 21 (0.06%)
- Portuguese: 19 (0.06%)
- Hungarian: 18 (0.05%)
- Greek: 16 (0.05%)
- Yugoslavian: 16 (0.05%)
- Canadian: 15 (0.05%)
- Russian: 10 (0.03%)
- Romanian: 8 (0.02%)
- Czechoslovakian: 8 (0.02%)
- Lithuanian: 7 (0.02%)
- Finnish: 7 (0.02%)
- British West Indian: 7 (0.02%)
- Danish: 5 (0.02%)
Most common places of birth for foreign-born residents (%):
| Rowlett: | 24.7% (2,546) |
| Texas: | 48.4% (2,411,723) |
| Rowlett: | 11.6% (1,197) |
| Texas: | 3.7% (184,770) |
| Rowlett: | 11.1% (1,144) |
| Texas: | 0.5% (24,705) |
| Rowlett: | 8.0% (823) |
| Texas: | 2.1% (103,148) |
| Rowlett: | 5.4% (556) |
| Texas: | 6.1% (306,347) |
| Rowlett: | 2.7% (277) |
| Texas: | 0.1% (5,522) |
| Rowlett: | 2.4% (252) |
| Texas: | 1.9% (96,110) |
| Rowlett: | 2.3% (236) |
| Texas: | 0.4% (21,746) |
| Rowlett: | 2.0% (204) |
| Texas: | 1.2% (62,159) |
| Rowlett: | 1.8% (189) |
| Texas: | 0.3% (15,833) |
| Rowlett: | 1.5% (155) |
| Texas: | 1.2% (61,555) |
Place of birth for U.S.-born residents:
- This state: 36,061
- Other state: 17,351
- Northeast: 1,643
- Midwest: 5,920
- South: 7,583
- West: 2,205
85.6% of Rowlett residents lived in the same house 1 years ago.
Out of people who lived in different houses, 36.1% lived in this county.
Out of people who lived in different counties, 71.5% lived in Texas.
| Rowlett: | 85.6% |
| State average: | 85.7% |
Education attainment for males 25 years and older:
- No schooling: 345
- Nursery to 4th grade: 0
- 5th and 6th grade: 137
- 7th and 8th grade: 261
- 9th grade: 0
- 10th grade: 0
- 11th grade: 845
- 12th grade, no diploma: 1,135
- High school graduate (or equivalency): 3,938
- Less than 1 year of college: 1,902
- Some college more than 1 year, no degree: 3,084
- Associate degree: 1,728
- Bachelor's degree: 6,298
- Master's degree: 2,396
- Professional school degree: 271
- Doctorate degree: 352

Education attainment for females 25 years and older:
- No schooling: 312
- Nursery to 4th grade: 0
- 5th and 6th grade: 261
- 7th and 8th grade: 252
- 9th grade: 104
- 10th grade: 48
- 11th grade: 145
- 12th grade, no diploma: 453
- High school graduate (or equivalency): 5,595
- Less than 1 year of college: 2,579
- Some college more than 1 year, no degree: 2,546
- Associate degree: 1,485
- Bachelor's degree: 6,732
- Master's degree: 2,116
- Professional school degree: 729
- Doctorate degree: 61


Housing units in structures:
- One, detached: 19,573
- One, attached: 285
- Two: 106
- 3 or 4: 146
- 5 to 9: 250
- 10 to 19: 219
- 20 to 49: 390
- 50 or more: 1,219
- Mobile homes: 400
Median worth of mobile homes: $30,667
House/condo owner moved in on average 11 years ago
Renter moved in on average 2 years ago

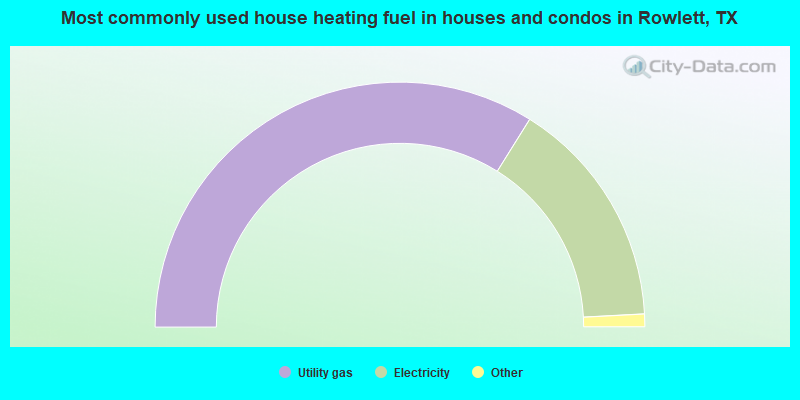
- 67.8%Utility gas
- 30.5%Electricity
- 1.2%Bottled, tank, or LP gas
- 0.2%Solar energy
- 0.2%No fuel used
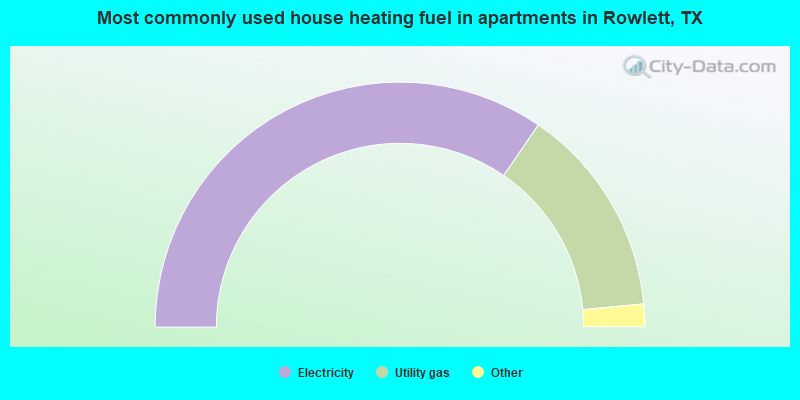
- 69.2%Electricity
- 27.9%Utility gas
- 2.4%Bottled, tank, or LP gas
- 0.6%No fuel used
Private vs. public school enrollment:
| Here: | 13.4% |
| Texas: | 8.8% |
| Here: | 5.8% |
| Texas: | 8.0% |
| Here: | 21.9% |
| Texas: | 16.2% |


