Sabine, TX (Texas) Houses and Residents
| Sabine: | $163,364 |
| Texas: | $275,400 |
Total population: 7,923 (Urban population: 413 (all inside urban clusters), Rural population: 7,128 (24 farm, 7,104 nonfarm))
Houses: 2,981 (2,741 occupied: 2,314 owner occupied, 427 renter occupied)
| % of renters here: | 16% |
| State: | 38% |
Housing density: 51 houses/condos per square mile
Median price asked for vacant for-sale houses and condos in 2022 in this county: $184,579.
Median contract rent in 2022: $747 (lower quartile is $563, upper quartile is $1,080)
Median rent asked for vacant for-rent units in 2022: $727
Median gross rent in Sabine, TX in 2022: $1,103
Housing units in Sabine with a mortgage: 665 (8 second mortgage, 24 home equity loan, 0 both second mortgage and home equity loan)
Houses without a mortgage: 685
Compare current foreclosures near Sabine, TX:
| Photo | Address | Area | Beds / Baths | Price | Details |
|---|---|---|---|---|---|

|
#1
White Cedar Rd
Big Sandy, TX 75755
|
999 sq. feet
|
1 baths 2 beds |
$174,900
|
show details |

|
#2
H G Moseley Pkwy
Longview, TX 75604
|
- sq. feet
|
3 baths 4 beds |
$309,900
|
show details |

|
#3
Inwood Rd
Longview, TX 75601
|
3,332 sq. feet
|
4 baths 5 beds |
show details | |

|
#4
Cates Ln
White Oak, TX 75693
|
1,325 sq. feet
|
1 baths 3 beds |
show details | |

|
#5
Rose Row Ln
Winona, TX 75792
|
1,725 sq. feet
|
2 baths 3 beds |
show details | |

|
#6
S Lake Harris Rd
White Oak, TX 75693
|
1,500 sq. feet
|
2 baths 3 beds |
show details | |

|
#7
Matt Dr
Longview, TX 75605
|
1,316 sq. feet
|
2 baths 3 beds |
show details | |

|
#8
Neal St
Longview, TX 75602
|
2,517 sq. feet
|
3 baths - beds |
show details | |

|
#9
W Harold St
Gladewater, TX 75647
|
2,297 sq. feet
|
2 baths 3 beds |
show details | |

|
#10
W Garfield Dr
Longview, TX 75602
|
2,704 sq. feet
|
2 baths - beds |
show details |
| Photo | Address | Area | Beds / Baths | Price | Details |
|---|---|---|---|---|---|

|
#11
W Groves St
Big Sandy, TX 75755
|
- sq. feet
|
1 baths 3 beds |
show details | |

|
#12
Wood Pl
Longview, TX 75601
|
2,238 sq. feet
|
2 baths - beds |
show details | |

|
#13
Fm 850
Arp, TX 75750
|
1,637 sq. feet
|
2 baths - beds |
show details | |

|
#14
Roosevelt Dr
Tyler, TX 75705
|
1,370 sq. feet
|
1 baths - beds |
show details | |

|
#15
Gilmer Rd # 101
Longview, TX 75604
|
7,475 sq. feet
|
4 baths - beds |
show details | |

|
#16
Ferndale St
Longview, TX 75604
|
2,278 sq. feet
|
2 baths - beds |
show details | |

|
#17
E George Richey Rd
Longview, TX 75604
|
1,152 sq. feet
|
1 baths - beds |
show details | |

|
#18
Webster St
Longview, TX 75602
|
1,787 sq. feet
|
2 baths - beds |
show details | |

|
#19
Sweet Gum Rd
Big Sandy, TX 75755
|
2,432 sq. feet
|
2 baths - beds |
show details | |

|
#20
Dowell Dr
Longview, TX 75604
|
1,783 sq. feet
|
2 baths - beds |
show details |
| Photo | Address | Area | Beds / Baths | Price | Details |
|---|---|---|---|---|---|

|
#21
Crossroads Dr
Longview, TX 75605
|
1,827 sq. feet
|
2 baths - beds |
show details | |

|
#22
Camille Dr
Longview, TX 75605
|
1,841 sq. feet
|
2 baths - beds |
show details | |

|
#23
Amberwood Dr
Longview, TX 75605
|
2,011 sq. feet
|
2 baths - beds |
show details | |

|
#24
County Road 358
Winona, TX 75792
|
1,152 sq. feet
|
2 baths - beds |
show details | |

|
#25
Sidney St
Longview, TX 75602
|
1,872 sq. feet
|
2 baths - beds |
show details | |

|
#26
Johnson St
Longview, TX 75602
|
1,300 sq. feet
|
2 baths - beds |
show details | |

|
#27
S 13th St
Longview, TX 75602
|
1,448 sq. feet
|
2 baths - beds |
show details | |

|
#28
Le Duke Blvd
Longview, TX 75601
|
3,435 sq. feet
|
3 baths - beds |
show details | |

|
#29
Willow Oak Dr
Longview, TX 75601
|
1,968 sq. feet
|
2 baths - beds |
show details | |

|
#30
Mary Jane Dr
Longview, TX 75601
|
1,707 sq. feet
|
2 baths - beds |
show details |
| Photo | Address | Area | Beds / Baths | Price | Details |
|---|---|---|---|---|---|

|
#31
Ruthlynn Dr
Longview, TX 75605
|
2,232 sq. feet
|
2 baths - beds |
show details | |

|
#32
Bob O Link Rd
Gladewater, TX 75647
|
900 sq. feet
|
2 baths - beds |
show details | |

|
#33
Walters St
Longview, TX 75603
|
1,144 sq. feet
|
1 baths - beds |
show details | |

|
#34
Almond Rd
Big Sandy, TX 75755
|
1,248 sq. feet
|
3 baths - beds |
show details | |

|
#35
Shady Ln
Longview, TX 75604
|
2,130 sq. feet
|
2 baths - beds |
show details | |

|
#36
Adams Rd
Longview, TX 75604
|
1,944 sq. feet
|
2 baths - beds |
show details | |

|
#37
State Highway 64 E
Arp, TX 75750
|
1,681 sq. feet
|
2 baths - beds |
show details | |

|
#38
Jane Ln
Winona, TX 75792
|
1,710 sq. feet
|
2 baths - beds |
show details | |

|
#39
S Lake Harris Rd
White Oak, TX 75693
|
1,880 sq. feet
|
2 baths - beds |
show details | |

|
#40
Larkspur St
White Oak, TX 75693
|
1,842 sq. feet
|
2 baths - beds |
show details |
| Photo | Address | Area | Beds / Baths | Price | Details |
|---|---|---|---|---|---|

|
#41
Lockerplant Rd
Gladewater, TX 75647
|
624 sq. feet
|
1 baths - beds |
show details | |

|
#42
S White Oak Rd
White Oak, TX 75693
|
1,577 sq. feet
|
2 baths - beds |
show details | |

|
#43
Dallas St
Winona, TX 75792
|
1,388 sq. feet
|
1 baths - beds |
show details | |

|
#44
Allison St
Gladewater, TX 75647
|
1,770 sq. feet
|
2 baths - beds |
show details | |

|
#45
E Ridge Cir
Arp, TX 75750
|
2,000 sq. feet
|
2 baths - beds |
show details | |

|
#46
Royal Dr
Kilgore, TX 75662
|
2,246 sq. feet
|
2 baths - beds |
show details | |

|
#47
Butler St
Arp, TX 75750
|
1,676 sq. feet
|
1 baths - beds |
show details | |

|
#48
Fairview Dr
Longview, TX 75604
|
2,013 sq. feet
|
1 baths - beds |
show details | |

|
#49
Higginbotham Rd
Kilgore, TX 75662
|
1,514 sq. feet
|
1 baths - beds |
show details | |

|
Check over 1 million property listings on Foreclosure.com!
|
browse all offers | |||

Household type by relationship:
Households: 117,316- In family households: 99,813 (21,144 male householders, 10,044 female householders)
22,022 spouses, 35,026 children (31,861 natural, 776 adopted, 2,389 stepchildren), 3,792 grandchildren, 1,355 brothers or sisters, 930 parents, foster children, 2,032 other relatives, 2,686 non-relatives
- In nonfamily households: 17,503 (6,685 male householders (5,324 living alone)), 7,925 female householders (7,039 living alone)), 2,893 nonrelatives
- In group quarters: 4,414 (2,194 institutionalized population)
18,548 married couples with children.
7,554 single-parent households (1,466 men, 6,088 women).
94.5% of residents of Sabine speak English at home.
5.2% of residents speak Spanish at home (54% speak English very well, 37% speak English well, 9% speak English not well).
0.2% of residents speak other Indo-European language at home (100% speak English very well).
0.1% of residents speak Asian or Pacific Island language at home (100% speak English well).
Foreign born population: 457 (5.4%)
(67.6% of them are naturalized citizens)
| Here: | 6.1 |
| State: | 6.3 |
| Here: | 4.2 |
| State: | 4.0 |

- Bedrooms in owner-occupied houses and condos in Sabine, Texas
- 35no bedroom
- 881 bedroom
- 4692 bedrooms
- 1,4273 bedrooms
- 2824 bedrooms
- 135+ bedrooms

- Bedrooms in renter-occupied apartments in Sabine, Texas
- 16no bedroom
- 841 bedroom
- 2472 bedrooms
- 683 bedrooms
- 124 bedrooms
- 05+ bedrooms

- Cars and other vehicles available in Sabine in owner-occupied houses/condos
- 97no vehicle
- 6781 vehicle
- 1,0252 vehicles
- 3333 vehicles
- 1464 vehicles
- 355+ vehicles

- Cars and other vehicles available in Sabine in renter-occupied apartments
- 40no vehicle
- 2021 vehicle
- 1572 vehicles
- 203 vehicles
- 84 vehicles
- 05+ vehicles

- Rooms in owner-occupied houses in Sabine, Texas
- 111 room
- 112 rooms
- 1193 rooms
- 2504 rooms
- 8805 rooms
- 5746 rooms
- 2657 rooms
- 1568 rooms
- 489+ rooms

- Rooms in renter-occupied apartments in Sabine, Texas
- 161 room
- 192 rooms
- 663 rooms
- 1544 rooms
- 945 rooms
- 466 rooms
- 207 rooms
- 128 rooms
- 09+ rooms


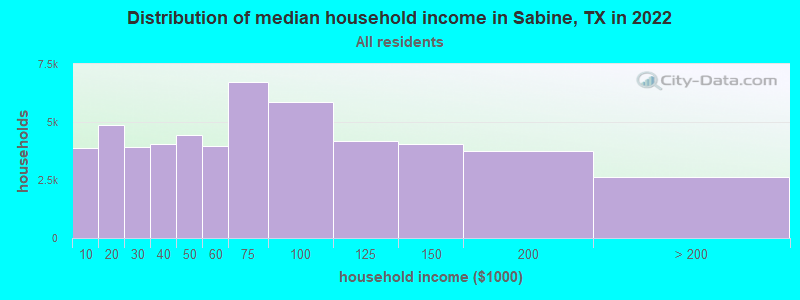
Sabine, TX household income distribution

- 3,870Less than $10,000
- 4,861$10,000 to $19,999
- 3,914$20,000 to $29,999
- 4,047$30,000 to $39,999
- 4,434$40,000 to $49,999
- 3,985$50,000 to $59,999
- 6,716$60,000 to $74,999
- 5,863$75,000 to $99,999
- 4,166$100,000 to $124,999
- 4,031$125,000 to $149,999
- 3,768$150,000 to $199,999
- 2,628$200,000 or more
Percentage of workers working in this county: 80.8%
Number of people working at home: 543 (11.3% of all workers)
Travel time to work (commute)
- Less than 5 minutes: 127
- 5 to 9 minutes: 224
- 10 to 14 minutes: 717
- 15 to 19 minutes: 736
- 20 to 24 minutes: 622
- 25 to 29 minutes: 256
- 30 to 34 minutes: 383
- 35 to 39 minutes: 62
- 40 to 44 minutes: 17
- 45 to 59 minutes: 135
- 60 to 89 minutes: 85
- 90 or more minutes: 91
Means of transportation to work:
- Drove a car alone: 2,981 (85.6%)
- Carpooled: 387 (11.1%)
- Streetcar or trolley car: 10 (0.3%)
- Walked: 14 (0.4%)
- Other means: 63 (1.8%)
- Worked at home: 29 (0.8%)


- Year of entry for the foreign-born population in Sabine, Texas
- 801995 to March 2000
- 01990 to 1994
- 261985 to 1989
- 501980 to 1984
- 571975 to 1979
- 01970 to 1974
- 01965 to 1969
- 15Before 1965
Most common places of birth for foreign-born residents (%):
| Sabine: | 76.3% (174) |
| Texas: | 64.8% (1,879,369) |
| Sabine: | 8.3% (19) |
| Texas: | 1.6% (45,907) |
| Sabine: | 6.1% (14) |
| Texas: | 3.7% (107,027) |
| Sabine: | 3.9% (9) |
| Texas: | 0.1% (3,869) |
| Sabine: | 2.6% (6) |
| Texas: | 1.2% (36,176) |
| Sabine: | 2.6% (6) |
| Texas: | 1.4% (39,249) |
Place of birth for U.S.-born residents:
- This state: 5,502
- Other state: 1,781
- Northeast: 61
- Midwest: 446
- South: 1,098
- West: 176
60% of Sabine residents lived in the same house 5 years ago.
Out of people who lived in different houses, 60% lived in this county.
Out of people who lived in different counties, 80% lived in Texas.
Education attainment for males 25 years and older:
- No schooling: 35
- Nursery to 4th grade: 12
- 5th and 6th grade: 24
- 7th and 8th grade: 106
- 9th grade: 36
- 10th grade: 111
- 11th grade: 110
- 12th grade, no diploma: 121
- High school graduate (or equivalency): 613
- Less than 1 year of college: 238
- Some college more than 1 year, no degree: 472
- Associate degree: 174
- Bachelor's degree: 189
- Master's degree: 55
- Professional school degree: 32
- Doctorate degree: 16

Education attainment for females 25 years and older:
- No schooling: 12
- Nursery to 4th grade: 0
- 5th and 6th grade: 58
- 7th and 8th grade: 90
- 9th grade: 65
- 10th grade: 150
- 11th grade: 119
- 12th grade, no diploma: 118
- High school graduate (or equivalency): 729
- Less than 1 year of college: 216
- Some college more than 1 year, no degree: 399
- Associate degree: 223
- Bachelor's degree: 193
- Master's degree: 120
- Professional school degree: 42
- Doctorate degree: 6


Housing units in structures:
- One, detached: 1,774
- One, attached: 36
- 3 or 4: 97
- 5 to 9: 14
- 50 or more: 27
- Mobile homes: 1,033
Median worth of mobile homes: $40,509

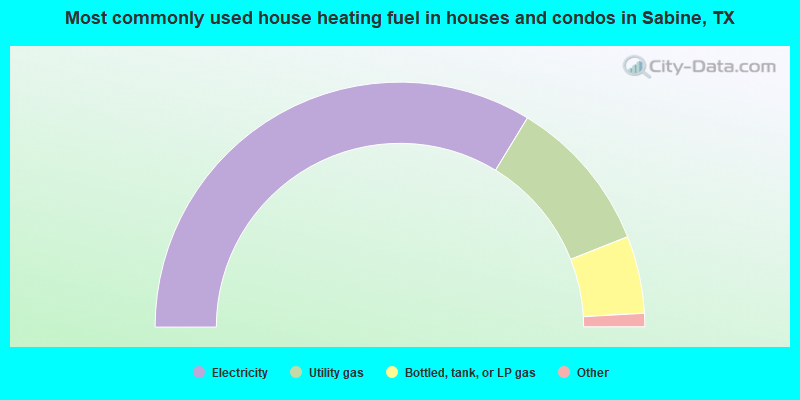
- 67.5%Electricity
- 20.6%Utility gas
- 10.2%Bottled, tank, or LP gas
- 1.3%Wood
- 0.5%No fuel used
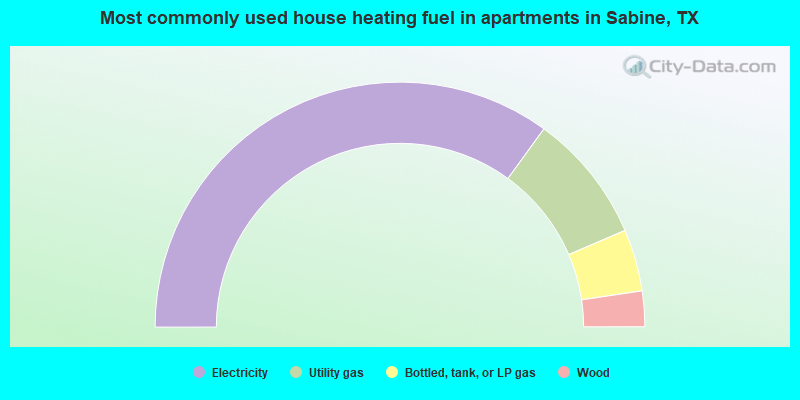
- 70.0%Electricity
- 17.1%Utility gas
- 8.2%Bottled, tank, or LP gas
- 4.7%Wood
Private vs. public school enrollment:
| Here: | 3.7% |
| Texas: | 6.8% |
| Here: | 0.0% |
| Texas: | 6.2% |
| Here: | 10.6% |
| Texas: | 15.4% |


