Races in Sabine, Texas (TX) Detailed Stats
Ancestries, Foreign-born residents, place of birth
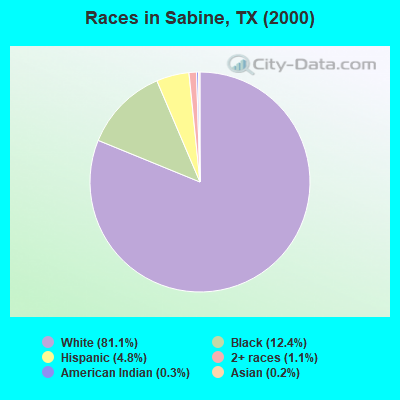
Race distribution in Sabine

- 6,11781.1%White alone
- 93712.4%Black alone
- 3634.8%Hispanic
- 841.1%Two or more races
- 240.3%American Indian alone
- 140.2%Asian alone
- 10.01%Other race alone
- 10.01%Native Hawaiian and Other
Pacific Islander alone
2000
2022
-
- 10,933,31352.4%White alone
- 6,669,66632.0%Hispanic
- 2,364,25511.3%Black alone
- 554,4452.7%Asian alone
- 230,5671.1%Two or more races
- 68,8590.3%American Indian alone
- 19,9580.10%Other race alone
- 10,7570.05%Native Hawaiian and Other
Pacific Islander alone

-
- 12,070,64240.2%Hispanic
- 11,683,43038.9%White alone
- 3,508,70611.7%Black alone
- 1,608,1735.4%Asian alone
- 956,5603.2%Two or more races
- 125,7630.4%Other race alone
- 47,0230.2%American Indian alone
- 29,2750.10%Native Hawaiian and Other
Pacific Islander alone

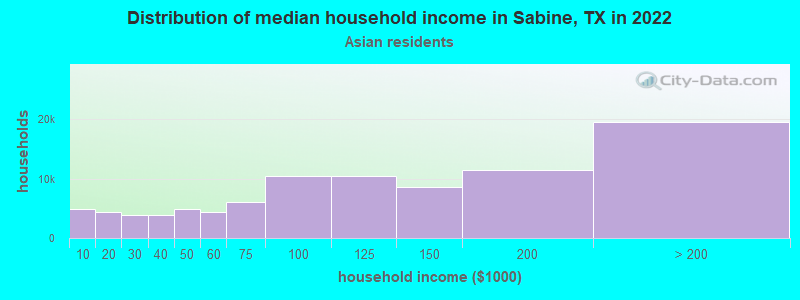
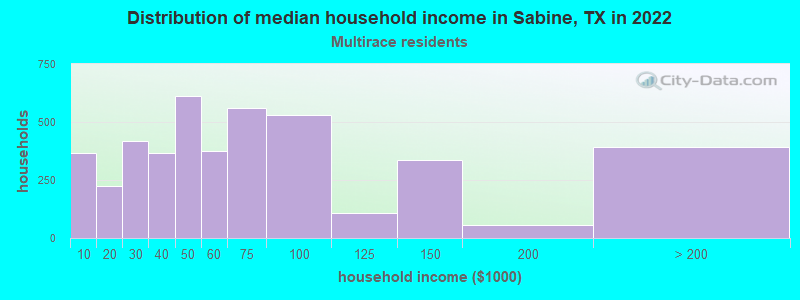
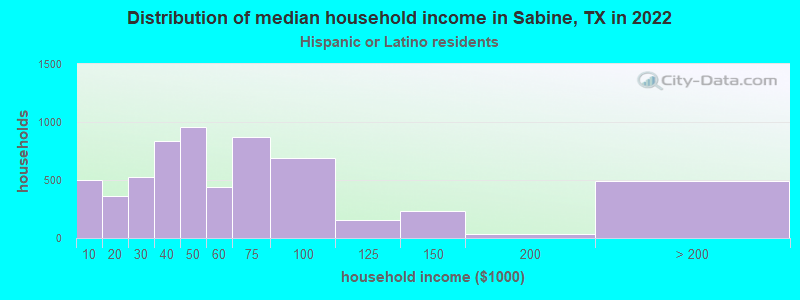
Income and house value in Sabine
- Median household income in 2022
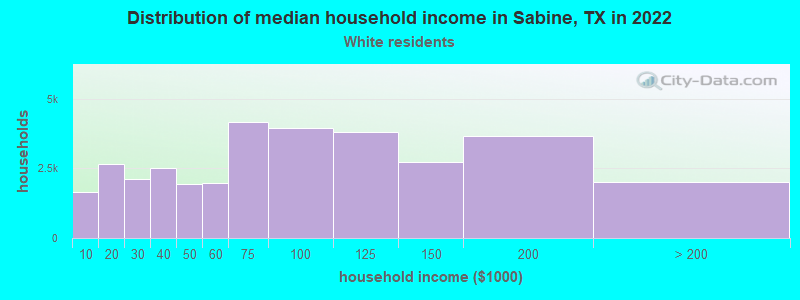
- $80,983White non-Hispanic householders
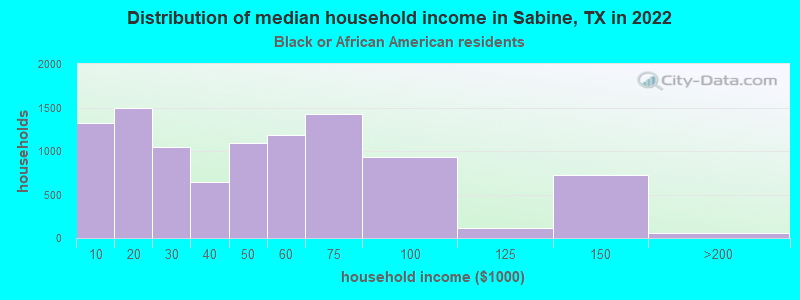
- $39,923Black householders
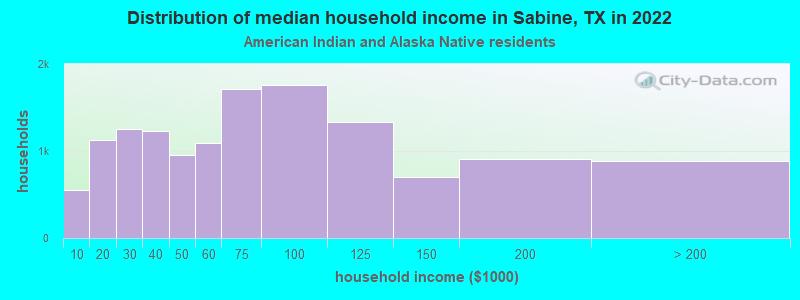
- $22,739American Indian and Alaska Native householders
- $18,638Asian householders
- $68,861Some other race householders
- $42,140Two or more races householders
- $52,948Hispanic or Latino race householders
- Median 2022 house value
- $205,046White Non-Hispanic householders
- $171,130Black or African American householders
- $220,062American Indian or Alaska Native householders
- $228,605Some other race householders
- $58,251Two or more races householders
- $227,311Hispanic or Latino householders
Household income for White non-Hispanic householders
Household income for Black householders
Household income for American Indian and Alaska Native householders
Household income for Asian householders
Household income for Two or more races householders
Household income for Hispanic or Latino race householders
Zip code: 75662