Estimated zip code population in 2022: 25,302 Zip code population in 2010: 24,536 Zip code population in 2000: 22,017
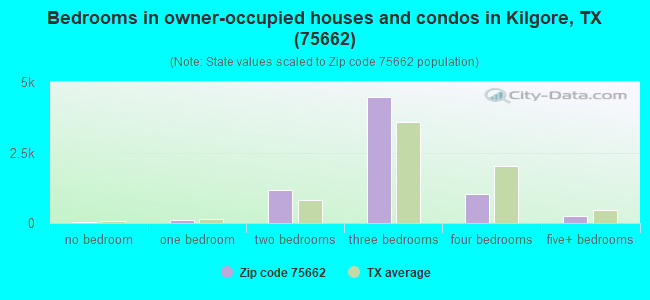
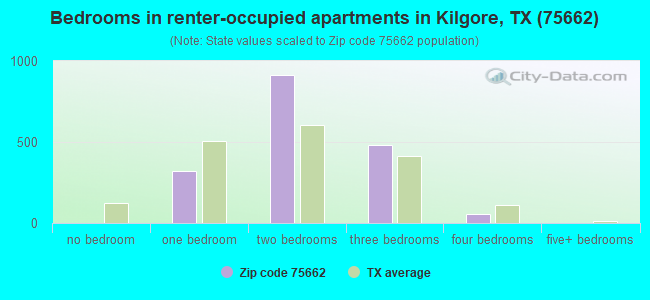
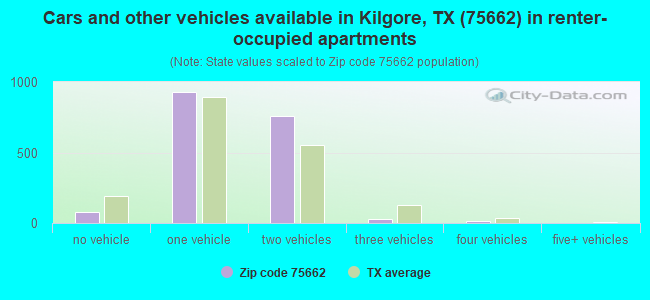
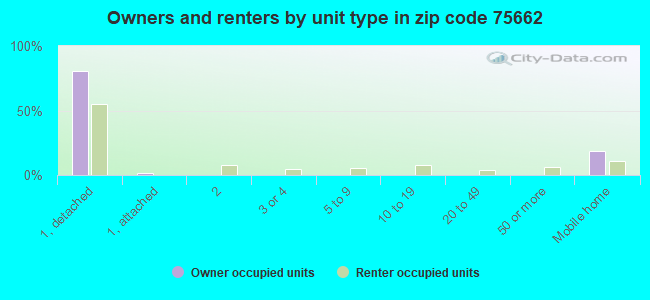
Houses and condos: 9,994 Renter-occupied apartments: 1,807
% of renters here:
20%
State:
38%
March 2022 cost of living index in zip code 75662: 82.4 (low, U.S. average is 100)
Land area: 127.6 sq. mi. Water area: 0.2 sq. mi.
Population density: 198 people per square mile
(very low).
OSM Map
General Map
Google Map
MSN Map
OSM Map
General Map
Google Map
MSN Map
OSM Map
General Map
Google Map
MSN Map
OSM Map
General Map
Google Map
MSN Map
Please wait while loading the map...
Real estate property taxes paid for housing units in 2022:
This zip code:
1.0% ($1,858)
Texas:
1.5% ($4,050)
Median real estate property taxes paid for housing units with mortgages in 2022: $2,516 (1.3%) Median real estate property taxes paid for housing units with no mortgage in 2022: $1,333 (0.9%)
Averages for the 2020 tax year for zip code 75662, filed in 2021:
Average Adjusted Gross Income (AGI) in 2020: $48,911 (Individual Income Tax Returns)
Here:
$48,911
State:
$77,054
Salary/wage: $44,994 (reported on 84.8% of returns)
Here:
$44,994
State:
$62,766
(% of AGI for various income ranges: 1277.3% for AGIs below $25k, 3517.5% for AGIs $25k-50k, 6241.3% for AGIs $50k-75k, 9206.5% for AGIs $75k-100k, 15795.6% for AGIs $100k-200k, 33596.7% for AGIs over 200k)
Taxable interest for individuals: $1,042 (reported on 22.8% of returns)
This zip code:
$1,042
Texas:
$2,665
(% of AGI for various income ranges: 8.1% for AGIs below $25k, 8.6% for AGIs $25k-50k, 30.3% for AGIs $50k-75k, 31.0% for AGIs $75k-100k, 95.1% for AGIs $100k-200k, 902.2% for AGIs over 200k)
Ordinary dividends: $5,244 (reported on 9.7% of returns)
Here:
$5,244
State:
$10,044
(% of AGI for various income ranges: 11.9% for AGIs below $25k, 19.3% for AGIs $25k-50k, 32.9% for AGIs $50k-75k, 98.4% for AGIs $75k-100k, 228.9% for AGIs $100k-200k, 2042.2% for AGIs over 200k)
Net capital gain/loss in AGI: +$6,645 (reported on 9.8% of returns)
Here:
+$6,645
State:
+$39,590
(% of AGI for various income ranges: 3.2% for AGIs below $25k, 14.5% for AGIs $25k-50k, 40.2% for AGIs $50k-75k, 95.2% for AGIs $75k-100k, 339.9% for AGIs $100k-200k, 3208.9% for AGIs over 200k)
Profit/loss from business: +$3,642 (reported on 18.7% of returns)
Here:
+$3,642
State:
+$10,888
(% of AGI for various income ranges: 70.5% for AGIs below $25k, 15.2% for AGIs $25k-50k, 71.8% for AGIs $50k-75k, 46.7% for AGIs $75k-100k, 320.0% for AGIs $100k-200k, 1306.7% for AGIs over 200k)
Taxable individual retirement arrangement distribution: $21,368 (reported on 6.9% of returns)
75662:
$21,368
Texas:
$24,740
(% of AGI for various income ranges: 46.2% for AGIs below $25k, 77.2% for AGIs $25k-50k, 230.7% for AGIs $50k-75k, 332.0% for AGIs $75k-100k, 671.4% for AGIs $100k-200k, 2880.0% for AGIs over 200k)
Total itemized deductions: $42,639 (reported on 4.6% of returns)
Here:
$42,639
State:
$40,428
(% of AGI for various income ranges: 46.2% for AGIs below $25k, 159.4% for AGIs $25k-50k, 269.6% for AGIs $50k-75k, 568.1% for AGIs $75k-100k, 729.1% for AGIs $100k-200k, 3780.0% for AGIs over 200k)
Charity contributions: $10,771 (reported on 3.3% of returns)
Here:
$10,771
State:
$18,201
(% of AGI for various income ranges: 4.0% for AGIs below $25k, 13.9% for AGIs $25k-50k, 34.2% for AGIs $50k-75k, 55.2% for AGIs $75k-100k, 182.9% for AGIs $100k-200k, 1385.6% for AGIs over 200k)
Taxes paid: $7,291 (reported on 4.1% of returns)
75662:
$7,291
State:
$7,821
(% of AGI for various income ranges: 6.2% for AGIs below $25k, 23.9% for AGIs $25k-50k, 51.6% for AGIs $50k-75k, 63.8% for AGIs $75k-100k, 126.7% for AGIs $100k-200k, 480.0% for AGIs over 200k)
Earned income credit: $2,510 (reported on 23.4% of returns)
Here:
$2,510
State:
$2,584
(% of AGI for various income ranges: 127.4% for AGIs below $25k, 87.9% for AGIs $25k-50k, 2.2% for AGIs $50k-75k)
Percentage of individuals using paid preparers for their 2020 taxes: 93.5%
Here:
93%
State:
92%
(% for various income ranges: 92.8% for AGIs below $25k, 95.1% for AGIs $25k-50k, 93.2% for AGIs $50k-75k, 93.5% for AGIs $75k-100k, 92.5% for AGIs $100k-200k, 89.5% for AGIs over 200k)
Averages for the 2012 tax year for zip code 75662, filed in 2013:
Average Adjusted Gross Income (AGI) in 2012: $50,793 (Individual Income Tax Returns)
Here:
$50,793
State:
$65,384
Salary/wage: $45,409 (reported on 87.9% of returns)
Here:
$45,409
State:
$52,524
(% of AGI for various income ranges: 82.3% for AGIs below $25k, 86.9% for AGIs $25k-50k, 85.2% for AGIs $50k-75k, 82.0% for AGIs $75k-100k, 80.0% for AGIs $100k-200k, 51.2% for AGIs over 200k)
Taxable interest for individuals: $1,116 (reported on 23.8% of returns)
This zip code:
$1,116
Texas:
$2,372
(% of AGI for various income ranges: 0.8% for AGIs below $25k, 0.4% for AGIs $25k-50k, 0.4% for AGIs $50k-75k, 0.3% for AGIs $75k-100k, 0.8% for AGIs $100k-200k, 0.5% for AGIs over 200k)
Ordinary dividends: $5,649 (reported on 10.7% of returns)
Here:
$5,649
State:
$9,721
(% of AGI for various income ranges: 0.7% for AGIs below $25k, 0.7% for AGIs $25k-50k, 0.6% for AGIs $50k-75k, 0.6% for AGIs $75k-100k, 1.1% for AGIs $100k-200k, 3.8% for AGIs over 200k)
Net capital gain/loss in AGI: +$6,448 (reported on 8.7% of returns)
Here:
+$6,448
State:
+$35,319
(% of AGI for various income ranges: 0.1% for AGIs $25k-50k, 0.4% for AGIs $50k-75k, 1.0% for AGIs $75k-100k, 1.4% for AGIs $100k-200k, 3.7% for AGIs over 200k)
Profit/loss from business: +$12,126 (reported on 15.0% of returns)
Here:
+$12,126
State:
+$13,732
(% of AGI for various income ranges: 6.2% for AGIs below $25k, 2.0% for AGIs $25k-50k, 1.6% for AGIs $50k-75k, 1.7% for AGIs $75k-100k, 4.6% for AGIs $100k-200k, 6.8% for AGIs over 200k)
Taxable individual retirement arrangement distribution: $15,061 (reported on 7.6% of returns)
75662:
$15,061
Texas:
$19,511
(% of AGI for various income ranges: 2.8% for AGIs below $25k, 1.5% for AGIs $25k-50k, 1.9% for AGIs $50k-75k, 3.0% for AGIs $75k-100k, 2.2% for AGIs $100k-200k, 2.6% for AGIs over 200k)
Self-employment retirement plans: $22,200 (reported on 0.2% of returns)
75662:
$22,200
Texas:
$23,938
Total itemized deductions: $21,199 (21% of AGI, reported on 19.0% of returns)
Here:
$21,199
State:
$24,724
Here:
20.8% of AGI
State:
15.9% of AGI
(% of AGI for various income ranges: 6.5% for AGIs below $25k, 7.0% for AGIs $25k-50k, 8.0% for AGIs $50k-75k, 8.1% for AGIs $75k-100k, 9.8% for AGIs $100k-200k, 6.8% for AGIs over 200k)
Charity contributions: $6,117 (reported on 13.5% of returns)
Here:
$6,117
State:
$6,808
(% of AGI for various income ranges: 0.6% for AGIs below $25k, 1.0% for AGIs $25k-50k, 1.2% for AGIs $50k-75k, 1.7% for AGIs $75k-100k, 2.3% for AGIs $100k-200k, 2.4% for AGIs over 200k)
Taxes paid: $3,872 (reported on 18.1% of returns)
75662:
$3,872
State:
$6,921
(% of AGI for various income ranges: 0.8% for AGIs below $25k, 0.9% for AGIs $25k-50k, 1.2% for AGIs $50k-75k, 1.5% for AGIs $75k-100k, 2.1% for AGIs $100k-200k, 1.3% for AGIs over 200k)
Earned income credit: $2,333 (reported on 21.7% of returns)
Here:
$2,333
State:
$2,570
(% of AGI for various income ranges: 8.3% for AGIs below $25k, 1.1% for AGIs $25k-50k)
Percentage of individuals using paid preparers for their 2012 taxes: 57.8%
Here:
58%
State:
51%
(% for various income ranges: 54.1% for AGIs below $25k, 57.3% for AGIs $25k-50k, 59.9% for AGIs $50k-75k, 60.4% for AGIs $75k-100k, 63.3% for AGIs $100k-200k, 88.2% for AGIs over 200k)
Averages for the 2004 tax year for zip code 75662, filed in 2005:
Average Adjusted Gross Income (AGI) in 2004: $36,525 (Individual Income Tax Returns)
Here:
$36,525
State:
$47,881
Salary/wage: $33,043 (reported on 86.9% of returns)
Here:
$33,043
State:
$41,947
(% of AGI for various income ranges: 182.2% for AGIs below $10k, 82.7% for AGIs $10k-25k, 84.8% for AGIs $25k-50k, 83.6% for AGIs $50k-75k, 82.9% for AGIs $75k-100k, 53.4% for AGIs over 100k)
Taxable interest for individuals: $1,554 (reported on 31.1% of returns)
This zip code:
$1,554
Texas:
$2,255
(% of AGI for various income ranges: 5.8% for AGIs below $10k, 1.5% for AGIs $10k-25k, 1.1% for AGIs $25k-50k, 1.0% for AGIs $50k-75k, 0.7% for AGIs $75k-100k, 2.0% for AGIs over 100k)
Taxable dividends: $3,084 (reported on 14.6% of returns)
Here:
$3,084
State:
$4,261
(% of AGI for various income ranges: 3.3% for AGIs below $10k, 0.9% for AGIs $10k-25k, 0.7% for AGIs $25k-50k, 0.6% for AGIs $50k-75k, 0.7% for AGIs $75k-100k, 2.9% for AGIs over 100k)
Net capital gain/loss: +$6,485 (reported on 11.5% of returns)
Here:
+$6,485
State:
+$16,110
(% of AGI for various income ranges: -1.3% for AGIs below $10k, -0.1% for AGIs $10k-25k, 0.1% for AGIs $25k-50k, 0.4% for AGIs $50k-75k, 1.4% for AGIs $75k-100k, 8.1% for AGIs over 100k)
Profit/loss from business: +$7,426 (reported on 16.0% of returns)
Here:
+$7,426
State:
+$11,013
(% of AGI for various income ranges: 12.7% for AGIs below $10k, 4.1% for AGIs $10k-25k, 1.7% for AGIs $25k-50k, 1.0% for AGIs $50k-75k, 2.6% for AGIs $75k-100k, 6.8% for AGIs over 100k)
IRA payment deduction: $2,926 (reported on 1.7% of returns)
75662:
$2,926
Texas:
$3,120
(% of AGI for various income ranges: 0.1% for AGIs $10k-25k, 0.1% for AGIs $25k-50k, 0.1% for AGIs $50k-75k, 0.2% for AGIs $75k-100k, 0.1% for AGIs over 100k)
Self-employed pension: $17,593 (reported on 0.3% of returns)
Here:
$17,593
Texas:
$16,401
Total itemized deductions: $17,924 (24% of AGI, reported on 17.7% of returns)
Here:
$17,924
State:
$19,631
Here:
24.4% of AGI
State:
18.9% of AGI
(% of AGI for various income ranges: 5.4% for AGIs below $10k, 5.5% for AGIs $10k-25k, 7.1% for AGIs $25k-50k, 8.7% for AGIs $50k-75k, 10.1% for AGIs $75k-100k, 11.9% for AGIs over 100k)
Charity contributions deductions: $5,630 (7% of AGI, reported on 15.0% of returns)
Here:
$5,630
State:
$4,753
Here:
7.3% of AGI
State:
4.2% of AGI
(% of AGI for various income ranges: 0.6% for AGIs below $10k, 0.9% for AGIs $10k-25k, 1.4% for AGIs $25k-50k, 2.0% for AGIs $50k-75k, 2.9% for AGIs $75k-100k, 4.3% for AGIs over 100k)
Total tax: $5,004 (reported on 68.7% of returns)
75662:
$5,004
State:
$9,058
(% of AGI for various income ranges: 5.0% for AGIs below $10k, 3.5% for AGIs $10k-25k, 6.0% for AGIs $25k-50k, 8.3% for AGIs $50k-75k, 10.9% for AGIs $75k-100k, 17.7% for AGIs over 100k)
Earned income credit: $1,956 (reported on 22.6% of returns)
Here:
$1,956
State:
$2,024
Percentage of individuals using paid preparers for their 2004 taxes: 60.9%
Here:
61%
State:
57%
(% for various income ranges: 51.2% for AGIs below $10k, 62.2% for AGIs $10k-25k, 65.7% for AGIs $25k-50k, 62.4% for AGIs $50k-75k, 58.8% for AGIs $75k-100k, 70.2% for AGIs over 100k)
Household received Food Stamps/SNAP in the past 12 months: 1,023 Household did not receive Food Stamps/SNAP in the past 12 months: 7,869
Women who had a birth in the past 12 months: 275 (87 now married, 181 unmarried) Women who did not have a birth in the past 12 months: 4,991 (2,815 now married, 2,157 unmarried)
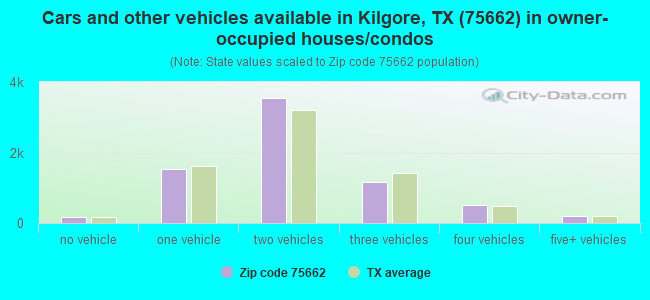
Housing units in zip code 75662 with a mortgage: 2,975 Houses without a mortgage: 30
Median monthly owner costs for units with a mortgage: $1,347 Median monthly owner costs for units without a mortgage: $466
Residents with income below the poverty level in 2022:
This zip code:
15.3%
Whole state:
14.0%
Residents with income below 50% of the poverty level in 2022:
This zip code:
9.1%
Whole state:
7.4%
Median number of rooms in houses and condos:
Here:
5.8
State:
6.3
Median number of rooms in apartments:
Here:
4.4
State:
4.0
Notable locations in this zip code not listed on our city pages
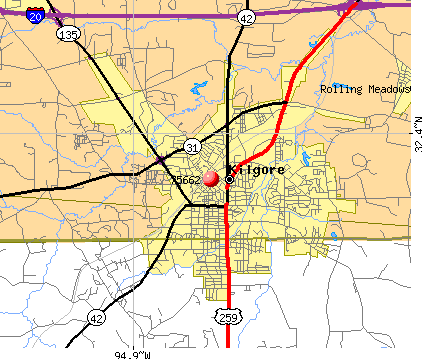
Notable locations in zip code 75662: Rangerette Showcase Museum (A), East Texas Oil Museum at Kilgore College (B), Kilgore Fire Department Station 2 (C), Kilgore Fire Department Station 3 (D), Kilgore Fire Department Central Station (E). Display/hide their locations on the map
Churches in zip code 75662 include: Post Oak Church (A), Saint John Church (B), Saint Johns Church (C), Saints Chapel Church (D), Wayside Church (E), County Line Church (F), Highland Park Baptist Church (G), Forest Home Church (H), Hickory Grove Church (I). Display/hide their locations on the map
Cemeteries: Henry Cemetery (1), Moriah Cemetery (2), Mount Comfort Cemetery (3), Mount Pleasant Cemetery (4), Choice Cemetery (5), Goodman Cemetery (6), Florey Cemetery (7). Display/hide their locations on the map
Lakes and reservoirs: Johnson Lake (A), Laguna de los Olmos (B), Martin Lake (C), Griffin Lake (D), Florey Lake (E), Elder Lake (F), Duncan Lake (G), Kilgore Lake (H). Display/hide their locations on the map
Streams, rivers, and creeks: Turkey Creek (A), Barnes Creek (B), Sandot Creek (C), Peavine Creek (D), Muley Branch (E), Hawkins Creek (F), Helton Creek (G), Law Creek (H), Cemetery Branch (I). Display/hide their locations on the map
Parks in zip code 75662 include: Saint John Memorial Stadium (1), Meadowbrook Park (2), R E Saint Johns Stadium (3). Display/hide their locations on the map
4,612 married couples with children.
1,081 single-parent households (138 men, 943 women).
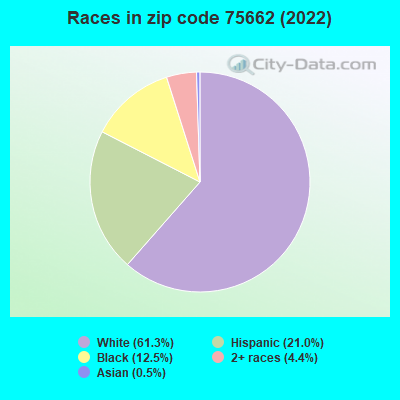
82.6% of residents of 75662 zip code speak English at home.
16.1% of residents speak Spanish at home (63% very well, 17% well, 15% not well, 5% not at all).
0.3% of residents speak other Indo-European language at home (96% very well, 4% well).
0.3% of residents speak Asian or Pacific Island language at home (54% very well, 6% well, 39% not well).
0.2% of residents speak other language at home (100% very well).
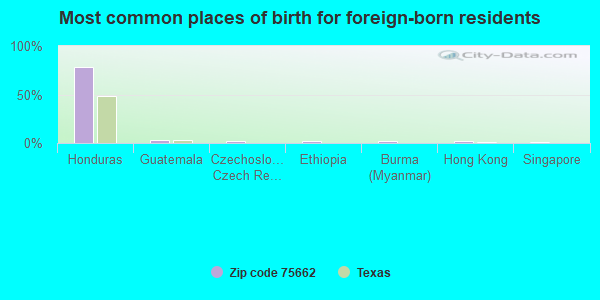
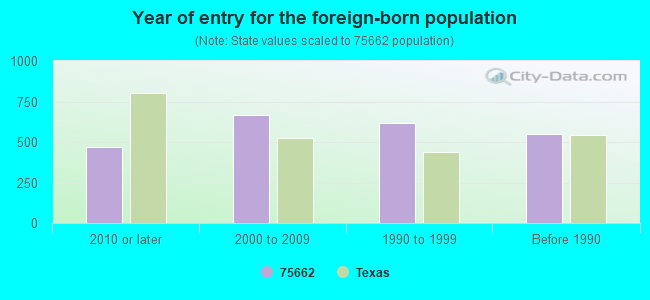
Foreign born population: 2,022 (8.0%) (35.4% of them are naturalized citizens)
This zip code:
8.0%
Whole state:
17.2%
78%Honduras
3%Guatemala
2%Czechoslovakia (includes Czech Republic and Slovakia)
2%Ethiopia
2%Burma (Myanmar)
2%Hong Kong
1%Singapore
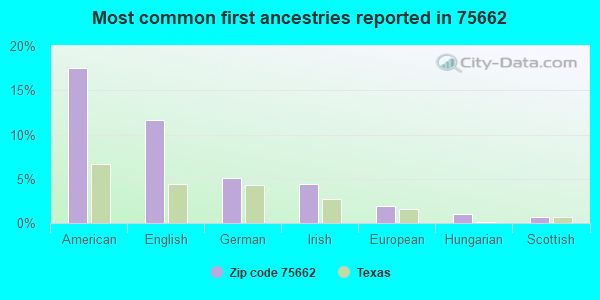
18%American
12%English
5%German
4%Irish
2%European
1%Hungarian
1%Scottish
Year of entry for the foreign-born population
4702010 or later
6652000 to 2009
6181990 to 1999
551Before 1990
Facilities with environmental interests located in this zip code:
BAKER PETROLITE CORPORATION (806 PALUXY STREET in KILGORE, TX)
CRITERIA AND HAZARDOUS AIR POLLUTANT INVENTORY (Inventory of air pollution sources) HAZARDOUS WASTE BIENNIAL REPORTER (Resource Conservation and Recovery Act (tracking hazardous waste)) Large Quantity Generators, more that 1000 kg of hazardous waste/month (Resource Conservation and Recovery Act (tracking hazardous waste)) - notification TRI REPORTER (Tracking of toxic chemicals releasing facilities) Business SIC classification: OIL AND GAS FIELD SERVICES; CHEMICALS AND ALLIED PRODUCTS Alternative names: BAKER PETROLITE KILGORE BLEND PLANT, BAKER PETROLITE KILGORE BLENDPLANT, BAKER PETROLITE KILGORE WHSE
BAKER PETROLITE KILGORE WHSE (1603 S INDUSTRIAL in KILGORE, TX)
HAZARDOUS WASTE BIENNIAL REPORTER (Resource Conservation and Recovery Act (tracking hazardous waste)) (Resource Conservation and Recovery Act (tracking hazardous waste)) TRI REPORTER (Tracking of toxic chemicals releasing facilities) Business SIC classification: CHEMICALS AND CHEMICAL PREPARATIONS Organizations: BAKER PETROLITE CORPORATION (CONTACT/OPERATOR)
Alternative names: KILGORE WAREHOUSE, PETROLITE CORP.
ARCO PIPE LINE COMPANY (SH 42 3 MILES NORTH OF in KILGORE, TX)
(Resource Conservation and Recovery Act (tracking hazardous waste)) Alternative names: KING STATION
ANA-LAB CORPORATION (2600 DUDLEY RD in KILGORE, TX)
COMPLIANCE ACTIVITY (Tracking inspections of insecticide, fungicide, and rodenticide, and toxic substances) Small Quantity Generators, between 100 kg and 1000 kg of hazardous waste/month (Resource Conservation and Recovery Act (tracking hazardous waste)) - notification Business SIC classification: TESTING LABORATORIES
ANADRILL A DIVISION OF SCHLUMBERGER TEC (3212 N HIGHWAY 135 in KILGORE, TX)
(Resource Conservation and Recovery Act (tracking hazardous waste)) Business NAICS classification: SUPPORT ACTIVITIES FOR OIL AND GAS OPERATIONS. Alternative names: ANADRILL SCHLUMBERGER-KILGORE
ASTRO AIR INC (2734 FM 1252 W in KILGORE, TX)
Conditionally Exempt Small Quantity Generators, less than 100 kg/month of hazardous waste (Resource Conservation and Recovery Act (tracking hazardous waste)) - notification Business NAICS classification: AIR-CONDITIONING AND WARM AIR HEATING EQUIPMENT AND COMMERCIAL AND INDUSTRIAL REFRIGERATION EQUIPMENT MANUFACTURING. Alternative names: SNOWMAX INC
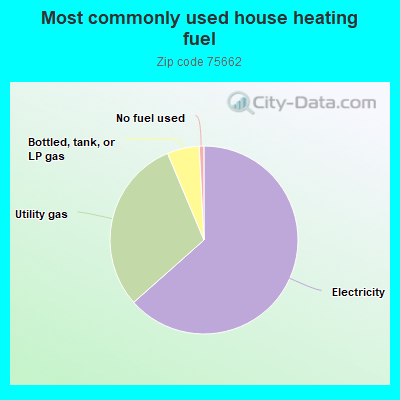
Housing units lacking complete plumbing facilities: 1.7% Housing units lacking complete kitchen facilities: 3.9%
63.2%Electricity
30.1%Utility gas
5.5%Bottled, tank, or LP gas
0.8%No fuel used
Population in 1990: 22,785.
Place of birth for U.S.-born residents:
This state: 17,526
Northeast: 423
Midwest: 1,075
South: 2,915
West: 866
56% of the 75662 zip code residents lived in the same house 5 years ago. Out of people who lived in different houses, 51% lived in this county. Out of people who lived in different counties, 50% lived in Texas.
89% of the 75662 zip code residents lived in the same house 1 year ago. Out of people who lived in different houses, 43% moved from this county. Out of people who lived in different houses, 46% moved from different county within same state. Out of people who lived in different houses, 11% moved from different state. Out of people who lived in different houses, 0% moved from abroad.
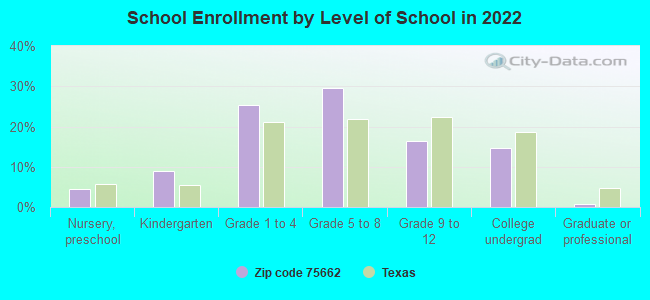
Private vs. public school enrollment:
Students in private schools in grades 1 to 8 (elementary and middle school): 289
Here:
8.8%
Texas:
8.8%
Students in private schools in grades 9 to 12 (high school): 110
Here:
11.2%
Texas:
8.0%
Students in private undergraduate colleges: 259
Here:
29.7%
Texas:
16.2%
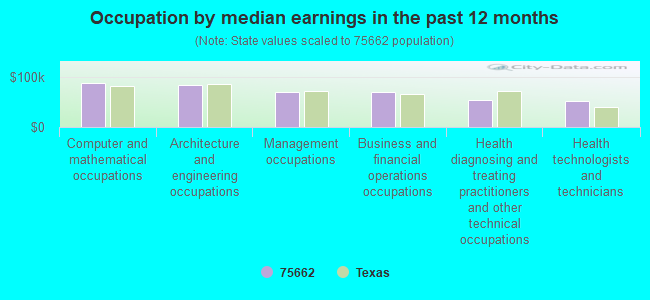
Occupation by median earnings in the past 12 months ($)
88,192Computer and mathematical occupations
84,000Architecture and engineering occupations
70,625Management occupations
69,291Business and financial operations occupations
54,267Health diagnosing and treating practitioners and other technical occupations
52,589Health technologists and technicians
Companies with federal contracts located in this zip code (KILGORE, TX):
MERRITT TOOL COMPANY, INC (703 OLD GLADEWATER HIGHWAY; small business) : $1,261,735 in 12 contractsfrom 1999 to 2006
Contracts for Aircraft Landing Gear Components, Airframe Structural Components, Miscellaneous Power Transmission Equipment by Air Force Signed by year:2000: $0; 2001: $118,175; 2002: $677,600; 2003: $111,274; 2004: $81,238; 2005: $81,238; 2006: $45,000.
Biggest contracts:
$535,500 with Air Force for Aircraft Landing Gear Components. Signed on 2002-05-21. Completion date: 2003-09-30.
$147,210 with Air Force for Airframe Structural Components. Signed on 1999-12-28. Completion date: 2001-01-31.
$101,500, same as above.Signed on 2002-02-20. Completion date: 2002-03-28.
$81,238 with Air Force for Aircraft Landing Gear Components. Signed on 2005-04-26. Completion date: 2005-09-07.
VERTEX COMMUNICATIONS CORPORAT (1104 ENERGY DR) : $281,271 in 7 contractsfrom 2000 to 2005
Contracts for Airfield, Communication and Missile Facilities, Miscellaneous Communication Equipment, Communications Security Equipment and Components, Connectors, Electrical, and moreby Army, NASA Signed by year:2000: $99,345; 2001: $0; 2002: $0; 2003: $69,225; 2004: $82,701; 2005: $30,000; 2006: $0.
Biggest contracts:
$99,345 with Army for Airfield, Communication and Missile Facilities. Taking place in AZ. Signed on 2000-06-02. Completion date: 2000-06-17.
$51,725 with Army for Miscellaneous Communication Equipment. Taking place in AZ. Signed on 2003-01-24. Completion date: 2003-04-16.
$51,000 with NASA for Communications Security Equipment and Components. Signed on 2004-08-23. Completion date: 2004-09-23.
$30,000 with Army for Connectors, Electrical. Signed on 2005-09-27. Completion date: 2005-10-11.
ANA-LAB CORPORATION (2600 DUDLEY RD; small business) : $199,884 in 24 contractsfrom 2001 to 2006
Contracts for Hazardous Substance Analysis, Water Quality Support Services, Maintenance, Repair or Alteration of Real Property -- Office Buildings, Landscaping/Groundskeeping Services by Air Force, Army, U.S. Army Corps of Engineers - civil program financing only, Bureau of Immigration and Customs Enforcement, and others Signed by year:2000: $0; 2001: $6,360; 2002: $273,000; 2003: $1,955; 2004: $288,594; 2005: -$44,363; 2006: -$325,662.
Biggest contracts:
$273,000 with Air Force for Hazardous Substance Analysis. Taking place in OK. Signed on 2004-12-17. Completion date: 2005-09-30.
$273,000, same as above.Signed on 2002-12-12. Completion date: 2003-09-30.
$273,000 with Air Force for Hazardous Substance Analysis. Signed on 2005-11-21. Completion date: 2006-09-30.
$15,594 with Army for Water Quality Support Services. Signed on 2004-01-15. Completion date: 2003-09-30.
MA-TEX WIRE ROPE CO INC (1215 INDUSTRIAL BLVD; small business) : $49,115 in 2 contractsfrom 2002 to 2006
$31,896 with U.S. Army Corps of Engineers - civil program financing only for Miscellaneous Ship and Marine Equipment. Signed on 2002-05-30. Completion date: 2002-09-30.
$17,219 with Defense Logistics Agency for Chain and Wire Rope. Signed on 2006-01-27. Completion date: 2006-04-26.
STEELMAN INDUSTRIES INC (2800 STATE HIGHWAY 135 N; small business) : $37,159 in 2 contractsin 2004
$36,759 with Navy for Industrial Furnaces, Kilns, Lehrs, and Ovens. Signed on 2004-09-30. Completion date: 2004-11-26.
$400, same as above.Signed on 2004-12-30. Completion date: 2004-11-26.
LOYD BROILES SR (506 WESTWOOD ST; small business) : $28,630 in 5 contractsfrom 2005 to 2006
Contracts for Operation of Government-Owned Facilities -- Recreation Facilities (Non-Building), Operation of Government-Owned Facilities -- Other Conservation and Development Facilities by U.S. Army Corps of Engineers - civil program financing only, Army Signed by year:2000: $0; 2001: $0; 2002: $0; 2003: $0; 2004: $0; 2005: $21,000; 2006: $7,630.
Biggest contracts:
$10,640 with U.S. Army Corps of Engineers - civil program financing only for Operation of Government-Owned Facilities -- Recreation Facilities (Non-Building). Taking place in AR. Signed on 2005-03-28. Completion date: 2005-09-30.
$10,640 with Army for Operation of Government-Owned Facilities -- Recreation Facilities (Non-Building). Taking place in AR. Signed on 2005-03-28. Completion date: 2005-09-30.
$7,630 with Army for Operation of Government-Owned Facilities -- Other Conservation and Development Facilities. Taking place in AR. Signed on 2006-02-09. Completion date: 2006-09-05.
-$140 with Army for Operation of Government-Owned Facilities -- Recreation Facilities (Non-Building). Taking place in AR. Signed on 2005-09-16. Completion date: 2005-09-30.
Top industries in this zip code by the number of employees in 2005:
Mining: Support Activities for Oil and Gas Operations (250-499 employees: 1 establishment, 100-249 employees: 2 establishments, 20-49 employees: 2 establishments, 10-19 employees: 6 establishments, 5-9 employees: 3 establishments, 1-4 employees: 11 establishments)
Real Estate and Rental and Leasing: Construction, Mining, and Forestry Machinery and Equipment Rental and Leasing (50-99: 2, 20-49: 4, 10-19: 1, 5-9: 2, 1-4: 3)
Health Care and Social Assistance: Nursing Care Facilities (100-249: 1, 50-99: 1, 5-9: 1)
Other Services (except Public Administration): Religious Organizations (20-49: 4, 10-19: 1, 5-9: 3, 1-4: 11)
People in group quarters in 2010:
415 people in college/university student housing
202 people in nursing facilities/skilled-nursing facilities
39 people in local jails and other municipal confinement facilities
23 people in group homes intended for adults
6 people in other noninstitutional facilities
4 people in residential treatment centers for adults
People in group quarters in 2000:
297 people in college dormitories (includes college quarters off campus)
98 people in nursing homes
13 people in other nonhousehold living situations
12 people in homes for the mentally retarded
10 people in training schools for juvenile delinquents
9 people in unknown juvenile institutions
8 people in religious group quarters
6 people in homes for the mentally ill
5 people in other noninstitutional group quarters
4 people in homes for abused, dependent, and neglected children
Fatal accident statistics in 2014:
Fatal accident count: 14
Vehicles involved in fatal accidents: 24
Fatal accidents caused by drunken drivers: 7
Fatalities: 16
Persons involved in fatal accidents: 40
Pedestrians involved in fatal accidents: 0
Fatal accident statistics in 2013:
Fatal accident count: 9
Vehicles involved in fatal accidents: 13
Fatal accidents caused by drunken drivers: 2
Fatalities: 10
Persons involved in fatal accidents: 18
Pedestrians involved in fatal accidents: 3
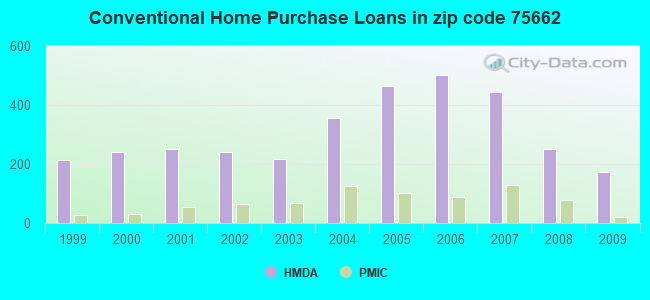
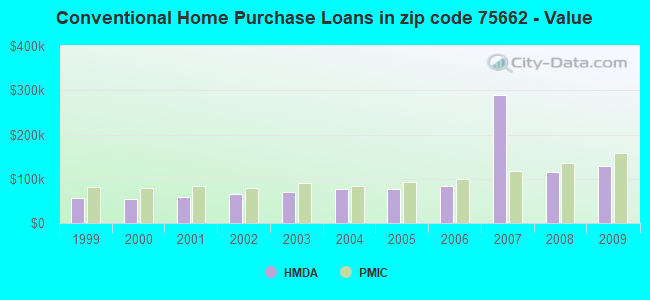
Home Mortgage Disclosure Act Aggregated Statistics For Year 2009 (Based on 2 full and 8 partial tracts)
A) FHA, FSA/RHS & VA Home Purchase Loans
B) Conventional Home Purchase Loans
C) Refinancings
D) Home Improvement Loans
E) Loans on Dwellings For 5+ Families
F) Non-occupant Loans on < 5 Family Dwellings (A B C & D)
G) Loans On Manufactured Home Dwelling (A B C & D)
Number
Average Value
Number
Average Value
Number
Average Value
Number
Average Value
Number
Average Value
Number
Average Value
Number
Average Value
LOANS ORIGINATED
166
$124,058
172
$129,866
292
$109,890
103
$33,584
1
$65,000
64
$77,556
52
$59,371
APPLICATIONS APPROVED, NOT ACCEPTED
7
$115,720
16
$113,313
32
$97,487
7
$40,763
0
$0
1
$84,530
8
$39,389
APPLICATIONS DENIED
34
$111,702
72
$72,338
106
$110,307
50
$25,138
0
$0
8
$41,631
41
$54,464
APPLICATIONS WITHDRAWN
13
$104,024
28
$133,616
52
$116,888
4
$51,105
0
$0
3
$57,043
3
$102,637
FILES CLOSED FOR INCOMPLETENESS
2
$99,500
4
$116,720
15
$133,872
3
$19,447
0
$0
2
$120,090
1
$69,290
Aggregated Statistics For Year 2008 (Based on 2 full and 8 partial tracts)
A) FHA, FSA/RHS & VA Home Purchase Loans
B) Conventional Home Purchase Loans
C) Refinancings
D) Home Improvement Loans
E) Loans on Dwellings For 5+ Families
F) Non-occupant Loans on < 5 Family Dwellings (A B C & D)
G) Loans On Manufactured Home Dwelling (A B C & D)
Number
Average Value
Number
Average Value
Number
Average Value
Number
Average Value
Number
Average Value
Number
Average Value
Number
Average Value
LOANS ORIGINATED
168
$113,099
250
$115,912
207
$99,030
105
$38,208
3
$328,240
71
$83,460
36
$64,283
APPLICATIONS APPROVED, NOT ACCEPTED
10
$71,271
25
$88,293
33
$84,438
18
$53,840
0
$0
2
$96,070
19
$49,195
APPLICATIONS DENIED
26
$113,339
100
$80,320
151
$102,998
94
$35,301
0
$0
17
$51,389
56
$52,411
APPLICATIONS WITHDRAWN
10
$122,423
28
$106,659
61
$110,528
14
$71,192
0
$0
12
$141,341
3
$16,870
FILES CLOSED FOR INCOMPLETENESS
7
$115,107
12
$101,845
9
$159,327
0
$0
0
$0
1
$134,290
0
$0
Aggregated Statistics For Year 2007 (Based on 2 full and 8 partial tracts)
A) FHA, FSA/RHS & VA Home Purchase Loans
B) Conventional Home Purchase Loans
C) Refinancings
D) Home Improvement Loans
E) Loans on Dwellings For 5+ Families
F) Non-occupant Loans on < 5 Family Dwellings (A B C & D)
G) Loans On Manufactured Home Dwelling (A B C & D)
Number
Average Value
Number
Average Value
Number
Average Value
Number
Average Value
Number
Average Value
Number
Average Value
Number
Average Value
LOANS ORIGINATED
101
$112,049
443
$289,220
204
$97,677
114
$34,752
2
$1,007,500
77
$75,223
69
$49,952
APPLICATIONS APPROVED, NOT ACCEPTED
12
$107,522
66
$72,125
27
$81,261
25
$37,250
0
$0
10
$74,148
42
$50,056
APPLICATIONS DENIED
31
$113,451
175
$74,013
208
$86,889
134
$33,369
1
$2,000
40
$54,346
87
$48,547
APPLICATIONS WITHDRAWN
12
$143,678
61
$111,937
124
$94,036
17
$38,271
0
$0
6
$51,287
4
$78,445
FILES CLOSED FOR INCOMPLETENESS
3
$122,043
23
$111,973
26
$111,872
1
$18,000
0
$0
4
$88,345
1
$122,140
Aggregated Statistics For Year 2006 (Based on 2 full and 8 partial tracts)
A) FHA, FSA/RHS & VA Home Purchase Loans
B) Conventional Home Purchase Loans
C) Refinancings
D) Home Improvement Loans
E) Loans on Dwellings For 5+ Families
F) Non-occupant Loans on < 5 Family Dwellings (A B C & D)
G) Loans On Manufactured Home Dwelling (A B C & D)
Number
Average Value
Number
Average Value
Number
Average Value
Number
Average Value
Number
Average Value
Number
Average Value
Number
Average Value
LOANS ORIGINATED
78
$94,098
502
$83,870
234
$90,099
97
$37,998
1
$250,000
82
$76,336
71
$64,731
APPLICATIONS APPROVED, NOT ACCEPTED
3
$88,493
90
$65,427
37
$81,142
17
$32,679
0
$0
6
$43,742
44
$46,727
APPLICATIONS DENIED
14
$76,825
208
$69,943
197
$77,593
86
$27,729
1
$510,000
13
$67,495
116
$47,488
APPLICATIONS WITHDRAWN
8
$99,091
66
$94,506
180
$89,422
15
$44,436
0
$0
15
$73,999
4
$75,758
FILES CLOSED FOR INCOMPLETENESS
2
$66,000
20
$72,689
35
$95,448
1
$48,000
0
$0
2
$19,215
0
$0
Aggregated Statistics For Year 2005 (Based on 2 full and 8 partial tracts)
A) FHA, FSA/RHS & VA Home Purchase Loans
B) Conventional Home Purchase Loans
C) Refinancings
D) Home Improvement Loans
E) Loans on Dwellings For 5+ Families
F) Non-occupant Loans on < 5 Family Dwellings (A B C & D)
G) Loans On Manufactured Home Dwelling (A B C & D)
Number
Average Value
Number
Average Value
Number
Average Value
Number
Average Value
Number
Average Value
Number
Average Value
Number
Average Value
LOANS ORIGINATED
56
$89,880
465
$76,706
296
$91,739
108
$42,836
5
$880,400
94
$58,746
71
$51,034
APPLICATIONS APPROVED, NOT ACCEPTED
5
$54,896
86
$63,771
58
$67,608
16
$30,743
0
$0
3
$40,087
58
$47,346
APPLICATIONS DENIED
13
$83,161
202
$73,041
292
$72,930
67
$34,672
0
$0
27
$108,520
114
$50,527
APPLICATIONS WITHDRAWN
5
$99,754
58
$87,245
182
$115,054
34
$106,105
0
$0
12
$91,711
7
$58,296
FILES CLOSED FOR INCOMPLETENESS
3
$101,323
27
$73,315
65
$90,150
0
$0
0
$0
0
$0
2
$114,985
Aggregated Statistics For Year 2004 (Based on 2 full and 8 partial tracts)
A) FHA, FSA/RHS & VA Home Purchase Loans
B) Conventional Home Purchase Loans
C) Refinancings
D) Home Improvement Loans
E) Loans on Dwellings For 5+ Families
F) Non-occupant Loans on < 5 Family Dwellings (A B C & D)
G) Loans On Manufactured Home Dwelling (A B C & D)
Number
Average Value
Number
Average Value
Number
Average Value
Number
Average Value
Number
Average Value
Number
Average Value
Number
Average Value
LOANS ORIGINATED
71
$87,391
356
$76,326
363
$72,402
102
$37,041
1
$1,500,000
72
$59,883
65
$51,213
APPLICATIONS APPROVED, NOT ACCEPTED
3
$59,860
80
$83,588
52
$67,567
15
$36,957
0
$0
3
$67,717
38
$50,491
APPLICATIONS DENIED
15
$83,377
156
$73,735
306
$70,121
63
$32,462
0
$0
19
$56,562
102
$45,761
APPLICATIONS WITHDRAWN
10
$81,489
45
$75,360
203
$85,143
10
$56,954
0
$0
6
$60,047
7
$68,089
FILES CLOSED FOR INCOMPLETENESS
2
$14,585
17
$75,785
57
$81,405
3
$42,327
0
$0
1
$49,000
3
$23,230
Aggregated Statistics For Year 2003 (Based on 2 full and 4 partial tracts)
A) FHA, FSA/RHS & VA Home Purchase Loans
B) Conventional Home Purchase Loans
C) Refinancings
D) Home Improvement Loans
E) Loans on Dwellings For 5+ Families
F) Non-occupant Loans on < 5 Family Dwellings (A B C & D)
Number
Average Value
Number
Average Value
Number
Average Value
Number
Average Value
Number
Average Value
Number
Average Value
LOANS ORIGINATED
37
$79,101
218
$69,350
337
$83,409
60
$31,701
2
$1,361,500
49
$43,033
APPLICATIONS APPROVED, NOT ACCEPTED
2
$47,000
33
$62,133
60
$72,721
9
$27,714
0
$0
11
$87,452
APPLICATIONS DENIED
7
$60,506
148
$63,302
194
$69,839
34
$21,837
0
$0
8
$42,301
APPLICATIONS WITHDRAWN
5
$80,848
32
$82,449
123
$77,288
4
$49,062
0
$0
2
$44,760
FILES CLOSED FOR INCOMPLETENESS
0
$0
13
$69,434
11
$47,636
3
$14,770
0
$0
1
$40,000
Aggregated Statistics For Year 2002 (Based on 2 full and 4 partial tracts)
A) FHA, FSA/RHS & VA Home Purchase Loans
B) Conventional Home Purchase Loans
C) Refinancings
D) Home Improvement Loans
F) Non-occupant Loans on < 5 Family Dwellings (A B C & D)
Number
Average Value
Number
Average Value
Number
Average Value
Number
Average Value
Number
Average Value
LOANS ORIGINATED
35
$78,234
239
$64,442
229
$70,747
52
$20,108
46
$56,007
APPLICATIONS APPROVED, NOT ACCEPTED
2
$68,875
44
$50,909
37
$56,491
5
$19,138
1
$81,050
APPLICATIONS DENIED
10
$46,998
151
$47,332
116
$58,496
33
$15,559
12
$57,872
APPLICATIONS WITHDRAWN
9
$92,749
25
$60,825
106
$69,535
6
$11,155
4
$60,862
FILES CLOSED FOR INCOMPLETENESS
1
$122,000
6
$165,885
20
$96,163
0
$0
1
$52,000
Aggregated Statistics For Year 2001 (Based on 2 full and 4 partial tracts)
A) FHA, FSA/RHS & VA Home Purchase Loans
B) Conventional Home Purchase Loans
C) Refinancings
D) Home Improvement Loans
E) Loans on Dwellings For 5+ Families
F) Non-occupant Loans on < 5 Family Dwellings (A B C & D)
Number
Average Value
Number
Average Value
Number
Average Value
Number
Average Value
Number
Average Value
Number
Average Value
LOANS ORIGINATED
44
$73,852
250
$58,721
166
$63,987
51
$19,350
1
$90,000
32
$32,288
APPLICATIONS APPROVED, NOT ACCEPTED
2
$38,500
82
$47,913
34
$49,909
9
$27,553
0
$0
1
$44,000
APPLICATIONS DENIED
10
$89,189
187
$43,593
108
$51,753
39
$11,607
0
$0
10
$37,933
APPLICATIONS WITHDRAWN
1
$95,370
26
$78,835
88
$86,951
0
$0
0
$0
1
$40,000
FILES CLOSED FOR INCOMPLETENESS
0
$0
2
$57,265
16
$55,886
1
$58,030
0
$0
0
$0
Aggregated Statistics For Year 2000 (Based on 2 full and 4 partial tracts)
A) FHA, FSA/RHS & VA Home Purchase Loans
B) Conventional Home Purchase Loans
C) Refinancings
D) Home Improvement Loans
E) Loans on Dwellings For 5+ Families
F) Non-occupant Loans on < 5 Family Dwellings (A B C & D)
Number
Average Value
Number
Average Value
Number
Average Value
Number
Average Value
Number
Average Value
Number
Average Value
LOANS ORIGINATED
45
$60,416
241
$54,776
95
$52,279
45
$17,046
2
$150,715
33
$40,780
APPLICATIONS APPROVED, NOT ACCEPTED
19
$40,098
53
$48,092
19
$49,632
12
$19,106
0
$0
4
$41,628
APPLICATIONS DENIED
13
$55,445
282
$38,630
46
$39,512
39
$11,911
0
$0
13
$34,060
APPLICATIONS WITHDRAWN
11
$66,606
25
$58,806
43
$53,557
1
$5,340
0
$0
0
$0
FILES CLOSED FOR INCOMPLETENESS
1
$55,000
8
$47,419
8
$65,086
0
$0
0
$0
0
$0
Aggregated Statistics For Year 1999 (Based on 2 full and 3 partial tracts)
A) FHA, FSA/RHS & VA Home Purchase Loans
B) Conventional Home Purchase Loans
C) Refinancings
D) Home Improvement Loans
F) Non-occupant Loans on < 5 Family Dwellings (A B C & D)
2002 - 2018 National Fire Incident Reporting System (NFIRS) incidents
Based on the data from the years 2002 - 2018 the average number of fires per year is 151. The highest number of reported fires - 368 took place in 2011, and the least - 31 in 2002. The data has an increasing trend.
When looking into fire subcategories, the most incidents belonged to: Outside Fires (56.2%), and Structure Fires (27.2%).
Fire incident types reported to NFIRS in Zip Code 75662

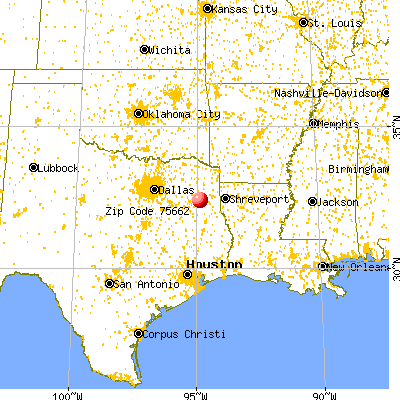


 Nearest zip codes: 75684, 75604, 75693, 75682, 75647, 75603.


 Based on the data from the years 2002 - 2018 the average number of fires per year is 151. The highest number of reported fires - 368 took place in 2011, and the least - 31 in 2002. The data has an increasing trend.
 When looking into fire subcategories, the most incidents belonged to: Outside Fires (56.2%), and Structure Fires (27.2%).