Wyoming, MI (Michigan) Houses and Residents
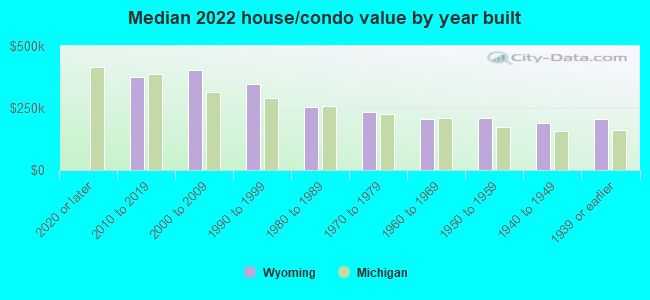
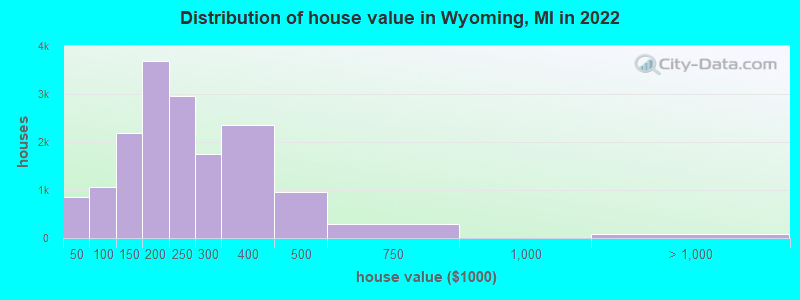
Estimated median house or condo value in 2022: $227,900 (it was $91,700 in 2000 )
Wyoming:
$227,900Michigan:
$224,400
Lower value quartile - upper value quartile: $176,600 - $298,900Mean price in 2022: Detached houses: $196,283 Here:
$196,283State:
$280,038
Townhouses or other attached units: $232,962 Here:
$232,962State:
$239,520
In 2-unit structures: $188,712 Here:
$188,712State:
$219,481
In 3-to-4-unit structures: $86,562 Here:
$86,562State:
$207,067
In 5-or-more-unit structures: $170,495 Here:
$170,495State:
$192,733
Mobile homes: $46,709 Here:
$46,709State:
$72,868
Total population: 74,826 (Urban population: 68,841, Rural population: 525 (all nonfarm) )
Houses: 29,580 (27,286 occupied: 18,457 owner occupied, 8,829 renter occupied )
% of renters here:
32%State:
27%
Housing density: 1,211 houses/condos per square mile
Median price asked for vacant for-sale houses and condos in 2022: $81,629.
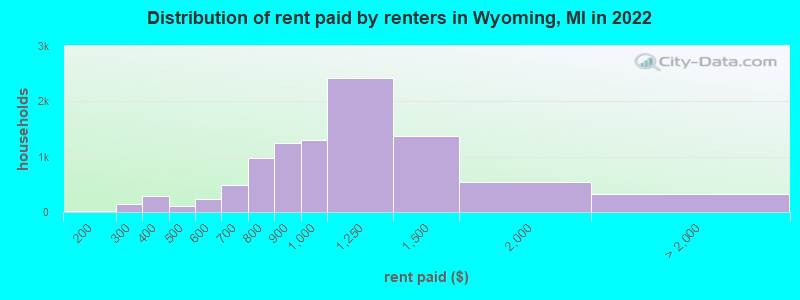
Median contract rent in 2022: $941 (lower quartile is $765, upper quartile is $1,239)
Median rent asked for vacant for-rent units in 2022: $2,158
Median gross rent in Wyoming, MI in 2022: $1,121
Housing units in Wyoming with a mortgage: 12,629 (1,351 second mortgage, 0 home equity loan, 1,282 both second mortgage and home equity loan )Houses without a mortgage: 85
Median household income for houses/condos with a mortgage: $94,813
Median household income for apartments without a mortgage: $63,175
Median monthly housing costs: $1,033
Data:
Median house or condo value ($)
Median house or condo value ($ change since 2000)
Median house or condo value ($) - White
Median house or condo value ($) - Black or African American
Median house or condo value ($) - Asian
Median house or condo value ($) - Hispanic or Latino
Median house or condo value ($) - American Indian and Alaska Native
Median house or condo value ($) - Multirace
Median house or condo value ($) - Other Race
Median price asked for mobile homes ($)
Household density (households per square mile)
Mean house or condo value by units in structure - 1, detached ($)
Mean house or condo value by units in structure - 1, attached ($)
Mean house or condo value by units in structure - 2 ($)
Mean house or condo value by units in structure by units in structure - 3 or 4 ($)
Mean house or condo value by units in structure - 5 or more ($)
Mean house or condo value by units in structure - Boat, RV, van, etc. ($)
Mean house or condo value by units in structure - Mobile home ($)
Median contract rent ($)
Median contract rent - Lower quartile ($)
Median contract rent - Upper quartile ($)
Median gross rent ($)
Urban houses (%)
Rural houses (%)
Houses occupied (%)
Houses occupied (% change since 2000)
Houses owner occupied (%)
Houses owner occupied (% change since 2000)
Houses renter occupied (%)
Houses renter occupied (% change since 2000)
Vacant housing units - For rent (%)
Vacant housing units - For rent (% change since 2000)
Vacant housing units - For sale only (%)
Vacant housing units - For sale only (% change since 2000)
Vacant housing units - Rented or sold, not occupied (%)
Vacant housing units - Rented or sold, not occupied (% change since 2000)
Vacant housing units - For seasonal, recreational, or occasional use (%)
Vacant housing units - For seasonal, recreational, or occasional use (% change since 2000)
Vacant housing units - For migrant workers (%)
Vacant housing units - For migrant workers (% change since 2000)
Vacant housing units - Other vacant (%)
Vacant housing units - Other vacant (% change since 2000)
Median monthly housing costs ($)
Median household income for houses/condos with a mortgage ($)
Median household income for houses/condos without a mortgage ($)
Median household income ($)
Median household income ($) - White
Median household income ($) - Black or African American
Median household income ($) - Asian
Median household income ($) - Hispanic or Latino
Median household income ($) - American Indian and Alaska Native
Median household income ($) - Multirace
Median household income ($) - Other Race
Mortgage status - with mortgage (%)
Mortgage status - with second mortgage (%)
Mortgage status - with home equity loan (%)
Mortgage status - with both second mortgage and home equity loan (%)
Mortgage status - without a mortgage (%)
Median year house/condo built
Median year apartment built
Household type by relationship - Male householder living alone (%)
Household type by relationship - Male householder not living alone (%)
Household type by relationship - Female householder living alone (%)
Household type by relationship - Female householder not living alone (%)
Household type by relationship - Opposite-Sex spouse (%)
Household type by relationship - Same-Sex spouse (%)
Household type by relationship - Opposite-Sex unmarried partner (%)
Household type by relationship - Same-Sex unmarried partner (%)
Household type by relationship - In group quarters (%)
Size of family households - 2-person household (%)
Size of family households - 3-person household (%)
Size of family households - 4-person household (%)
Size of family households - 5-person household (%)
Size of family households - 6-person household (%)
Size of family households - 7-or-more-person household (%)
Size of nonfamily households - 1-person household (%)
Size of nonfamily households - 2-person household (%)
Size of nonfamily households - 3-person household (%)
Size of nonfamily households - 4-person household (%)
Size of nonfamily households - 5-person household (%)
Size of nonfamily households - 6-person household (%)
Size of nonfamily households - 7-or-moreperson household (%)
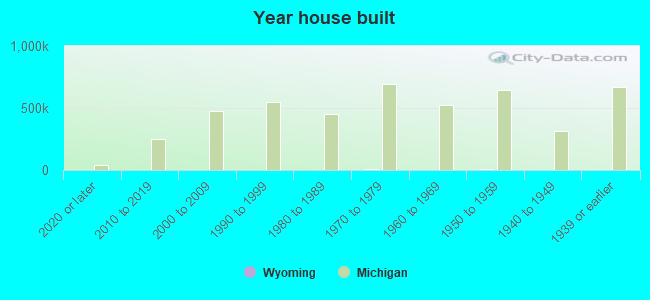
Year house built - Built 2010 or later (%)
Year house built - Built 2000 to 2009 (%)
Year house built - Built 1990 to 1999 (%)
Year house built - Built 1980 to 1989 (%)
Year house built - Built 1970 to 1979 (%)
Year house built - Built 1960 to 1969 (%)
Year house built - Built 1950 to 1959 (%)
Year house built - Built 1940 to 1949 (%)
Year house built - Built 1939 or earlier (%)
Median number of rooms in houses and condos
Median number of rooms in apartments
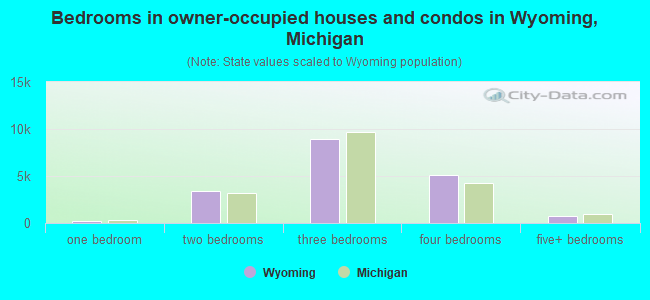
Median number of bedrooms in owner occupied houses
Mean number of bedrooms in owner occupied houses
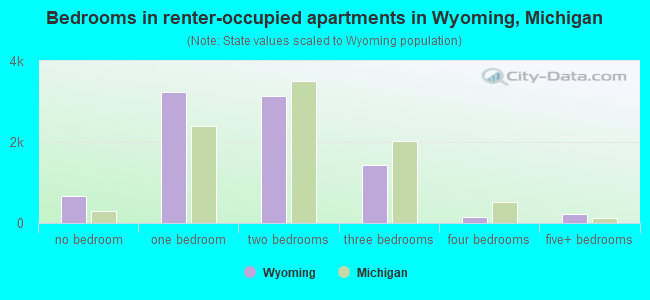
Median number of bedrooms in renter occupied houses
Mean number of bedrooms in renter occupied houses
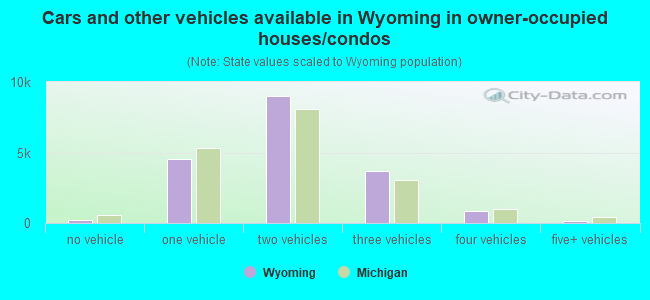
Median number of vehichles in owner occupied houses
Mean number of vehichles in owner occupied houses
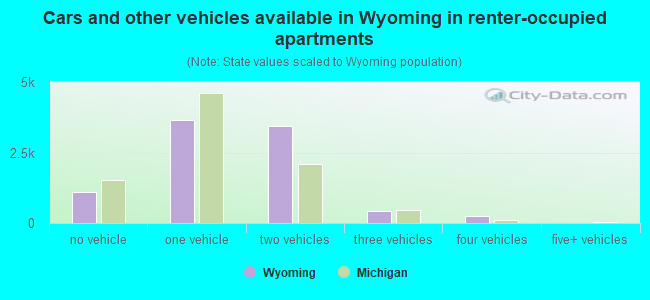
Median number of vehichles in renter occupied houses
Mean number of vehichles in renter occupied houses
Rooms in owner-occupied houses - 1 room (%)
Rooms in owner-occupied houses - 2 rooms (%)
Rooms in owner-occupied houses - 3 rooms (%)
Rooms in owner-occupied houses - 4 rooms (%)
Rooms in owner-occupied houses - 5 rooms (%)
Rooms in owner-occupied houses - 6 rooms (%)
Rooms in owner-occupied houses - 7 rooms (%)
Rooms in owner-occupied houses - 8 rooms (%)
Rooms in owner-occupied houses - 9+ rooms (%)
Rooms in renter-occupied houses - 1 room (%)
Rooms in renter-occupied houses - 2 rooms (%)
Rooms in renter-occupied houses - 3 rooms (%)
Rooms in renter-occupied houses - 4 rooms (%)
Rooms in renter-occupied houses - 5 rooms (%)
Rooms in renter-occupied houses - 6 rooms (%)
Rooms in renter-occupied houses - 7 rooms (%)
Rooms in renter-occupied houses - 8 rooms (%)
Rooms in renter-occupied houses - 9+ rooms (%)
Bedrooms in owner-occupied houses - no bedrooms (%)
Bedrooms in owner-occupied houses - 1 bedroom (%)
Bedrooms in owner-occupied houses - 2 bedrooms (%)
Bedrooms in owner-occupied houses - 3 bedrooms (%)
Bedrooms in owner-occupied houses - 4 bedrooms (%)
Bedrooms in owner-occupied houses - 5+ bedrooms (%)
Bedrooms in renter-occupied houses - no bedrooms (%)
Bedrooms in renter-occupied houses - 1 bedroom (%)
Bedrooms in renter-occupied houses - 2 bedrooms (%)
Bedrooms in renter-occupied houses - 3 bedrooms (%)
Bedrooms in renter-occupied houses - 4 bedrooms (%)
Bedrooms in renter-occupied houses - 5+ bedrooms (%)
Vehicles available in owner-occupied houses - no vehicle available (%)
Vehicles available in owner-occupied houses - 1 vehicle available(%)
Vehicles available in owner-occupied houses - 2 Vehicles available (%)
Vehicles available in owner-occupied houses - 3 Vehicles available (%)
Vehicles available in owner-occupied houses - 4 Vehicles available (%)
Vehicles available in owner-occupied houses - 5+ Vehicles available (%)
Vehicles available in renter-occupied houses - no vehicle available (%)
Vehicles available in renter-occupied houses - 1 vehicle available (%)
Vehicles available in renter-occupied houses - 2 Vehicles available (%)
Vehicles available in renter-occupied houses - 3 Vehicles available (%)
Vehicles available in renter-occupied houses - 4 Vehicles available (%)
Vehicles available in renter-occupied houses - 5+ Vehicles available (%)
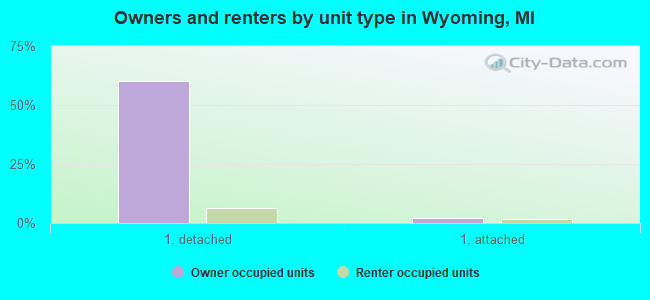
Housing units in structures - 1, detached (%)
Housing units in structures - 1, attached (%)
Housing units in structures - 2 (%)
Housing units in structures - 3 or 4 (%)
Housing units in structures - 5 to 9 (%)
Housing units in structures - 10 to 19 (%)
Housing units in structures - 20 to 49 (%)
Housing units in structures - 50 or more (%)
Housing units in structures - Mobile home (%)
Housing units in structures - Boat, RV, van, etc. (%)
Housing units in structures - Owners - 1, detached (%)
Housing units in structures - Owners - 1, attached (%)
Housing units in structures - Owners - 2 (%)
Housing units in structures - Owners - 3 or 4 (%)
Housing units in structures - Owners - 5 to 9 (%)
Housing units in structures - Owners - 10 to 19 (%)
Housing units in structures - Owners - 20 to 49 (%)
Housing units in structures - Owners - 50 or more (%)
Housing units in structures - Owners - Mobile home (%)
Housing units in structures - Owners - Boat, RV, van, etc. (%)
Housing units in structures - Renters - 1, detached (%)
Housing units in structures - Renters - 1, attached (%)
Housing units in structures - Renters - 2 (%)
Housing units in structures - Renters - 3 or 4 (%)
Housing units in structures - Renters - 5 to 9 (%)
Housing units in structures - Renters - 10 to 19 (%)
Housing units in structures - Renters - 20 to 49 (%)
Housing units in structures - Renters - 50 or more (%)
Housing units in structures - Renters - Mobile home (%)
Housing units in structures - Renters - Boat, RV, van, etc. (%)
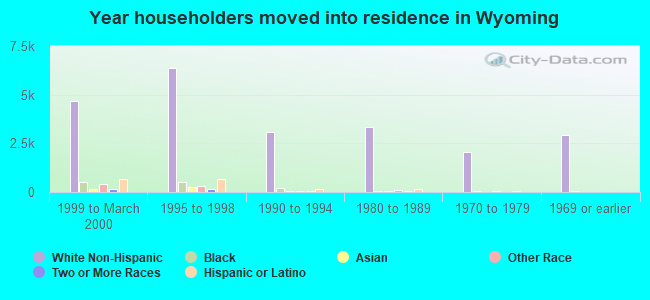
House/condo owner moved in on average (years ago)
Renter moved in on average (years ago)
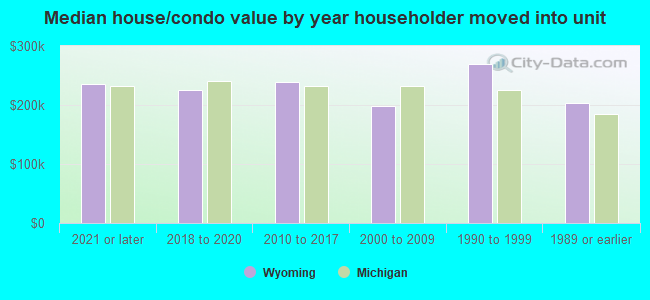
Year householder moved into unit - Moved in 1999 to March 2000 (%)
Year householder moved into unit - Moved in 1999 to March 2000 (%) - White
Year householder moved into unit - Moved in 1999 to March 2000 (%) - Black or African American
Year householder moved into unit - Moved in 1999 to March 2000 (%) - Asian
Year householder moved into unit - Moved in 1999 to March 2000 (%) - Hispanic or Latino
Year householder moved into unit - Moved in 1999 to March 2000 (%) - American Indian and Alaska Native
Year householder moved into unit - Moved in 1999 to March 2000 (%) - Multirace
Year householder moved into unit - Moved in 1999 to March 2000 (%) - Other Race
Year householder moved into unit - Moved in 1995 to 1998 (%)
Year householder moved into unit - Moved in 1995 to 1998 (%) - White
Year householder moved into unit - Moved in 1995 to 1998 (%) - Black or African American
Year householder moved into unit - Moved in 1995 to 1998 (%) - Asian
Year householder moved into unit - Moved in 1995 to 1998 (%) - Hispanic or Latino
Year householder moved into unit - Moved in 1995 to 1998 (%) - American Indian and Alaska Native
Year householder moved into unit - Moved in 1995 to 1998 (%) - Multirace
Year householder moved into unit - Moved in 1995 to 1998 (%) - Other Race
Year householder moved into unit - Moved in 1990 to 1994 (%)
Year householder moved into unit - Moved in 1990 to 1994 (%) - White
Year householder moved into unit - Moved in 1990 to 1994 (%) - Black or African American
Year householder moved into unit - Moved in 1990 to 1994 (%) - Asian
Year householder moved into unit - Moved in 1990 to 1994 (%) - Hispanic or Latino
Year householder moved into unit - Moved in 1990 to 1994 (%) - American Indian and Alaska Native
Year householder moved into unit - Moved in 1990 to 1994 (%) - Multirace
Year householder moved into unit - Moved in 1990 to 1994 (%) - Other Race
Year householder moved into unit - Moved in 1980 to 1989 (%)
Year householder moved into unit - Moved in 1980 to 1989 (%) - White
Year householder moved into unit - Moved in 1980 to 1989 (%) - Black or African American
Year householder moved into unit - Moved in 1980 to 1989 (%) - Asian
Year householder moved into unit - Moved in 1980 to 1989 (%) - Hispanic or Latino
Year householder moved into unit - Moved in 1980 to 1989 (%) - American Indian and Alaska Native
Year householder moved into unit - Moved in 1980 to 1989 (%) - Multirace
Year householder moved into unit - Moved in 1980 to 1989 (%) - Other Race
Year householder moved into unit - Moved in 1970 to 1979 (%)
Year householder moved into unit - Moved in 1970 to 1979 (%) - White
Year householder moved into unit - Moved in 1970 to 1979 (%) - Black or African American
Year householder moved into unit - Moved in 1970 to 1979 (%) - Asian
Year householder moved into unit - Moved in 1970 to 1979 (%) - Hispanic or Latino
Year householder moved into unit - Moved in 1970 to 1979 (%) - American Indian and Alaska Native
Year householder moved into unit - Moved in 1970 to 1979 (%) - Multirace
Year householder moved into unit - Moved in 1970 to 1979 (%) - Other Race
Year householder moved into unit - Moved in 1969 or earlier (%)
Year householder moved into unit - Moved in 1969 or earlier (%) - White
Year householder moved into unit - Moved in 1969 or earlier (%) - Black or African American
Year householder moved into unit - Moved in 1969 or earlier (%) - Asian
Year householder moved into unit - Moved in 1969 or earlier (%) - Hispanic or Latino
Year householder moved into unit - Moved in 1969 or earlier (%) - American Indian and Alaska Native
Year householder moved into unit - Moved in 1969 or earlier (%) - Multirace
Year householder moved into unit - Moved in 1969 or earlier (%) - Other Race
Housing units lacking complete plumbing facilities (%)
Housing units lacking complete kitchen facilities (%)
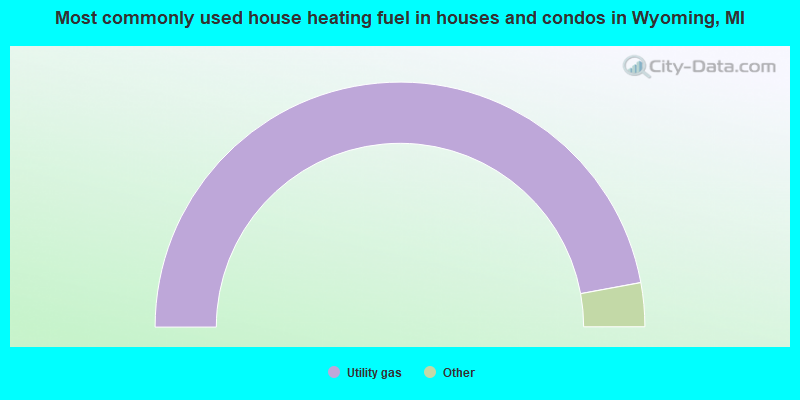
House heating fuel used in houses and condos - Utility gas (%)
House heating fuel used in houses and condos - Bottled, tank, or LP gas (%)
House heating fuel used in houses and condos - Electricity (%)
House heating fuel used in houses and condos - Fuel oil, kerosene, etc. (%)
House heating fuel used in houses and condos - Coal or coke (%)
House heating fuel used in houses and condos - Wood (%)
House heating fuel used in houses and condos - Solar energy (%)
House heating fuel used in houses and condos - Other fuel (%)
House heating fuel used in houses and condos - No fuel used (%)
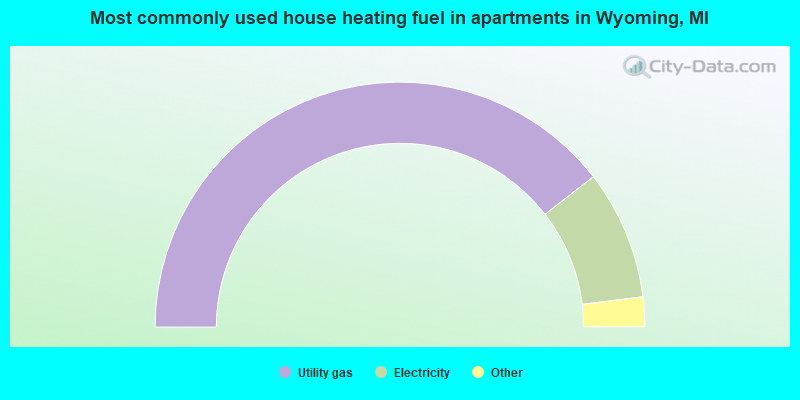
House heating fuel used in apartments - Utility gas (%)
House heating fuel used in apartments - Bottled, tank, or LP gas (%)
House heating fuel used in apartments - Electricity (%)
House heating fuel used in apartments - Fuel oil, kerosene, etc. (%)
House heating fuel used in apartments - Coal or coke (%)
House heating fuel used in apartments - Wood (%)
House heating fuel used in apartments - Solar energy (%)
House heating fuel used in apartments - Other fuel (%)
House heating fuel used in apartments - No fuel used (%)
Latest news about housing in Wyoming, MI collected exclusively by city-data.com from local newspapers, TV, and radio stations
Median year house/condo built: 1963Median year apartment built: 1976Household type by relationship:
Households: 76,730
Male householders: 11,929 (2,665 living alone ), Female householders: 15,357 (4,152 living alone )14,264 spouses (14,215 opposite-sex spouses ), 2,391 unmarried partners , (2,281 opposite-sex unmarried partners ), 23,330 children (22,180 natural , 601 adopted , 549 stepchildren ), 1,102 grandchildren , 1,293 brothers or sisters , 950 parents , 0 foster children , 2,136 other relatives , 3,153 non-relatives In group quarters: 825
Size of family households: 7,138 2-persons , 4,255 3-persons , 3,871 4-persons , 1,678 5-persons , 704 6-persons , 559 7-or-more-persons .
Size of nonfamily households: 6,817 1-person , 1,911 2-persons , 305 3-persons , 48 4-persons .
11,514 married couples with children. single-parent households (1,186 men , 3,294 women ).
77.6% of residents of Wyoming speak English at home. of residents speak Spanish at home (53% speak English very well , 23% speak English well , 13% speak English not well , 11% don't speak English at all ).of residents speak other Indo-European language at home (73% speak English very well , 16% speak English well , 4% speak English not well , 7% don't speak English at all ).of residents speak Asian or Pacific Island language at home (46% speak English very well , 31% speak English well , 18% speak English not well , 6% don't speak English at all ).of residents speak other language at home (27% speak English very well , 8% speak English well , 57% speak English not well , 8% don't speak English at all ).
Foreign born population: 11,622 (15.1%)of them are naturalized citizens )
Median number of rooms in houses and condos:
Median number of rooms in apartments
Owner-occupied Renter-occupied
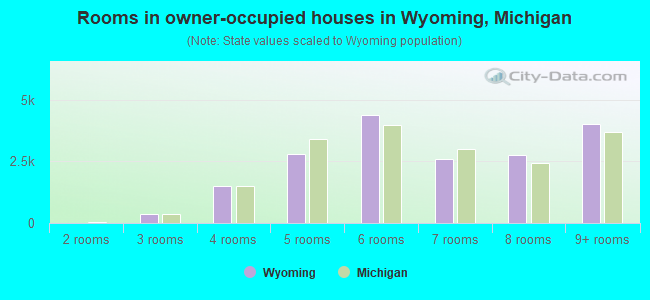
Rooms in owner-occupied houses in Wyoming, Michigan
0 1 room 0 2 rooms 384 3 rooms 1,482 4 rooms 2,821 5 rooms 4,384 6 rooms 2,601 7 rooms 2,754 8 rooms 4,031 9+ rooms
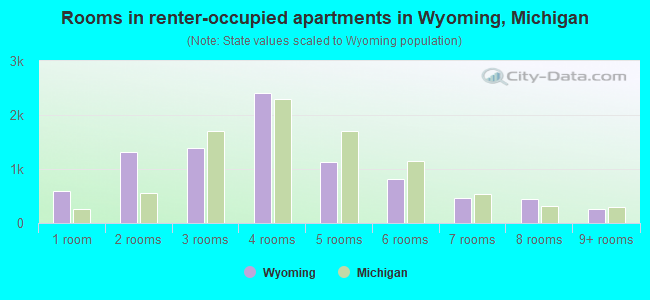
Rooms in renter-occupied apartments in Wyoming, Michigan
600 1 room 1,309 2 rooms 1,394 3 rooms 2,399 4 rooms 1,132 5 rooms 820 6 rooms 472 7 rooms 437 8 rooms 266 9+ rooms
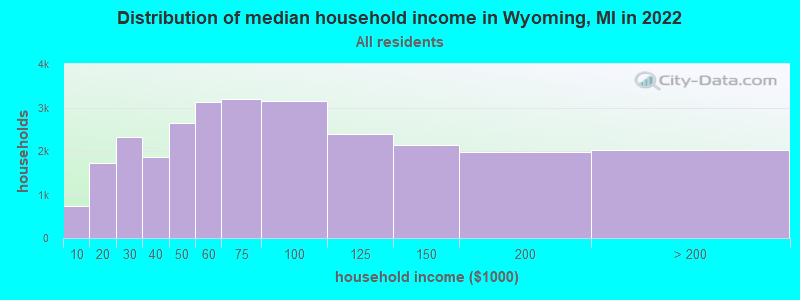
Wyoming, MI household income distribution 728 Less than $10,0001,728 $10,000 to $19,9992,326 $20,000 to $29,9991,858 $30,000 to $39,9992,643 $40,000 to $49,9993,132 $50,000 to $59,9993,203 $60,000 to $74,9993,140 $75,000 to $99,9992,401 $100,000 to $124,9992,141 $125,000 to $149,9991,966 $150,000 to $199,9992,020 $200,000 or more
Home value of owner - occupied houses in 2022 in Wyoming, MI 249 Less than $10,00073 $10,000 to $14,999157 $15,000 to $19,99959 $20,000 to $24,99945 $25,000 to $29,999108 $30,000 to $34,99945 $35,000 to $39,999112 $40,000 to $49,99999 $50,000 to $59,99975 $60,000 to $69,999201 $70,000 to $79,999318 $80,000 to $89,999262 $90,000 to $99,9991,128 $100,000 to $124,9991,049 $125,000 to $149,9992,051 $150,000 to $174,9991,636 $175,000 to $199,9992,954 $200,000 to $249,9991,750 $250,000 to $299,9992,363 $300,000 to $399,999950 $400,000 to $499,999298 $500,000 to $749,9997 $750,000 to $999,9998 $1,000,000 to $1,499,99932 $1,500,000 to $1,999,99950 $2,000,000 or moreRent paid by renters in 2022 in Wyoming, MI 10 Less than $1001 $100 to $14924 $150 to $19944 $200 to $24993 $250 to $299156 $300 to $349124 $350 to $39937 $400 to $44967 $450 to $49997 $500 to $549143 $550 to $599151 $600 to $649338 $650 to $699401 $700 to $749580 $750 to $7991,252 $800 to $8991,310 $900 to $9992,430 $1,000 to $1,2491,376 $1,250 to $1,499542 $1,500 to $1,99925 $2,000 to $2,49951 $2,500 to $2,99934 $3,500 or more215 No cash rent
Percentage of workers working in this county: 88.1%Number of people working at home: 4,162 (10.0% of all workers )
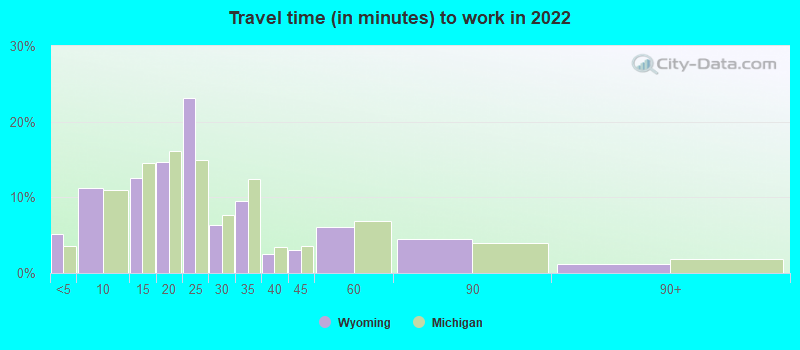
Travel time to work (commute)
Less than 5 minutes: 2,2435 to 9 minutes: 2,80010 to 14 minutes: 5,96415 to 19 minutes: 7,70020 to 24 minutes: 6,20225 to 29 minutes: 3,07330 to 34 minutes: 3,90235 to 39 minutes: 47540 to 44 minutes: 68245 to 59 minutes: 1,47760 to 89 minutes: 1,15190 or more minutes: 576
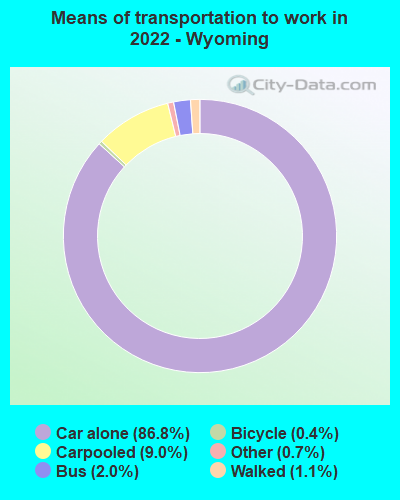
Means of transportation to work:
Drove a car alone: 35,673 (78.0%)Carpooled: 3,796 (8.3%)Bus : 595 (1.3%)Taxi: 433 (0.9%)Bicycle: 161 (0.4%)Walked: 453 (1.0%)Worked at home: 4,162 (9.1%)
Unemployment by race in 2022
Unemployment rate for White non-Hispanic residents 2.4% Males3.1% FemalesUnemployment rate for Black residents 5.2% Males8.5% FemalesUnemployment rate for American Indian and Alaska Native residents 1.3% FemalesUnemployment rate for Asian residents 5.5% Males4.8% FemalesUnemployment rate for other race residents 6.5% Males5.9% FemalesUnemployment rate for two or more race residents 2.6% Males1.5% FemalesUnemployment rate for Hispanic or Latino residents 5.2% Males4.7% Females
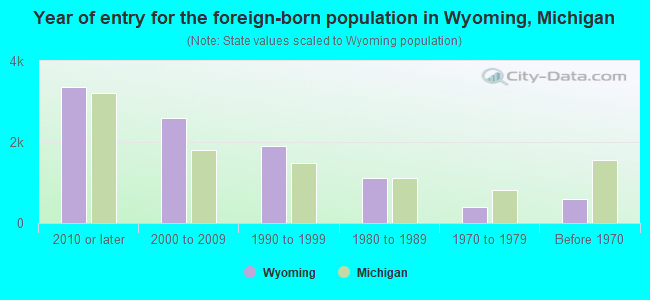
Year of entry for the foreign-born population in Wyoming, Michigan
3,359 2010 or later 2,595 2000 to 2009 1,892 1990 to 1999 1,120 1980 to 1989 406 1970 to 1979 604 Before 1970
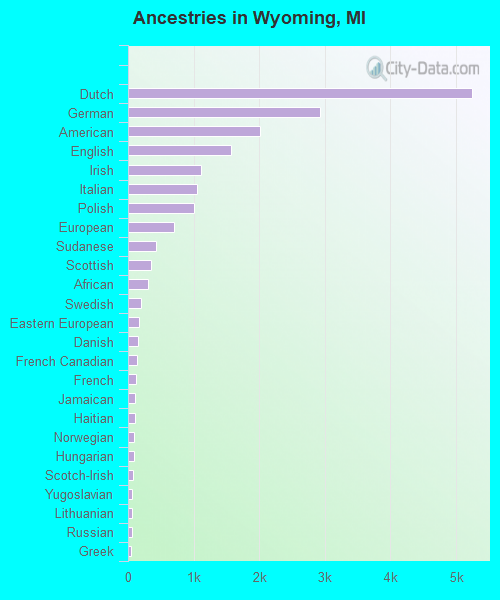
First ancestries reported:
Dutch: 5,240 (14.0%)
German: 2,932 (7.8%)
American: 2,012 (5.4%)
English: 1,569 (4.2%)
Irish: 1,116 (3.0%)
Italian: 1,049 (2.8%)
Polish: 1,006 (2.7%)
European: 704 (1.9%)
Sudanese: 428 (1.1%)
Scottish: 344 (0.9%)
African: 305 (0.8%)
Swedish: 191 (0.5%)
Eastern European: 170 (0.5%)
Danish: 156 (0.4%)
French Canadian: 132 (0.4%)
French: 122 (0.3%)
Jamaican: 104 (0.3%)
Haitian: 103 (0.3%)
Norwegian: 91 (0.2%)
Hungarian: 89 (0.2%)
Scotch-Irish: 78 (0.2%)
Yugoslavian: 68 (0.2%)
Lithuanian: 63 (0.2%)
Russian: 62 (0.2%)
Greek: 49 (0.1%)
Croatian: 46 (0.1%)
Finnish: 41 (0.1%)
Brazilian: 38 (0.1%)
Scandinavian: 36 (0.10%)
Lebanese: 36 (0.10%)
Romanian: 35 (0.09%)
Trinidadian and Tobagonian: 33 (0.09%)
Ethiopian: 32 (0.09%)
Nigerian: 32 (0.09%)
Celtic: 30 (0.08%)
Welsh: 26 (0.07%)
Latvian: 22 (0.06%)
British: 21 (0.06%)
Slovak: 16 (0.04%)
Belgian: 13 (0.03%)
Ukrainian: 10 (0.03%)
Austrian: 8 (0.02%)
South African: 8 (0.02%)
Kenyan: 8 (0.02%)
Albanian: 7 (0.02%)
Barbadian: 5 (0.01%)
Jordanian: 4 (0.01%)
Ghanaian: 3 (0.01%)
Most common places of birth for foreign-born residents (%): Mexico Wyoming:
40.1% (3,883)Michigan:
10.9% (75,965)
Guatemala Wyoming:
8.2% (797)Michigan:
1.0% (7,097)
Other Eastern Africa Wyoming:
8.1% (785)Michigan:
0.5% (3,687)
Cuba Wyoming:
6.3% (610)Michigan:
0.9% (6,481)
Vietnam Wyoming:
4.5% (437)Michigan:
1.8% (12,679)
Honduras Wyoming:
3.7% (360)Michigan:
0.5% (3,798)
Dominican Republic Wyoming:
2.7% (257)Michigan:
0.5% (3,489)
Philippines Wyoming:
2.2% (212)Michigan:
2.8% (19,112)
China, excluding Hong Kong and Taiwan Wyoming:
1.7% (160)Michigan:
4.9% (34,295)
Place of birth for U.S.-born residents:
This state: 53,203Other state: 11,031Northeast: 752Midwest: 4,733South: 4,233West: 1,313 85.5% of Wyoming residents lived in the same house 1 years ago.
Out of people who lived in different houses, 39.8% lived in this county.
Out of people who lived in different counties, 67.6% lived in Michigan.
Wyoming:
85.5%State average:
88.4%
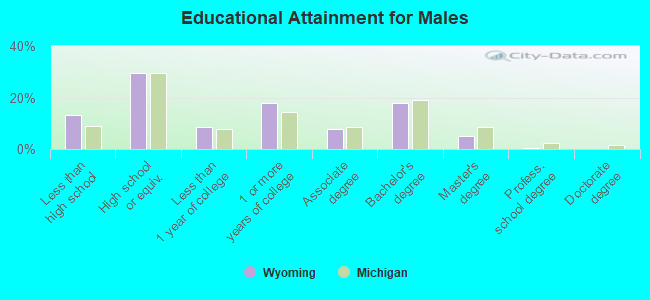
Education attainment for males 25 years and older:
No schooling: 504Nursery to 4th grade: 2535th and 6th grade: 5107th and 8th grade: 2429th grade: 13810th grade: 93311th grade: 34212th grade, no diploma: 599High school graduate (or equivalency): 7,768Less than 1 year of college: 2,231Some college more than 1 year, no degree: 4,693Associate degree: 2,020Bachelor's degree: 4,666Master's degree: 1,287Professional school degree: 139Doctorate degree: 47
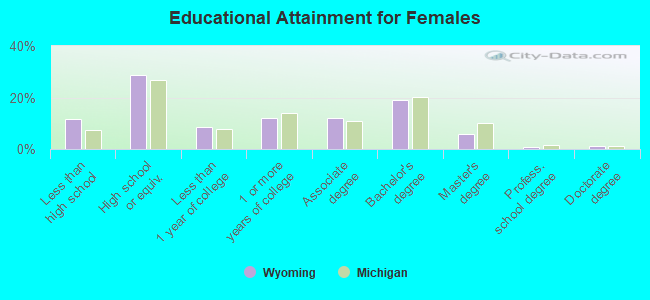
Education attainment for females 25 years and older:
No schooling: 613Nursery to 4th grade: 1755th and 6th grade: 6197th and 8th grade: 09th grade: 25710th grade: 41511th grade: 31912th grade, no diploma: 605High school graduate (or equivalency): 7,302Less than 1 year of college: 2,205Some college more than 1 year, no degree: 3,108Associate degree: 3,042Bachelor's degree: 4,834Master's degree: 1,462Professional school degree: 213Doctorate degree: 316
Housing units in structures:
One, detached: 20,028One, attached: 998Two: 9953 or 4: 1,2315 to 9: 1,23410 to 19: 2,63120 to 49: 1,24050 or more: 731Mobile homes: 492Median worth of mobile homes: $11,700
Housing units lacking complete plumbing facilities in 2022: 0.2%Housing units lacking complete kitchen facilities in 2022: 0.2%House/condo owner moved in on average 11 years ago
Renter moved in on average 2 years ago
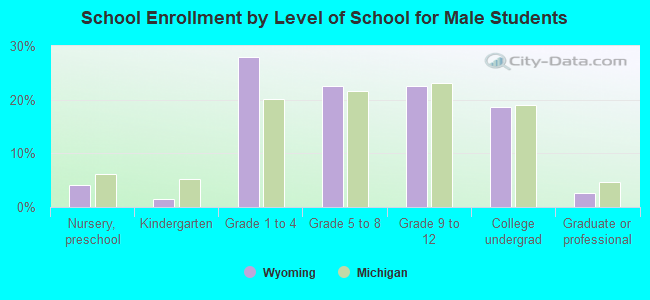
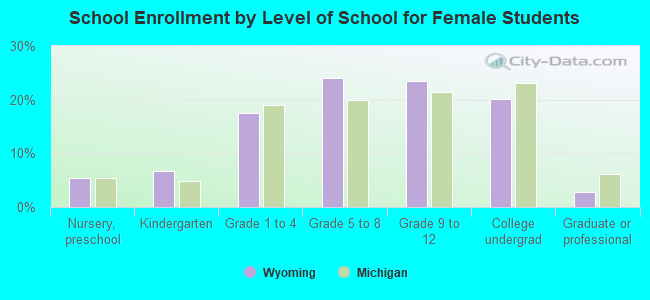
Private vs. public school enrollment:
Students in private schools in grades 1 to 8 (elementary and middle school): 841 Students in private schools in grades 9 to 12 (high school): 609 Students in private undergraduate colleges: 572