Races in Albion, Michigan (MI) Detailed Stats
Data:
Races - White alone (%)
Races - White alone (% change since 2000)
Races - Black alone (%)
Races - Black alone (% change since 2000)
Races - American Indian alone (%)
Races - American Indian alone (% change since 2000)
Races - Asian alone (%)
Races - Asian alone (% change since 2000)
Races - Hispanic (%)
Races - Hispanic (% change since 2000)
Races - Native Hawaiian and Other Pacific Islander alone (%)
Races - Native Hawaiian and Other Pacific Islander alone (% change since 2000)
Races - Two or more races(%)
Races - Two or more races(% change since 2000)
Races - Other race alone (%)
Races - Other race alone (% change since 2000)
Racial diversity
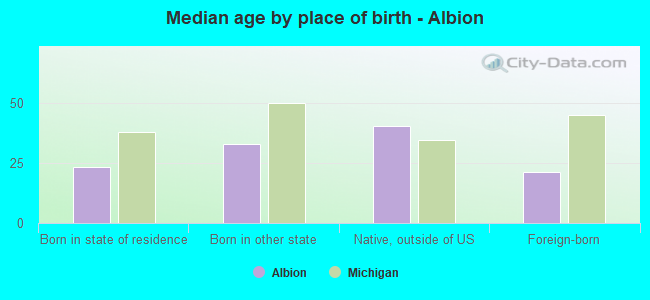
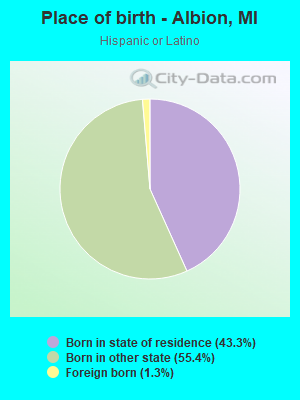
Place of birth - Born in state of residence (%)
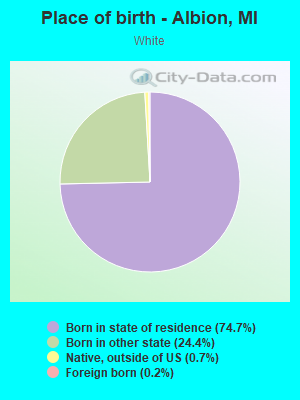
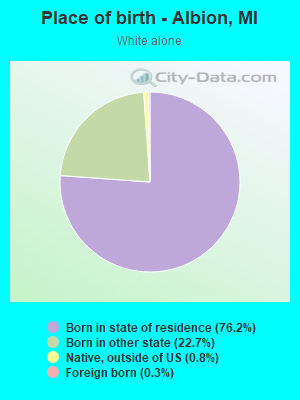
Place of birth - Born in state of residence (%) - White
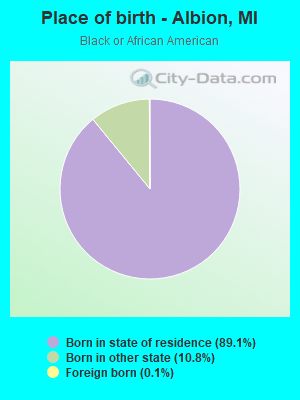
Place of birth - Born in state of residence (%) - Black or African American
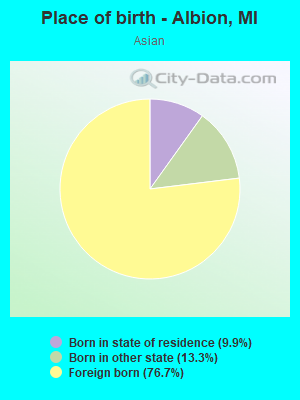
Place of birth - Born in state of residence (%) - Asian
Place of birth - Born in state of residence (%) - Hispanic or Latino
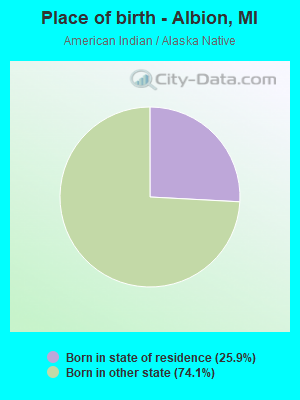
Place of birth - Born in state of residence (%) - American Indian and Alaska Native
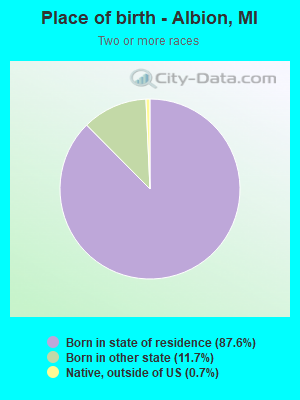
Place of birth - Born in state of residence (%) - Multirace
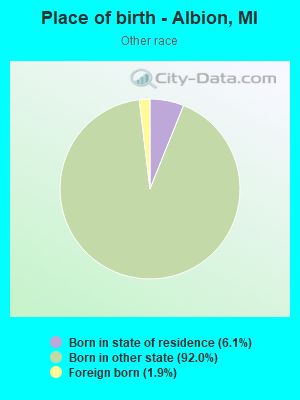
Place of birth - Born in state of residence (%) - Other Race
Place of birth - Born in other state (%)
Place of birth - Born in other state (%) - White
Place of birth - Born in other state (%) - Black or African American
Place of birth - Born in other state (%) - Asian
Place of birth - Born in other state (%) - Hispanic or Latino
Place of birth - Born in other state (%) - American Indian and Alaska Native
Place of birth - Born in other state (%) - Multirace
Place of birth - Born in other state (%) - Other Race
Place of birth - Native, outside of US (%)
Place of birth - Native, outside of US (%) - White
Place of birth - Native, outside of US (%) - Black or African American
Place of birth - Native, outside of US (%) - Asian
Place of birth - Native, outside of US (%) - Hispanic or Latino
Place of birth - Native, outside of US (%) - American Indian and Alaska Native
Place of birth - Native, outside of US (%) - Multirace
Place of birth - Native, outside of US (%) - Other Race
Place of birth - Foreign born (%)
Place of birth - Foreign born (%) - White
Place of birth - Foreign born (%) - Black or African American
Place of birth - Foreign born (%) - Asian
Place of birth - Foreign born (%) - Hispanic or Latino
Place of birth - Foreign born (%) - American Indian and Alaska Native
Place of birth - Foreign born (%) - Multirace
Place of birth - Foreign born (%) - Other Race
Residents speaking English at home (%)
Residents speaking English at home - Born in the United States (%)
Residents speaking English at home - Native, born elsewhere (%)
Residents speaking English at home - Foreign born (%)
Residents speaking Spanish at home (%)
Residents speaking Spanish at home - Born in the United States (%)
Residents speaking Spanish at home - Native, born elsewhere (%)
Residents speaking Spanish at home - Foreign born (%)
Residents speaking other language at home (%)
Residents speaking other language at home - Born in the United States (%)
Residents speaking other language at home - Native, born elsewhere (%)
Residents speaking other language at home - Foreign born (%)
Marital status - Never married (%)
Marital status - Now married (%)
Marital status - Separated (%)
Marital status - Widowed (%)
Marital status - Divorced (%)
Ancestries Reported - Arab (%)
Ancestries Reported - Czech (%)
Ancestries Reported - Danish (%)
Ancestries Reported - Dutch (%)
Ancestries Reported - English (%)
Ancestries Reported - French (%)
Ancestries Reported - French Canadian (%)
Ancestries Reported - German (%)
Ancestries Reported - Greek (%)
Ancestries Reported - Hungarian (%)
Ancestries Reported - Irish (%)
Ancestries Reported - Italian (%)
Ancestries Reported - Lithuanian (%)
Ancestries Reported - Norwegian (%)
Ancestries Reported - Polish (%)
Ancestries Reported - Portuguese (%)
Ancestries Reported - Russian (%)
Ancestries Reported - Scotch-Irish (%)
Ancestries Reported - Scottish (%)
Ancestries Reported - Slovak (%)
Ancestries Reported - Subsaharan African (%)
Ancestries Reported - Swedish (%)
Ancestries Reported - Swiss (%)
Ancestries Reported - Ukrainian (%)
Ancestries Reported - United States (%)
Ancestries Reported - Welsh (%)
Ancestries Reported - West Indian (%)
Ancestries Reported - Other (%)
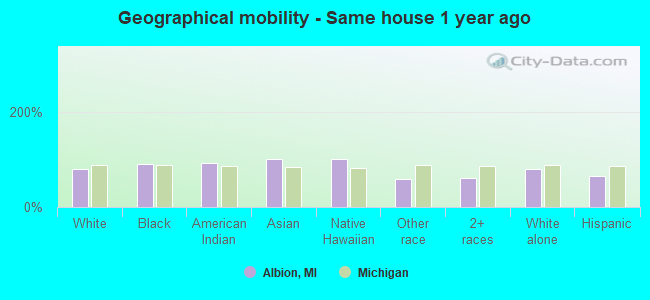
Geographical mobility - Same house 1 year ago (%)
Geographical mobility - Same house 1 year ago (%) - White
Geographical mobility - Same house 1 year ago (%) - Black or African American
Geographical mobility - Same house 1 year ago (%) - Asian
Geographical mobility - Same house 1 year ago (%) - Hispanic or Latino
Geographical mobility - Same house 1 year ago (%) - American Indian and Alaska Native
Geographical mobility - Same house 1 year ago (%) - Multirace
Geographical mobility - Same house 1 year ago (%) - Other Race
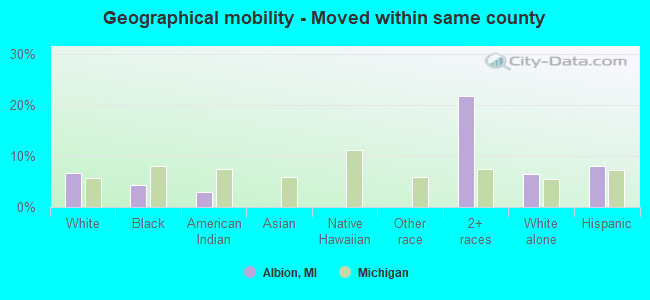
Geographical mobility - Moved within same county (%)
Geographical mobility - Moved within same county (%) - White
Geographical mobility - Moved within same county (%) - Black or African American
Geographical mobility - Moved within same county (%) - Asian
Geographical mobility - Moved within same county (%) - Hispanic or Latino
Geographical mobility - Moved within same county (%) - American Indian and Alaska Native
Geographical mobility - Moved within same county (%) - Multirace
Geographical mobility - Moved within same county (%) - Other Race
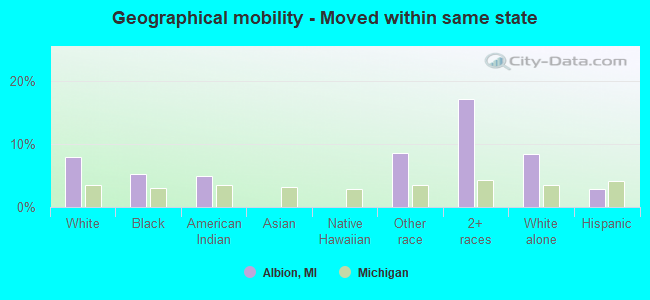
Geographical mobility - Moved from different county within same state (%)
Geographical mobility - Moved from different county within same state (%) - White
Geographical mobility - Moved from different county within same state (%) - Black or African American
Geographical mobility - Moved from different county within same state (%) - Asian
Geographical mobility - Moved from different county within same state (%) - Hispanic or Latino
Geographical mobility - Moved from different county within same state (%) - American Indian and Alaska Native
Geographical mobility - Moved from different county within same state (%) - Multirace
Geographical mobility - Moved from different county within same state (%) - Other Race
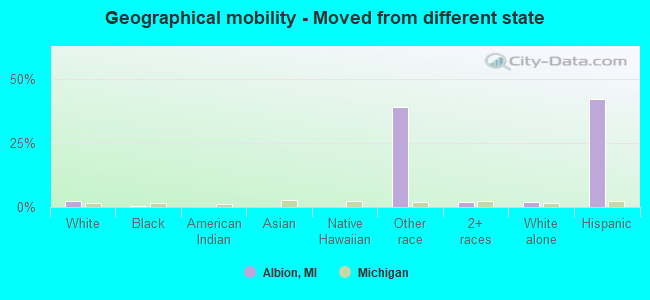
Geographical mobility - Moved from different state (%)
Geographical mobility - Moved from different state (%) - White
Geographical mobility - Moved from different state (%) - Black or African American
Geographical mobility - Moved from different state (%) - Asian
Geographical mobility - Moved from different state (%) - Hispanic or Latino
Geographical mobility - Moved from different state (%) - American Indian and Alaska Native
Geographical mobility - Moved from different state (%) - Multirace
Geographical mobility - Moved from different state (%) - Other Race
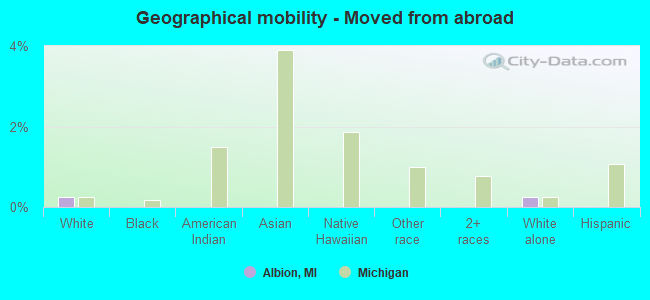
Geographical mobility - Moved from abroad (%)
Geographical mobility - Moved from abroad (%) - White
Geographical mobility - Moved from abroad (%) - Black or African American
Geographical mobility - Moved from abroad (%) - Asian
Geographical mobility - Moved from abroad (%) - Hispanic or Latino
Geographical mobility - Moved from abroad (%) - American Indian and Alaska Native
Geographical mobility - Moved from abroad (%) - Multirace
Geographical mobility - Moved from abroad (%) - Other Race
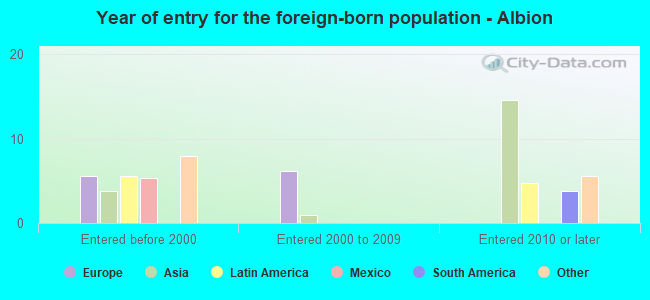
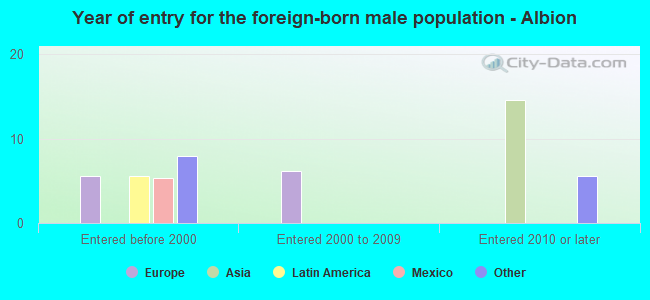
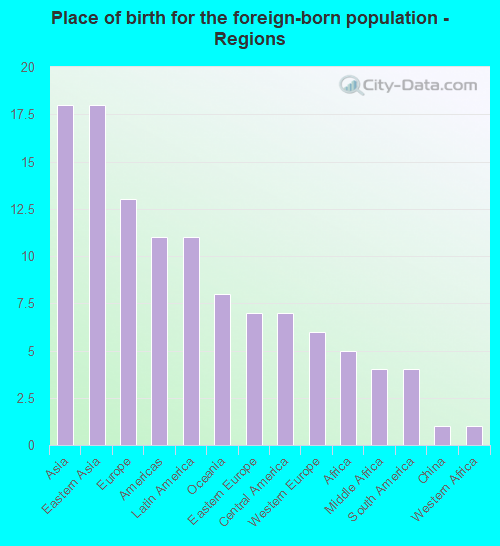
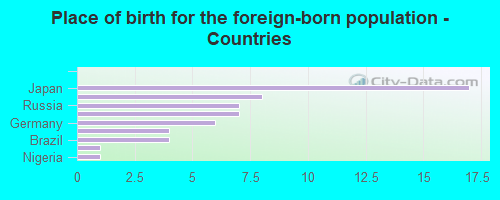
Place of birth for the foreign-born population - Ireland (%)
Place of birth for the foreign-born population - Denmark (%)
Place of birth for the foreign-born population - Norway (%)
Place of birth for the foreign-born population - Sweden (%)
Place of birth for the foreign-born population - United Kingdom (%)
Place of birth for the foreign-born population - England (%)
Place of birth for the foreign-born population - Scotland (%)
Place of birth for the foreign-born population - Other Northern Europe (%)
Place of birth for the foreign-born population - Austria (%)
Place of birth for the foreign-born population - Belgium (%)
Place of birth for the foreign-born population - France (%)
Place of birth for the foreign-born population - Germany (%)
Place of birth for the foreign-born population - Netherlands (%)
Place of birth for the foreign-born population - Switzerland (%)
Place of birth for the foreign-born population - Other Western Europe (%)
Place of birth for the foreign-born population - Greece (%)
Place of birth for the foreign-born population - Italy (%)
Place of birth for the foreign-born population - Portugal (%)
Place of birth for the foreign-born population - Spain (%)
Place of birth for the foreign-born population - Other Southern Europe (%)
Place of birth for the foreign-born population - Albania (%)
Place of birth for the foreign-born population - Belarus (%)
Place of birth for the foreign-born population - Bosnia and Herzegovina (%)
Place of birth for the foreign-born population - Bulgaria (%)
Place of birth for the foreign-born population - Croatia (%)
Place of birth for the foreign-born population - Czechoslovakia (%)
Place of birth for the foreign-born population - Hungary (%)
Place of birth for the foreign-born population - Latvia (%)
Place of birth for the foreign-born population - Lithuania (%)
Place of birth for the foreign-born population - North Macedonia (Macedonia) (%)
Place of birth for the foreign-born population - Moldova (%)
Place of birth for the foreign-born population - Poland (%)
Place of birth for the foreign-born population - Romania (%)
Place of birth for the foreign-born population - Russia (%)
Place of birth for the foreign-born population - Serbia (%)
Place of birth for the foreign-born population - Ukraine (%)
Place of birth for the foreign-born population - Other Eastern Europe (%)
Place of birth for the foreign-born population - China (%)
Place of birth for the foreign-born population - Hong Kong (%)
Place of birth for the foreign-born population - Taiwan (%)
Place of birth for the foreign-born population - Japan (%)
Place of birth for the foreign-born population - Korea (%)
Place of birth for the foreign-born population - Other Eastern Asia (%)
Place of birth for the foreign-born population - Afghanistan (%)
Place of birth for the foreign-born population - Bangladesh (%)
Place of birth for the foreign-born population - India (%)
Place of birth for the foreign-born population - Iran (%)
Place of birth for the foreign-born population - Kazakhstan (%)
Place of birth for the foreign-born population - Nepal (%)
Place of birth for the foreign-born population - Pakistan (%)
Place of birth for the foreign-born population - Sri Lanka (%)
Place of birth for the foreign-born population - Uzbekistan (%)
Place of birth for the foreign-born population - Other South Central Asia (%)
Place of birth for the foreign-born population - Burma (%)
Place of birth for the foreign-born population - Cambodia (%)
Place of birth for the foreign-born population - Indonesia (%)
Place of birth for the foreign-born population - Laos (%)
Place of birth for the foreign-born population - Malaysia (%)
Place of birth for the foreign-born population - Philippines (%)
Place of birth for the foreign-born population - Singapore (%)
Place of birth for the foreign-born population - Thailand (%)
Place of birth for the foreign-born population - Vietnam (%)
Place of birth for the foreign-born population - Other South Eastern Asia (%)
Place of birth for the foreign-born population - Armenia (%)
Place of birth for the foreign-born population - Iraq (%)
Place of birth for the foreign-born population - Israel (%)
Place of birth for the foreign-born population - Jordan (%)
Place of birth for the foreign-born population - Kuwait (%)
Place of birth for the foreign-born population - Lebanon (%)
Place of birth for the foreign-born population - Saudi Arabia (%)
Place of birth for the foreign-born population - Syria (%)
Place of birth for the foreign-born population - Turkey (%)
Place of birth for the foreign-born population - Yemen (%)
Place of birth for the foreign-born population - Other Western Asia (%)
Place of birth for the foreign-born population - Eritrea (%)
Place of birth for the foreign-born population - Ethiopia (%)
Place of birth for the foreign-born population - Kenya (%)
Place of birth for the foreign-born population - Somalia (%)
Place of birth for the foreign-born population - Uganda (%)
Place of birth for the foreign-born population - Zimbabwe (%)
Place of birth for the foreign-born population - Other Eastern Africa (%)
Place of birth for the foreign-born population - Cameroon (%)
Place of birth for the foreign-born population - Congo (%)
Place of birth for the foreign-born population - Democratic Republic of Congo (Zaire) (%)
Place of birth for the foreign-born population - Other Middle Africa (%)
Place of birth for the foreign-born population - Egypt (%)
Place of birth for the foreign-born population - Morocco (%)
Place of birth for the foreign-born population - Sudan (%)
Place of birth for the foreign-born population - Other Northern Africa (%)
Place of birth for the foreign-born population - South Africa (%)
Place of birth for the foreign-born population - Other Southern Africa (%)
Place of birth for the foreign-born population - Cabo Verde (%)
Place of birth for the foreign-born population - Ghana (%)
Place of birth for the foreign-born population - Liberia (%)
Place of birth for the foreign-born population - Nigeria (%)
Place of birth for the foreign-born population - Senegal (%)
Place of birth for the foreign-born population - Sierra Leone (%)
Place of birth for the foreign-born population - Other Western Africa (%)
Place of birth for the foreign-born population - Australia (%)
Place of birth for the foreign-born population - New Zealand (%)
Place of birth for the foreign-born population - Fiji (%)
Place of birth for the foreign-born population - Micronesia (%)
Place of birth for the foreign-born population - Bahamas (%)
Place of birth for the foreign-born population - Barbados (%)
Place of birth for the foreign-born population - Cuba (%)
Place of birth for the foreign-born population - Dominica (%)
Place of birth for the foreign-born population - Dominican Republic (%)
Place of birth for the foreign-born population - Grenada (%)
Place of birth for the foreign-born population - Haiti (%)
Place of birth for the foreign-born population - Jamaica (%)
Place of birth for the foreign-born population - St. Vincent and the Grenadines (%)
Place of birth for the foreign-born population - Trinidad and Tobago (%)
Place of birth for the foreign-born population - West Indies (%)
Place of birth for the foreign-born population - Other Caribbean (%)
Place of birth for the foreign-born population - Belize (%)
Place of birth for the foreign-born population - Costa Rica (%)
Place of birth for the foreign-born population - El Salvador (%)
Place of birth for the foreign-born population - Guatemala (%)
Place of birth for the foreign-born population - Honduras (%)
Place of birth for the foreign-born population - Mexico (%)
Place of birth for the foreign-born population - Nicaragua (%)
Place of birth for the foreign-born population - Panama (%)
Place of birth for the foreign-born population - Other Central America (%)
Place of birth for the foreign-born population - Argentina (%)
Place of birth for the foreign-born population - Bolivia (%)
Place of birth for the foreign-born population - Brazil (%)
Place of birth for the foreign-born population - Chile (%)
Place of birth for the foreign-born population - Colombia (%)
Place of birth for the foreign-born population - Ecuador (%)
Place of birth for the foreign-born population - Guyana (%)
Place of birth for the foreign-born population - Peru (%)
Place of birth for the foreign-born population - Uruguay (%)
Place of birth for the foreign-born population - Venezuela (%)
Place of birth for the foreign-born population - Other South America (%)
Place of birth for the foreign-born population - Canada (%)
Place of birth for the foreign-born population - Other Northern America (%)
Place of birth for the foreign-born population - Other (%)
Latest news about races in Albion, MI collected exclusively by city-data.com from local newspapers, TV, and radio stations
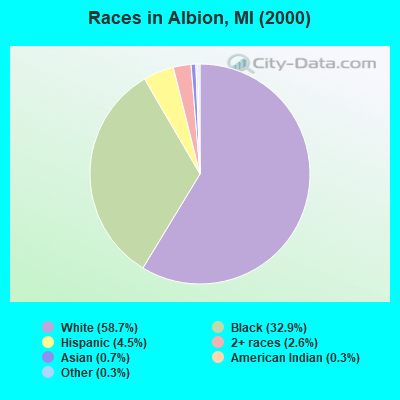
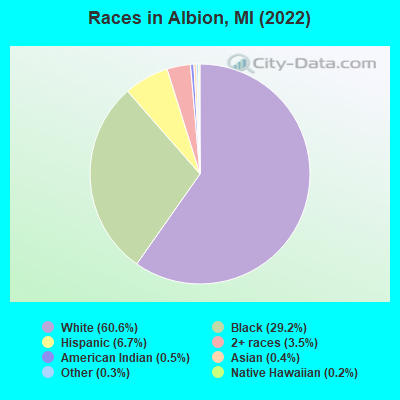
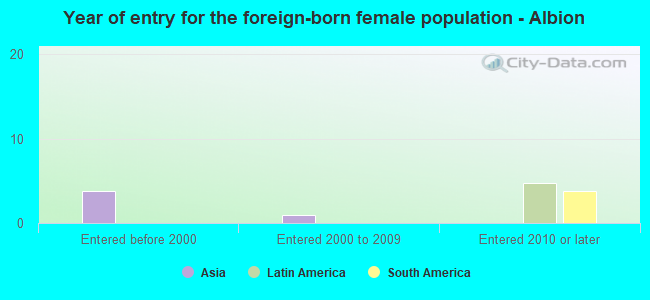
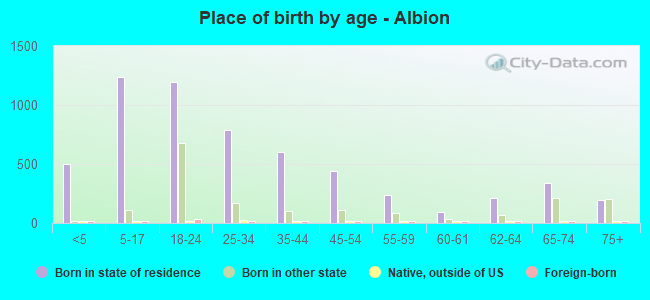
According to 2022 data, the most numerous races in Albion, MI are White alone (4,661 residents), Black alone (2,242 residents), and Hispanic (517 residents). 95.6% of Albion residents speak English at home. 0.7% of Albion, MI residents are foreign-born , which is 738.9% less than the foreign-born rate of 6.0% across the entire state of Michigan.
Race distribution in Albion
2000 2022
7,806,691 78.6% White alone 1,402,047 14.1% Black alone 323,877 3.3% Hispanic 175,311 1.8% Asian alone 163,487 1.6% Two or more races 53,421 0.5% American Indian alone 11,465 0.1% Other race alone 2,145 0.02% Native Hawaiian and Other
7,289,051 72.6% White alone 1,310,464 13.1% Black alone 572,405 5.7% Hispanic 450,031 4.5% Two or more races 335,732 3.3% Asian alone 45,217 0.5% Other race alone 29,011 0.3% American Indian alone 2,207 0.02% Native Hawaiian and Other
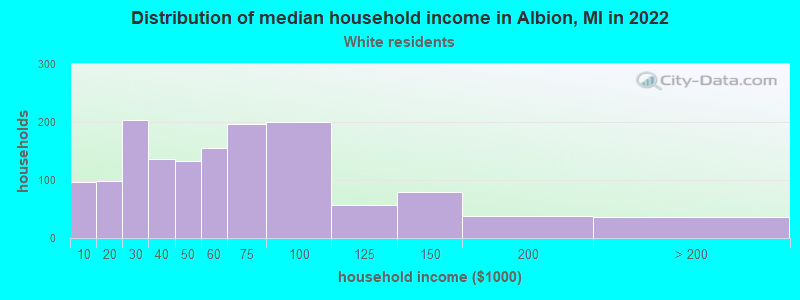
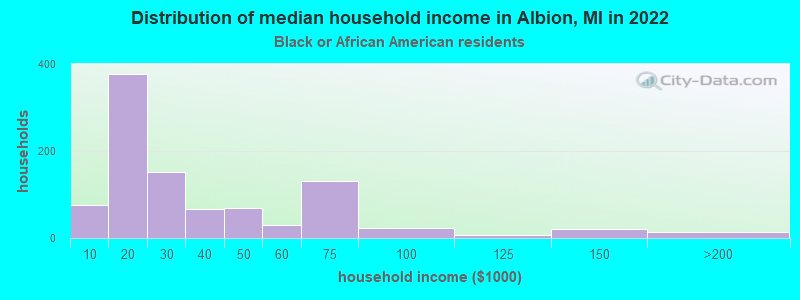
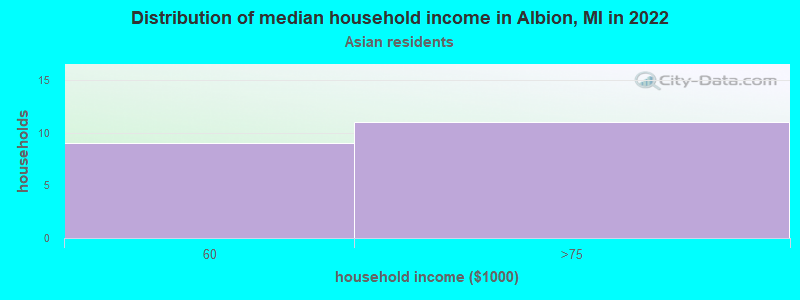
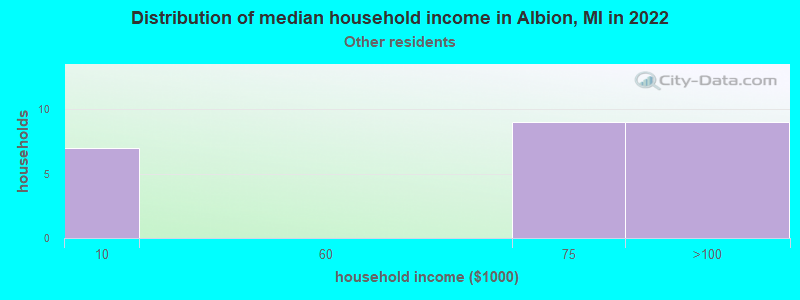
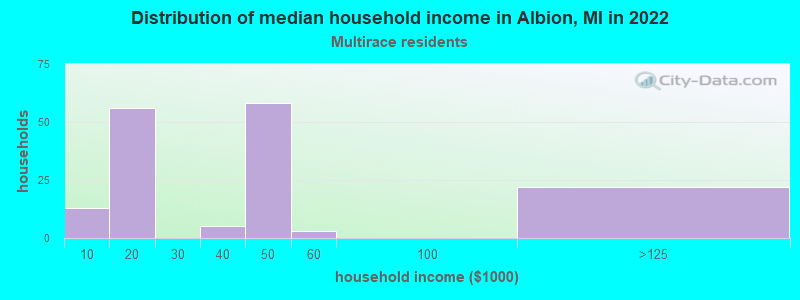
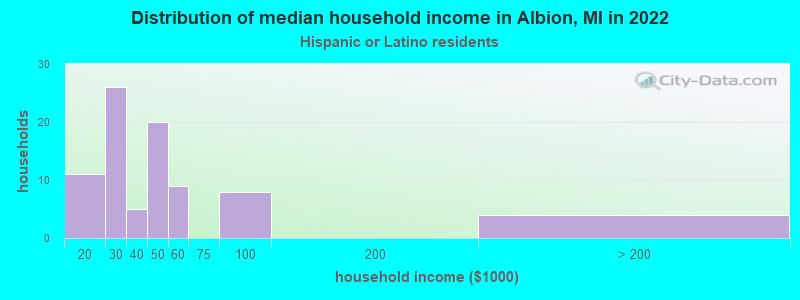
Income and house value in Albion Median household income in 2022 $53,300 White non-Hispanic householders$22,643 Black householders$64,013 Hispanic or Latino race householdersMedian 2022 house value $92,779 White Non-Hispanic householders$86,623 Black or African American householders$82,570 Some other race householders$96,082 Two or more races householders$97,583 Hispanic or Latino householders
Median age by race in Albion
29.5 Median age for White residents28.2 31.2 25.1 Median age for Black or African American residents19.1 29.4 27.8 Median age for American Indian / Alaska Native residents28.3 46.8 19.1 Median age for Asian residents-854,644,807.9 17.4 -670,531,400.3 Median age for Native Hawaiian / Pacific Islander residents-674,772,035.8 -666,666,666.0 20.9 Median age for Other race residents19.2 19.9 23.8 Median age for Two or more races residents24.9 22.1 30.4 Median age for White alone residents29.1 31.6 18.5 Median age for Hispanic or Latino residents19.6 17.9
Owner/renter occupied households by race in Albion
House owners and renters - White residents 1,016 73.1% Owner occupied373 26.9% Renter occupiedHouse owners and renters - Black or African American residents 442 51.5% Owner occupied417 48.5% Renter occupiedHouse owners and renters - American Indian / Alaska Native residents 2 100.0% Renter occupiedHouse owners and renters - Asian residents 1 23.6% Owner occupied4 76.4% Renter occupiedHouse owners and renters - Other race residents 22 100.0% Owner occupiedHouse owners and renters - Two or more races residents 34 29.8% Owner occupied81 70.2% Renter occupiedHouse owners and renters - White alone residents 1,004 73.5% Owner occupied361 26.5% Renter occupiedHouse owners and renters - Hispanic or Latino residents 25 43.5% Owner occupied32 56.5% Renter occupied
Language usage in Albion
English speakers - Total 95.6% of residents of Albion speak English at home.
3.2% of residents speak Spanish at home 177 77.3% Speak English very well52 22.7% Speak English less than very well1.2% of residents speak other language at home 68 81.0% Speak English very well16 19.0% Speak English less than very well
English speakers - Born in the United States 87.1% of residents of Albion speak English at home.
13.5% of residents speak Spanish at home 108 47.6% Speak English very well119 52.4% Speak English less than very well1.8% of residents speak other language at home 31 100.0% Speak English very well
All residents speak only English at home
English speakers - Foreign-born 18.9% of residents of Albion speak English at home.
17.0% of residents speak Spanish at home 9 100.0% Speak English very well75.5% of residents speak other language at home 37 92.5% Speak English very well3 7.5% Speak English less than very well
White (Caucasian) - Speak only English Native:
98.0% (4,467)Foreign-born:
54.4% (5)
White (Caucasian) - Speak another language Native:
1.8% (83)Foreign-born:
49.8% (5)
Black or African American - Speak another language Native:
0.4% (8)Foreign-born:
100.0% (5)
Asian - Speak only English Native:
96.8% (6)Foreign-born:
21.2% (4)
Other race - Speak another language Native:
75.0% (88)Foreign-born:
100.0% (4)
White alone - Speak only English Native:
99.1% (4,322)Foreign-born:
43.2% (5)
White alone - Speak another language Native:
0.9% (39)Foreign-born:
57.0% (7)
Hispanic or Latino - Speak another language Native:
41.0% (217)Foreign-born:
99.4% (7)
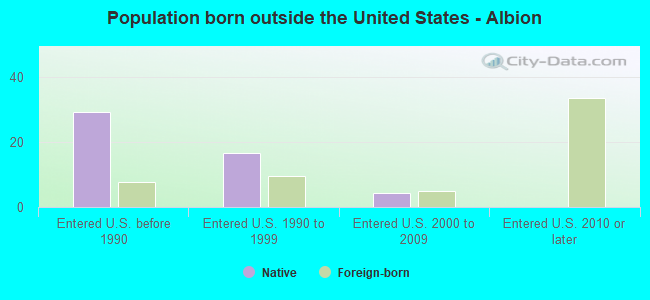
Foreign-born residents in Albion 55 residents are foreign born
This city:
0.7%Michigan:
6.9%
Marital status for residents in Albion Marital status - White (Caucasian) population 15 years and over
Males 49.7% Never married37.0% Now married0.9% Separated1.1% Widowed11.2% DivorcedFemales 51.3% Never married27.9% Now married2.9% Separated6.8% Widowed11.1% DivorcedWomen who gave birth in the past 12 months Now married:
59.3% (15)Unmarried:
40.7% (11)
Women who did not give birth in the past 12 months Now married:
25.2% (378)Unmarried:
74.8% (1,125)
Marital status - Black or African American population 15 years and over
Males 55.4% Never married27.1% Now married6.5% Separated0.6% Widowed10.4% DivorcedFemales 57.3% Never married21.8% Now married3.2% Separated8.2% Widowed9.4% DivorcedWomen who did not give birth in the past 12 months Now married:
17.0% (82)Unmarried:
83.0% (398)
Marital status - American Indian / Alaska Native population 15 years and over
Males 89.1% Never married2.2% Now married0.0% Separated8.7% Widowed0.0% DivorcedFemales 81.8% Never married0.0% Now married0.0% Separated0.0% Widowed18.2% DivorcedWomen who did not give birth in the past 12 months Now married:
0.0% (0)Unmarried:
100.0% (9)
Marital status - Asian population 15 years and over
Males 100.0% Never married0.0% Now married0.0% Separated0.0% Widowed0.0% DivorcedFemales 90.0% Never married10.0% Now married0.0% Separated0.0% Widowed0.0% DivorcedWomen who did not give birth in the past 12 months Now married:
16.7% (1)Unmarried:
83.3% (5)
Marital status - Other race population 15 years and over
Males 76.9% Never married15.4% Now married0.0% Separated0.0% Widowed7.7% DivorcedFemales 68.4% Never married21.1% Now married0.0% Separated0.0% Widowed10.5% DivorcedWomen who did not give birth in the past 12 months Now married:
0.0% (0)Unmarried:
100.0% (47)
Marital status - Two or more races population 15 years and over
Males 73.3% Never married9.9% Now married0.0% Separated0.0% Widowed16.8% DivorcedFemales 85.9% Never married6.0% Now married0.0% Separated0.0% Widowed8.1% DivorcedWomen who did not give birth in the past 12 months Now married:
1.6% (3)Unmarried:
98.4% (163)
Marital status - White alone, not Hispanic / Latino population 15 years and over
Males 48.4% Never married37.9% Now married1.0% Separated1.2% Widowed11.6% DivorcedFemales 49.6% Never married28.7% Now married3.1% Separated7.2% Widowed11.3% DivorcedWomen who gave birth in the past 12 months Now married:
59.3% (16)Unmarried:
40.7% (11)
Women who did not give birth in the past 12 months Now married:
26.5% (371)Unmarried:
73.5% (1,027)
Marital status - Hispanic or Latino population 15 years and over
Males 84.5% Never married6.1% Now married5.5% Separated0.0% Widowed3.9% DivorcedFemales 79.2% Never married14.3% Now married0.0% Separated0.0% Widowed6.5% DivorcedWomen who did not give birth in the past 12 months Now married:
5.7% (12)Unmarried:
94.3% (207)
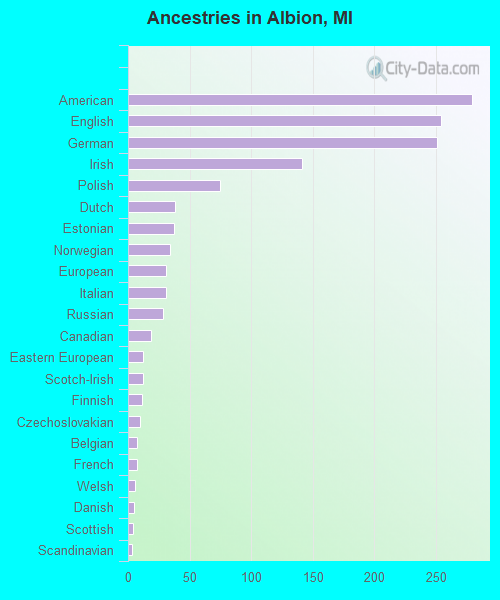
Ancestries in Albion
279 7.3% American254 6.7% English251 6.6% German141 3.7% Irish75 2.0% Polish38 1.0% Dutch37 1.0% Estonian34 0.9% Norwegian31 0.8% European31 0.8% Italian28 0.7% Russian19 0.5% Canadian12 0.3% Eastern European12 0.3% Scotch-Irish11 0.3% Finnish10 0.3% Czechoslovakian7 0.2% Belgian7 0.2% French6 0.2% Welsh5 0.1% Danish4 0.1% Scottish3 0.08% Scandinavian2 0.05% Austrian1 0.03% French Canadian1 0.03% Nigerian
Children Nativity (place of birth) in Albion
Children under 6 years - Living with two parents Both parents native 249 100.0% NativeChildren under 6 years - Living with one parent Native parent 356 100.0% NativeChildren 6 to 17 years - Living with two parents Both parents native 343 100.0% NativeChildren 6 to 17 years - Living with one parent Native parent 822 100.0% NativeForeign-born parent 2 49.3% Native2 50.7% Foreign-born
Grandparents responsible for own grandchildren in Albion
Grandparents (30 to 59 years) White / Caucasian 35 52.5% Responsible for grandchildren31 47.5% Not responsible for grandchildrenAmerican Indian / Alaska Native 1 73.8% Responsible for grandchildrenOther race 1 100.0% Responsible for grandchildrenWhite alone, not Hispanic / Latino 35 52.5% Responsible for grandchildren31 47.5% Not responsible for grandchildrenHispanic or Latino 1 61.6% Responsible for grandchildrenGrandparents (60 years and over) White / Caucasian 18 42.7% Responsible for grandchildren24 57.3% Not responsible for grandchildrenWhite alone, not Hispanic / Latino 18 41.6% Responsible for grandchildren25 58.4% Not responsible for grandchildren