Races in Alma, Michigan (MI) Detailed Stats
Ancestries, Foreign-born residents, place of birth
Settings
X


Recent posts about races in Alma, Michigan on our local forum with over 2,400,000 registered users:
 | Where in Michigan resembles Western Washington but w/o rain? (43 replies) |
| Moving to Alma Michigan (10 replies) |
| Michigan continues slow growth trend (but not losses) (39 replies) |
| South Warren: Livable for my situation? (5 replies) |
| Haslett and working at CMU (7 replies) |
Latest news about races in Alma, MI collected exclusively by city-data.com from local newspapers, TV, and radio stations
According to 2022 data, the most numerous races in Alma, MI are White alone (7,760 residents), Black alone (216 residents), and Hispanic (1,077 residents). 92.5% of Alma residents speak English at home. 2.2% of Alma, MI residents are foreign-born (1.7% born in Asia), which is 167.7% less than the foreign-born rate of 6.0% across the entire state of Michigan.
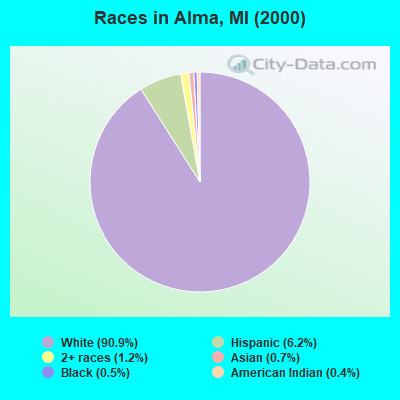
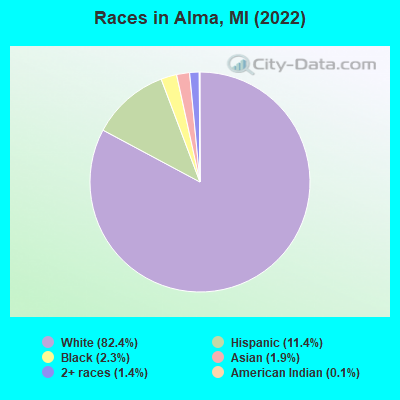
Race distribution in Alma
2000
2022

- 8,43490.9%White alone
- 5766.2%Hispanic
- 1071.2%Two or more races
- 690.7%Asian alone
- 450.5%Black alone
- 400.4%American Indian alone
- 30.03%Other race alone
- 10.01%Native Hawaiian and Other
Pacific Islander alone
-
- 7,76082.4%White alone
- 1,07711.4%Hispanic
- 2162.3%Black alone
- 1801.9%Asian alone
- 1361.4%Two or more races
- 140.1%American Indian alone
2000
2022
-
- 7,806,69178.6%White alone
- 1,402,04714.1%Black alone
- 323,8773.3%Hispanic
- 175,3111.8%Asian alone
- 163,4871.6%Two or more races
- 53,4210.5%American Indian alone
- 11,4650.1%Other race alone
- 2,1450.02%Native Hawaiian and Other
Pacific Islander alone

-
- 7,289,05172.6%White alone
- 1,310,46413.1%Black alone
- 572,4055.7%Hispanic
- 450,0314.5%Two or more races
- 335,7323.3%Asian alone
- 45,2170.5%Other race alone
- 29,0110.3%American Indian alone
- 2,2070.02%Native Hawaiian and Other
Pacific Islander alone

Income and house value in Alma
- Median household income in 2022
- $42,499White non-Hispanic householders
- Median 2022 house value
- $112,248White Non-Hispanic householders
- $70,901American Indian or Alaska Native householders
- $87,746Some other race householders
- $87,440Two or more races householders
- $92,647Hispanic or Latino householders
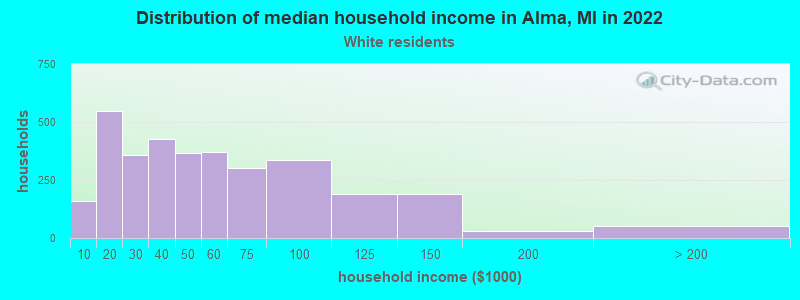
Household income for White non-Hispanic householders
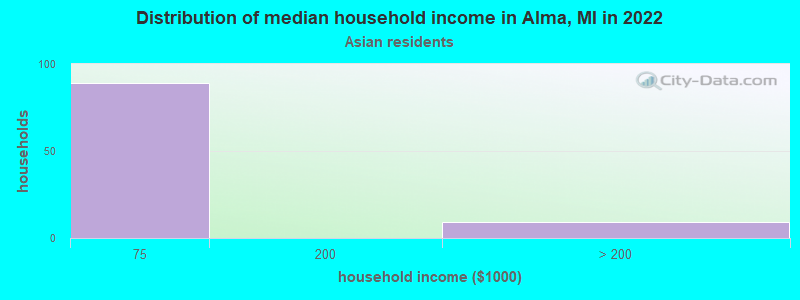
Household income for Asian householders
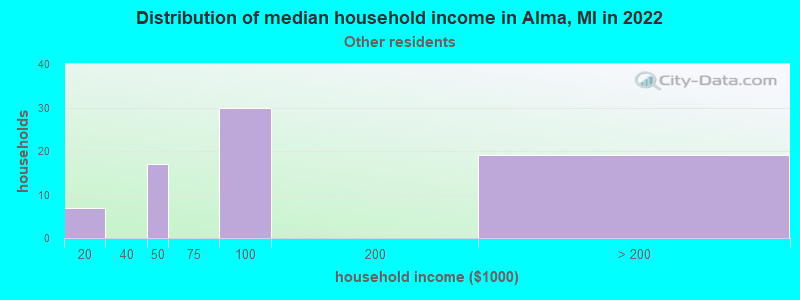
Household income for Some other race householders
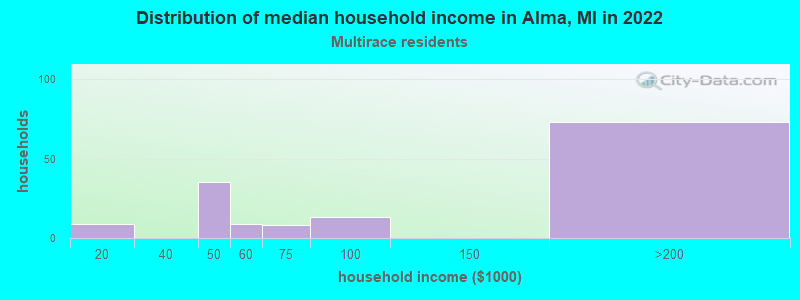
Household income for Two or more races householders
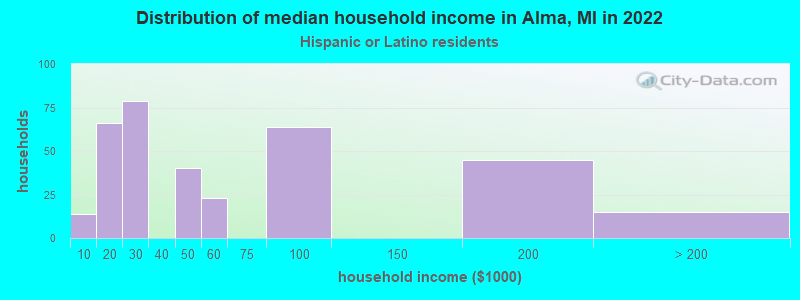
Household income for Hispanic or Latino race householders
Median age by race in Alma
- 33.5Median age for White residents
- 29.2Males
- 38.5Females
- 26.0Median age for Black or African American residents
- 43.7Males
- -681,278,538.1Females
- 23.1Median age for American Indian / Alaska Native residents
- -672,284,643.5Males
- -673,835,124.8Females
- 28.4Median age for Asian residents
- 40.8Males
- 28.0Females
- -670,531,400.3Median age for Native Hawaiian / Pacific Islander residents
- -674,772,035.8Males
- -699,588,476.7Females
- 50.4Median age for Other race residents
- -713,178,293.9Males
- 28.9Females
- 35.1Median age for Two or more races residents
- 37.2Males
- 22.3Females
- 36.1Median age for White alone residents
- 31.1Males
- 41.0Females
- 24.8Median age for Hispanic or Latino residents
- 20.5Males
- 26.0Females
Owner/renter occupied households by race in Alma
- House owners and renters - White residents
- 2,02761.8%Owner occupied
- 1,25538.2%Renter occupied
- House owners and renters - Asian residents
- 910.3%Owner occupied
- 7789.7%Renter occupied
- House owners and renters - Other race residents
- 5272.5%Owner occupied
- 2027.5%Renter occupied
- House owners and renters - Two or more races residents
- 13893.5%Owner occupied
- 106.5%Renter occupied
- House owners and renters - White alone residents
- 2,00964.6%Owner occupied
- 1,09935.4%Renter occupied
- House owners and renters - Hispanic or Latino residents
- 15743.2%Owner occupied
- 20756.8%Renter occupied
Language usage in Alma
- English speakers - Total
- 92.5% of residents of Alma speak English at home.
- 4.4% of residents speak Spanish at home
- 31279.6%Speak English very well
- 8020.4%Speak English less than very well
- 3.0% of residents speak other language at home
- 12646.5%Speak English very well
- 14553.5%Speak English less than very well
- English speakers - Born in the United States
- 91.1% of residents of Alma speak English at home.
- 8.4% of residents speak Spanish at home
- 9593.1%Speak English very well
- 76.9%Speak English less than very well
- 0.5% of residents speak other language at home
- 6100.0%Speak English very well
- English speakers - Native, born elsewhere
- 88.2% of residents of Alma speak English at home.
- 11.8% of residents speak other language at home
- 2100.0%Speak English very well
- English speakers - Foreign-born
- 25.1% of residents of Alma speak English at home.
- 7.1% of residents speak Spanish at home
- 15100.0%Speak English very well
- 68.2% of residents speak other language at home
- 3826.4%Speak English very well
- 10673.6%Speak English less than very well
White (Caucasian) - Speak only English
| Native: | 95.9% (7,636) |
| Foreign-born: | 41.7% (9) |
White (Caucasian) - Speak another language
| Native: | 4.0% (321) |
| Foreign-born: | 58.3% (13) |
Asian - Speak only English
| Native: | 13.8% (1) |
| Foreign-born: | 23.8% (41) |
Asian - Speak another language
| Native: | 88.5% (7) |
| Foreign-born: | 75.6% (130) |
Other race - Speak another language
| Native: | 47.7% (74) |
| Foreign-born: | 100.0% (15) |
Two or more races - Speak only English
| Native: | 65.6% (186) |
| Foreign-born: | 82.9% (6) |
White alone - Speak only English
| Native: | 97.6% (7,227) |
| Foreign-born: | 39.1% (9) |
White alone - Speak another language
| Native: | 2.4% (175) |
| Foreign-born: | 59.7% (14) |
Hispanic or Latino - Speak another language
| Native: | 34.8% (334) |
| Foreign-born: | 100.0% (14) |
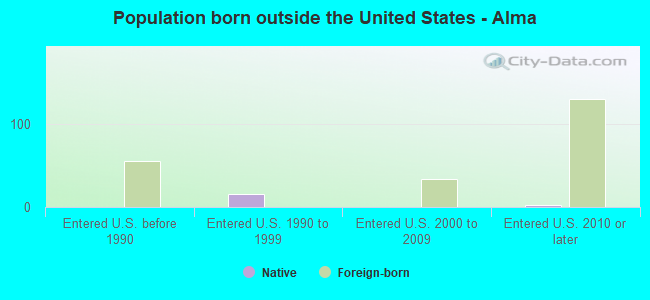
Foreign-born residents in Alma
211 residents are foreign born (1.7% Asia).
| This city: | 2.2% |
| Michigan: | 6.9% |
Marital status for residents in Alma
Marital status - White (Caucasian) population 15 years and over
- Males
- 42.7%Never married
- 46.1%Now married
- 1.0%Separated
- 3.3%Widowed
- 6.9%Divorced
- Females
- 38.1%Never married
- 38.5%Now married
- 1.1%Separated
- 6.9%Widowed
- 15.4%Divorced
Women who gave birth in the past 12 months
| Now married: | 77.0% (119) |
| Unmarried: | 23.0% (36) |
Women who did not give birth in the past 12 months
| Now married: | 36.4% (713) |
| Unmarried: | 63.6% (1,247) |
Marital status - Black or African American population 15 years and over
- Males
- 48.8%Never married
- 51.2%Now married
- 0.0%Separated
- 0.0%Widowed
- 0.0%Divorced
- Females
- 100.0%Never married
- 0.0%Now married
- 0.0%Separated
- 0.0%Widowed
- 0.0%Divorced
Women who did not give birth in the past 12 months
| Now married: | 0.0% (0) |
| Unmarried: | 100.0% (17) |
Marital status - American Indian / Alaska Native population 15 years and over
- Males
- 0.0%Never married
- 100.0%Now married
- 0.0%Separated
- 0.0%Widowed
- 0.0%Divorced
- Females
- 100.0%Never married
- 0.0%Now married
- 0.0%Separated
- 0.0%Widowed
- 0.0%Divorced
Women who did not give birth in the past 12 months
| Now married: | 0.0% (0) |
| Unmarried: | 100.0% (11) |
Marital status - Asian population 15 years and over
- Males
- 14.0%Never married
- 69.8%Now married
- 0.0%Separated
- 0.0%Widowed
- 16.3%Divorced
- Females
- 34.8%Never married
- 65.2%Now married
- 0.0%Separated
- 0.0%Widowed
- 0.0%Divorced
Women who did not give birth in the past 12 months
| Now married: | 62.6% (80) |
| Unmarried: | 37.4% (48) |
Marital status - Other race population 15 years and over
- Males
- 0.0%Never married
- 0.0%Now married
- 0.0%Separated
- 36.0%Widowed
- 64.0%Divorced
- Females
- 31.2%Never married
- 14.6%Now married
- 0.0%Separated
- 20.8%Widowed
- 33.3%Divorced
Women who did not give birth in the past 12 months
| Now married: | 24.1% (17) |
| Unmarried: | 75.9% (53) |
Marital status - Two or more races population 15 years and over
- Males
- 19.0%Never married
- 73.8%Now married
- 0.0%Separated
- 0.0%Widowed
- 7.1%Divorced
- Females
- 26.6%Never married
- 73.4%Now married
- 0.0%Separated
- 0.0%Widowed
- 0.0%Divorced
Women who did not give birth in the past 12 months
| Now married: | 78.4% (78) |
| Unmarried: | 21.6% (21) |
Marital status - White alone, not Hispanic / Latino population 15 years and over
- Males
- 42.1%Never married
- 46.1%Now married
- 1.0%Separated
- 3.4%Widowed
- 7.3%Divorced
- Females
- 36.3%Never married
- 39.6%Now married
- 1.2%Separated
- 7.4%Widowed
- 15.4%Divorced
Women who gave birth in the past 12 months
| Now married: | 77.0% (121) |
| Unmarried: | 23.0% (36) |
Women who did not give birth in the past 12 months
| Now married: | 38.4% (682) |
| Unmarried: | 61.6% (1,093) |
Marital status - Hispanic or Latino population 15 years and over
- Males
- 41.8%Never married
- 45.1%Now married
- 0.0%Separated
- 3.8%Widowed
- 9.3%Divorced
- Females
- 49.6%Never married
- 28.2%Now married
- 0.0%Separated
- 5.0%Widowed
- 17.2%Divorced
Women who did not give birth in the past 12 months
| Now married: | 30.0% (99) |
| Unmarried: | 70.0% (232) |
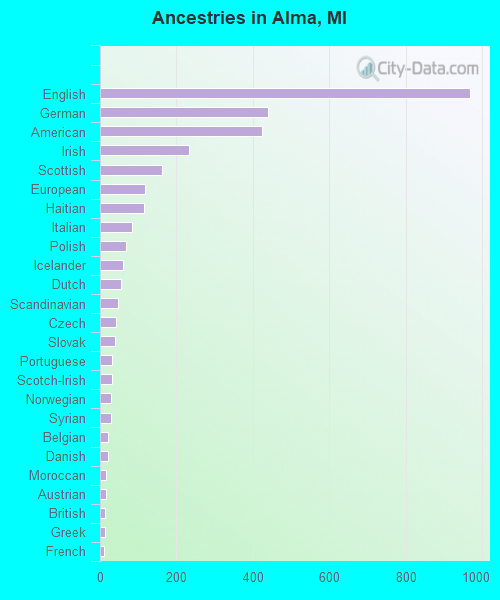
Ancestries in Alma

- 96924.5%English
- 44011.1%German
- 42310.7%American
- 2335.9%Irish
- 1614.1%Scottish
- 1193.0%European
- 1162.9%Haitian
- 832.1%Italian
- 671.7%Polish
- 591.5%Icelander
- 561.4%Dutch
- 481.2%Scandinavian
- 421.1%Czech
- 401.0%Slovak
- 320.8%Portuguese
- 310.8%Scotch-Irish
- 300.8%Norwegian
- 280.7%Syrian
- 210.5%Belgian
- 210.5%Danish
- 160.4%Moroccan
- 160.4%Austrian
- 120.3%British
- 120.3%Greek
- 110.3%French
- 100.3%Canadian
- 60.2%Jamaican
- 40.1%Czechoslovakian
- 40.1%French Canadian
- 30.08%Swedish
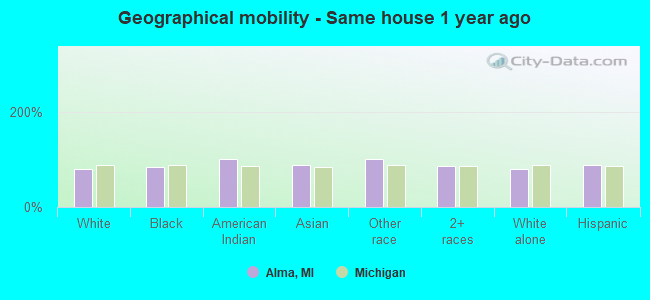
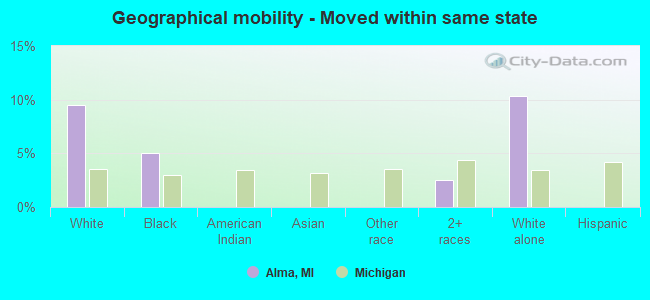
Geographical mobility in Alma

- Same house 1 year ago
- 6,59479.3%White (Caucasian)
- 18283.9%Black or African American
- 19100.0%American Indian / Alaska Native
- 16088.8%Asian
- 164100.0%Other race
- 29685.9%Two or more races
- 6,04678.7%White alone, not Hispanic / Latino
- 93887.0%Hispanic or Latino
-
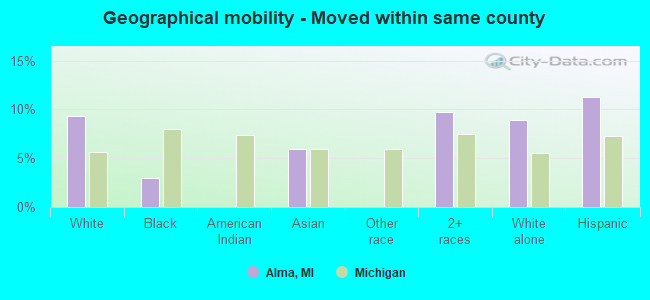
- Moved within same county
- 7759.3%White / Caucasian
- 62.9%Black or African American
- 116.0%Asian
- 339.7%Two or more races
- 6878.9%White alone, not Hispanic / Latino
- 12211.3%Hispanic or Latino
-
- Moved within same state
- 7879.5%White / Caucasian
- 115.1%Black or African American
- 92.5%Two or more races
- 79110.3%White alone, not Hispanic / Latino
-
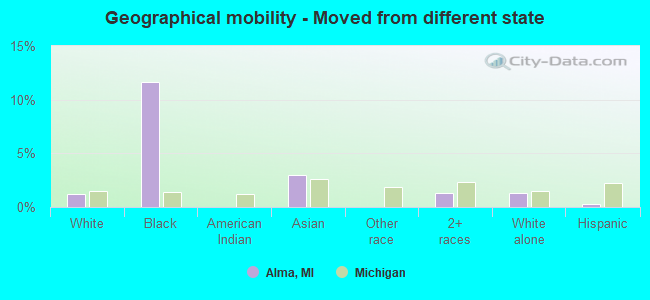
- Moved from different state
- 1011.2%White / Caucasian
- 2511.6%Black or African American
- 53.0%Asian
- 41.3%Two or more races
- 1021.3%White alone, not Hispanic / Latino
- 30.3%Hispanic or Latino
-
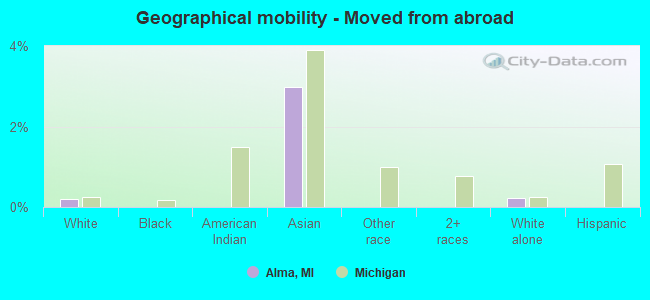
- Moved from abroad
- 160.2%White
- 53.0%Asian
- 170.2%White alone, not Hispanic / Latino
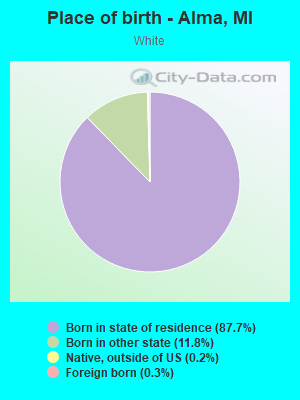
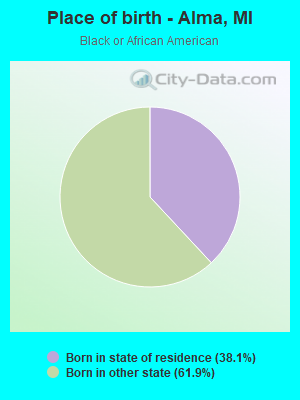
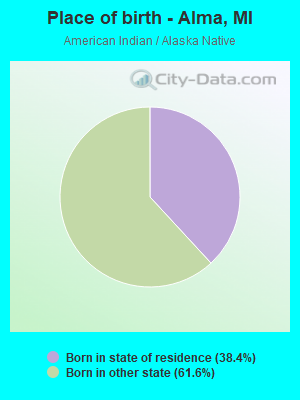
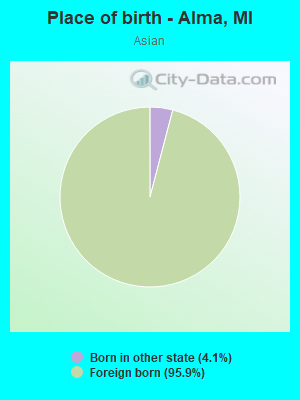
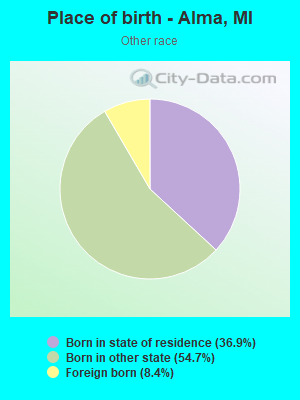
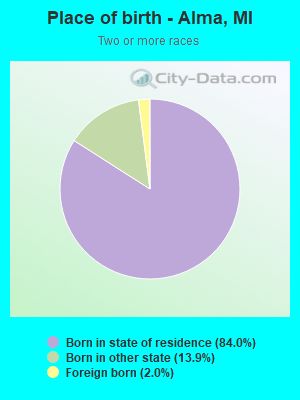
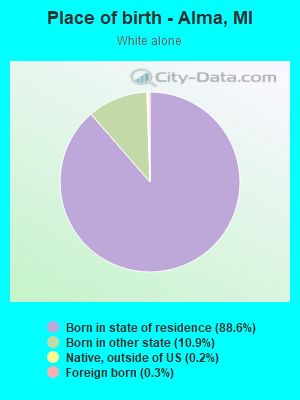
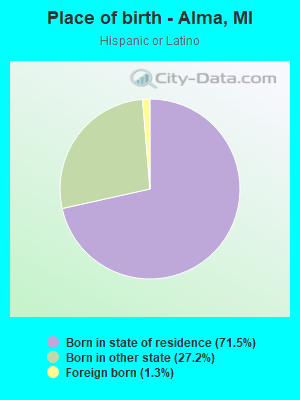
Children Nativity (place of birth) in Alma
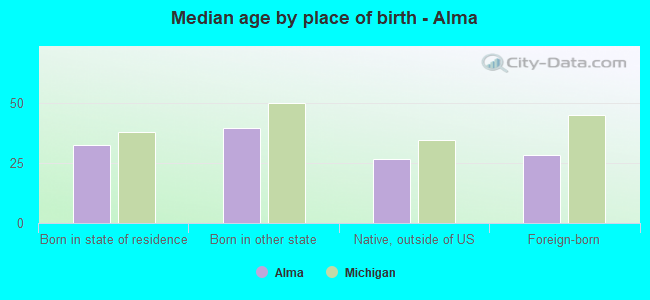
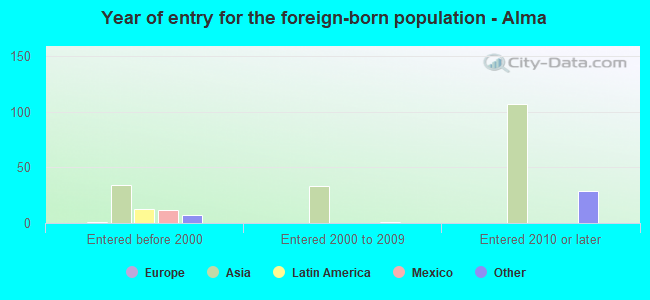
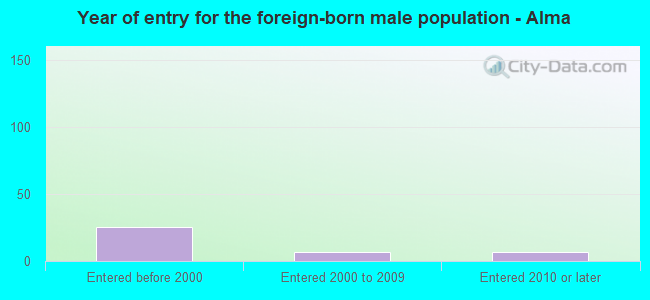
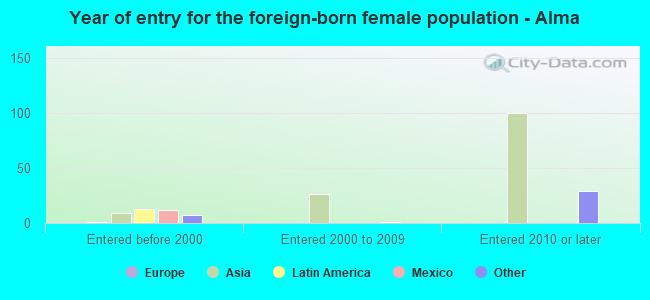
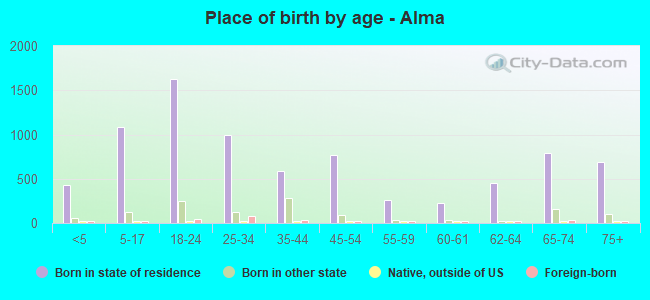
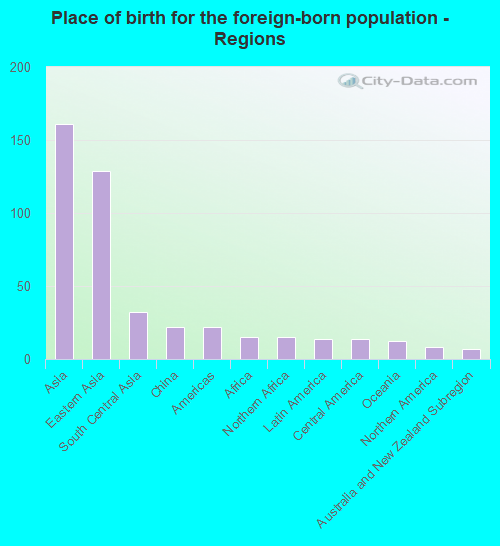
Place of birth for residents in Alma
![Place of birth for the foreign-born population - Regions]()
- 161Asia
- 129Eastern Asia
- 32South Central Asia
- 22China
- 22Americas
- 15Africa
- 15Northern Africa
- 14Latin America
- 14Central America
- 12Oceania
- 8Northern America
- 7Australia and New Zealand Subregion
- 1Europe
- 1Northern Europe
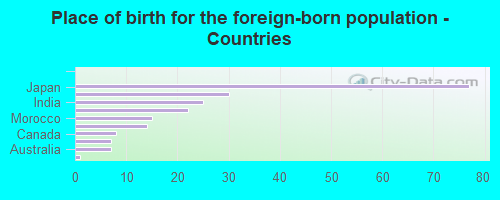
![Place of birth for the foreign-born population - Countries]()
- 77Japan
- 30Korea
- 25India
- 22China
- 15Morocco
- 14Mexico
- 8Canada
- 7Sri Lanka
- 7Australia
- 1Ireland
Grandparents responsible for own grandchildren in Alma
Zip codes: 48801.