Races in Beaumont, Texas (TX) Detailed Stats
Data:
Races - White alone (%)
Races - White alone (% change since 2000)
Races - Black alone (%)
Races - Black alone (% change since 2000)
Races - American Indian alone (%)
Races - American Indian alone (% change since 2000)
Races - Asian alone (%)
Races - Asian alone (% change since 2000)
Races - Hispanic (%)
Races - Hispanic (% change since 2000)
Races - Native Hawaiian and Other Pacific Islander alone (%)
Races - Native Hawaiian and Other Pacific Islander alone (% change since 2000)
Races - Two or more races(%)
Races - Two or more races(% change since 2000)
Races - Other race alone (%)
Races - Other race alone (% change since 2000)
Racial diversity
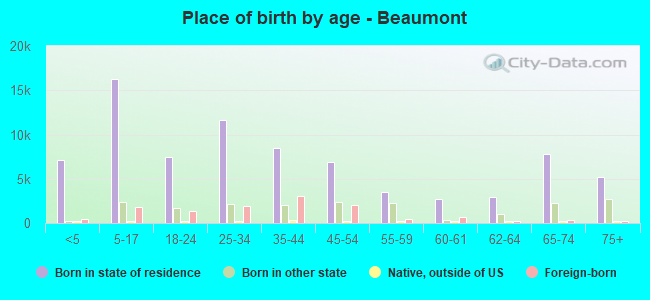
Place of birth - Born in state of residence (%)
Place of birth - Born in state of residence (%) - White
Place of birth - Born in state of residence (%) - Black or African American
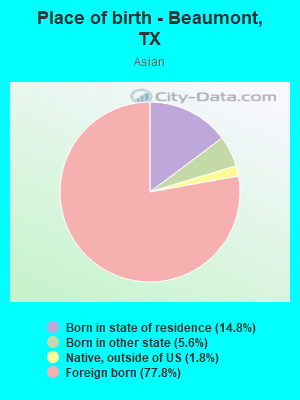
Place of birth - Born in state of residence (%) - Asian
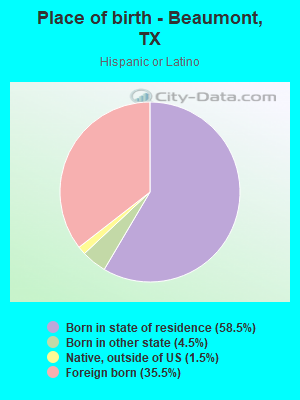
Place of birth - Born in state of residence (%) - Hispanic or Latino
Place of birth - Born in state of residence (%) - American Indian and Alaska Native
Place of birth - Born in state of residence (%) - Multirace
Place of birth - Born in state of residence (%) - Other Race
Place of birth - Born in other state (%)
Place of birth - Born in other state (%) - White
Place of birth - Born in other state (%) - Black or African American
Place of birth - Born in other state (%) - Asian
Place of birth - Born in other state (%) - Hispanic or Latino
Place of birth - Born in other state (%) - American Indian and Alaska Native
Place of birth - Born in other state (%) - Multirace
Place of birth - Born in other state (%) - Other Race
Place of birth - Native, outside of US (%)
Place of birth - Native, outside of US (%) - White
Place of birth - Native, outside of US (%) - Black or African American
Place of birth - Native, outside of US (%) - Asian
Place of birth - Native, outside of US (%) - Hispanic or Latino
Place of birth - Native, outside of US (%) - American Indian and Alaska Native
Place of birth - Native, outside of US (%) - Multirace
Place of birth - Native, outside of US (%) - Other Race
Place of birth - Foreign born (%)
Place of birth - Foreign born (%) - White
Place of birth - Foreign born (%) - Black or African American
Place of birth - Foreign born (%) - Asian
Place of birth - Foreign born (%) - Hispanic or Latino
Place of birth - Foreign born (%) - American Indian and Alaska Native
Place of birth - Foreign born (%) - Multirace
Place of birth - Foreign born (%) - Other Race
Residents speaking English at home (%)
Residents speaking English at home - Born in the United States (%)
Residents speaking English at home - Native, born elsewhere (%)
Residents speaking English at home - Foreign born (%)
Residents speaking Spanish at home (%)
Residents speaking Spanish at home - Born in the United States (%)
Residents speaking Spanish at home - Native, born elsewhere (%)
Residents speaking Spanish at home - Foreign born (%)
Residents speaking other language at home (%)
Residents speaking other language at home - Born in the United States (%)
Residents speaking other language at home - Native, born elsewhere (%)
Residents speaking other language at home - Foreign born (%)
Marital status - Never married (%)
Marital status - Now married (%)
Marital status - Separated (%)
Marital status - Widowed (%)
Marital status - Divorced (%)
Ancestries Reported - Arab (%)
Ancestries Reported - Czech (%)
Ancestries Reported - Danish (%)
Ancestries Reported - Dutch (%)
Ancestries Reported - English (%)
Ancestries Reported - French (%)
Ancestries Reported - French Canadian (%)
Ancestries Reported - German (%)
Ancestries Reported - Greek (%)
Ancestries Reported - Hungarian (%)
Ancestries Reported - Irish (%)
Ancestries Reported - Italian (%)
Ancestries Reported - Lithuanian (%)
Ancestries Reported - Norwegian (%)
Ancestries Reported - Polish (%)
Ancestries Reported - Portuguese (%)
Ancestries Reported - Russian (%)
Ancestries Reported - Scotch-Irish (%)
Ancestries Reported - Scottish (%)
Ancestries Reported - Slovak (%)
Ancestries Reported - Subsaharan African (%)
Ancestries Reported - Swedish (%)
Ancestries Reported - Swiss (%)
Ancestries Reported - Ukrainian (%)
Ancestries Reported - United States (%)
Ancestries Reported - Welsh (%)
Ancestries Reported - West Indian (%)
Ancestries Reported - Other (%)
Geographical mobility - Same house 1 year ago (%)
Geographical mobility - Same house 1 year ago (%) - White
Geographical mobility - Same house 1 year ago (%) - Black or African American
Geographical mobility - Same house 1 year ago (%) - Asian
Geographical mobility - Same house 1 year ago (%) - Hispanic or Latino
Geographical mobility - Same house 1 year ago (%) - American Indian and Alaska Native
Geographical mobility - Same house 1 year ago (%) - Multirace
Geographical mobility - Same house 1 year ago (%) - Other Race
Geographical mobility - Moved within same county (%)
Geographical mobility - Moved within same county (%) - White
Geographical mobility - Moved within same county (%) - Black or African American
Geographical mobility - Moved within same county (%) - Asian
Geographical mobility - Moved within same county (%) - Hispanic or Latino
Geographical mobility - Moved within same county (%) - American Indian and Alaska Native
Geographical mobility - Moved within same county (%) - Multirace
Geographical mobility - Moved within same county (%) - Other Race
Geographical mobility - Moved from different county within same state (%)
Geographical mobility - Moved from different county within same state (%) - White
Geographical mobility - Moved from different county within same state (%) - Black or African American
Geographical mobility - Moved from different county within same state (%) - Asian
Geographical mobility - Moved from different county within same state (%) - Hispanic or Latino
Geographical mobility - Moved from different county within same state (%) - American Indian and Alaska Native
Geographical mobility - Moved from different county within same state (%) - Multirace
Geographical mobility - Moved from different county within same state (%) - Other Race
Geographical mobility - Moved from different state (%)
Geographical mobility - Moved from different state (%) - White
Geographical mobility - Moved from different state (%) - Black or African American
Geographical mobility - Moved from different state (%) - Asian
Geographical mobility - Moved from different state (%) - Hispanic or Latino
Geographical mobility - Moved from different state (%) - American Indian and Alaska Native
Geographical mobility - Moved from different state (%) - Multirace
Geographical mobility - Moved from different state (%) - Other Race
Geographical mobility - Moved from abroad (%)
Geographical mobility - Moved from abroad (%) - White
Geographical mobility - Moved from abroad (%) - Black or African American
Geographical mobility - Moved from abroad (%) - Asian
Geographical mobility - Moved from abroad (%) - Hispanic or Latino
Geographical mobility - Moved from abroad (%) - American Indian and Alaska Native
Geographical mobility - Moved from abroad (%) - Multirace
Geographical mobility - Moved from abroad (%) - Other Race
Place of birth for the foreign-born population - Ireland (%)
Place of birth for the foreign-born population - Denmark (%)
Place of birth for the foreign-born population - Norway (%)
Place of birth for the foreign-born population - Sweden (%)
Place of birth for the foreign-born population - United Kingdom (%)
Place of birth for the foreign-born population - England (%)
Place of birth for the foreign-born population - Scotland (%)
Place of birth for the foreign-born population - Other Northern Europe (%)
Place of birth for the foreign-born population - Austria (%)
Place of birth for the foreign-born population - Belgium (%)
Place of birth for the foreign-born population - France (%)
Place of birth for the foreign-born population - Germany (%)
Place of birth for the foreign-born population - Netherlands (%)
Place of birth for the foreign-born population - Switzerland (%)
Place of birth for the foreign-born population - Other Western Europe (%)
Place of birth for the foreign-born population - Greece (%)
Place of birth for the foreign-born population - Italy (%)
Place of birth for the foreign-born population - Portugal (%)
Place of birth for the foreign-born population - Spain (%)
Place of birth for the foreign-born population - Other Southern Europe (%)
Place of birth for the foreign-born population - Albania (%)
Place of birth for the foreign-born population - Belarus (%)
Place of birth for the foreign-born population - Bosnia and Herzegovina (%)
Place of birth for the foreign-born population - Bulgaria (%)
Place of birth for the foreign-born population - Croatia (%)
Place of birth for the foreign-born population - Czechoslovakia (%)
Place of birth for the foreign-born population - Hungary (%)
Place of birth for the foreign-born population - Latvia (%)
Place of birth for the foreign-born population - Lithuania (%)
Place of birth for the foreign-born population - North Macedonia (Macedonia) (%)
Place of birth for the foreign-born population - Moldova (%)
Place of birth for the foreign-born population - Poland (%)
Place of birth for the foreign-born population - Romania (%)
Place of birth for the foreign-born population - Russia (%)
Place of birth for the foreign-born population - Serbia (%)
Place of birth for the foreign-born population - Ukraine (%)
Place of birth for the foreign-born population - Other Eastern Europe (%)
Place of birth for the foreign-born population - China (%)
Place of birth for the foreign-born population - Hong Kong (%)
Place of birth for the foreign-born population - Taiwan (%)
Place of birth for the foreign-born population - Japan (%)
Place of birth for the foreign-born population - Korea (%)
Place of birth for the foreign-born population - Other Eastern Asia (%)
Place of birth for the foreign-born population - Afghanistan (%)
Place of birth for the foreign-born population - Bangladesh (%)
Place of birth for the foreign-born population - India (%)
Place of birth for the foreign-born population - Iran (%)
Place of birth for the foreign-born population - Kazakhstan (%)
Place of birth for the foreign-born population - Nepal (%)
Place of birth for the foreign-born population - Pakistan (%)
Place of birth for the foreign-born population - Sri Lanka (%)
Place of birth for the foreign-born population - Uzbekistan (%)
Place of birth for the foreign-born population - Other South Central Asia (%)
Place of birth for the foreign-born population - Burma (%)
Place of birth for the foreign-born population - Cambodia (%)
Place of birth for the foreign-born population - Indonesia (%)
Place of birth for the foreign-born population - Laos (%)
Place of birth for the foreign-born population - Malaysia (%)
Place of birth for the foreign-born population - Philippines (%)
Place of birth for the foreign-born population - Singapore (%)
Place of birth for the foreign-born population - Thailand (%)
Place of birth for the foreign-born population - Vietnam (%)
Place of birth for the foreign-born population - Other South Eastern Asia (%)
Place of birth for the foreign-born population - Armenia (%)
Place of birth for the foreign-born population - Iraq (%)
Place of birth for the foreign-born population - Israel (%)
Place of birth for the foreign-born population - Jordan (%)
Place of birth for the foreign-born population - Kuwait (%)
Place of birth for the foreign-born population - Lebanon (%)
Place of birth for the foreign-born population - Saudi Arabia (%)
Place of birth for the foreign-born population - Syria (%)
Place of birth for the foreign-born population - Turkey (%)
Place of birth for the foreign-born population - Yemen (%)
Place of birth for the foreign-born population - Other Western Asia (%)
Place of birth for the foreign-born population - Eritrea (%)
Place of birth for the foreign-born population - Ethiopia (%)
Place of birth for the foreign-born population - Kenya (%)
Place of birth for the foreign-born population - Somalia (%)
Place of birth for the foreign-born population - Uganda (%)
Place of birth for the foreign-born population - Zimbabwe (%)
Place of birth for the foreign-born population - Other Eastern Africa (%)
Place of birth for the foreign-born population - Cameroon (%)
Place of birth for the foreign-born population - Congo (%)
Place of birth for the foreign-born population - Democratic Republic of Congo (Zaire) (%)
Place of birth for the foreign-born population - Other Middle Africa (%)
Place of birth for the foreign-born population - Egypt (%)
Place of birth for the foreign-born population - Morocco (%)
Place of birth for the foreign-born population - Sudan (%)
Place of birth for the foreign-born population - Other Northern Africa (%)
Place of birth for the foreign-born population - South Africa (%)
Place of birth for the foreign-born population - Other Southern Africa (%)
Place of birth for the foreign-born population - Cabo Verde (%)
Place of birth for the foreign-born population - Ghana (%)
Place of birth for the foreign-born population - Liberia (%)
Place of birth for the foreign-born population - Nigeria (%)
Place of birth for the foreign-born population - Senegal (%)
Place of birth for the foreign-born population - Sierra Leone (%)
Place of birth for the foreign-born population - Other Western Africa (%)
Place of birth for the foreign-born population - Australia (%)
Place of birth for the foreign-born population - New Zealand (%)
Place of birth for the foreign-born population - Fiji (%)
Place of birth for the foreign-born population - Micronesia (%)
Place of birth for the foreign-born population - Bahamas (%)
Place of birth for the foreign-born population - Barbados (%)
Place of birth for the foreign-born population - Cuba (%)
Place of birth for the foreign-born population - Dominica (%)
Place of birth for the foreign-born population - Dominican Republic (%)
Place of birth for the foreign-born population - Grenada (%)
Place of birth for the foreign-born population - Haiti (%)
Place of birth for the foreign-born population - Jamaica (%)
Place of birth for the foreign-born population - St. Vincent and the Grenadines (%)
Place of birth for the foreign-born population - Trinidad and Tobago (%)
Place of birth for the foreign-born population - West Indies (%)
Place of birth for the foreign-born population - Other Caribbean (%)
Place of birth for the foreign-born population - Belize (%)
Place of birth for the foreign-born population - Costa Rica (%)
Place of birth for the foreign-born population - El Salvador (%)
Place of birth for the foreign-born population - Guatemala (%)
Place of birth for the foreign-born population - Honduras (%)
Place of birth for the foreign-born population - Mexico (%)
Place of birth for the foreign-born population - Nicaragua (%)
Place of birth for the foreign-born population - Panama (%)
Place of birth for the foreign-born population - Other Central America (%)
Place of birth for the foreign-born population - Argentina (%)
Place of birth for the foreign-born population - Bolivia (%)
Place of birth for the foreign-born population - Brazil (%)
Place of birth for the foreign-born population - Chile (%)
Place of birth for the foreign-born population - Colombia (%)
Place of birth for the foreign-born population - Ecuador (%)
Place of birth for the foreign-born population - Guyana (%)
Place of birth for the foreign-born population - Peru (%)
Place of birth for the foreign-born population - Uruguay (%)
Place of birth for the foreign-born population - Venezuela (%)
Place of birth for the foreign-born population - Other South America (%)
Place of birth for the foreign-born population - Canada (%)
Place of birth for the foreign-born population - Other Northern America (%)
Place of birth for the foreign-born population - Other (%)
Latest news about races in Beaumont, TX collected exclusively by city-data.com from local newspapers, TV, and radio stations
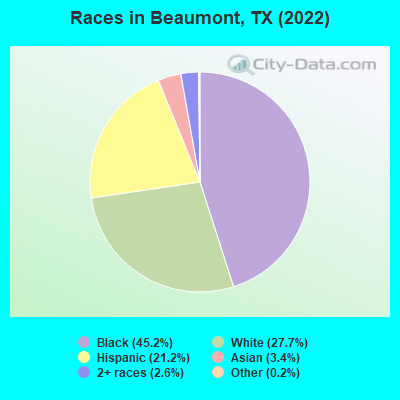
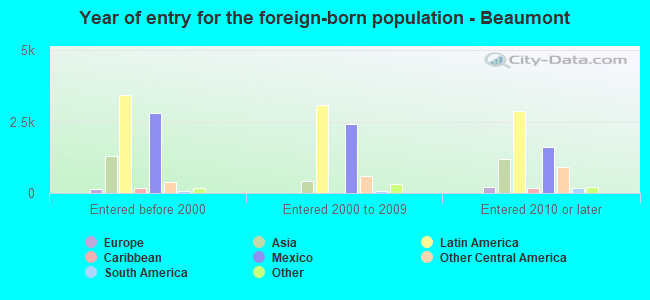
According to 2022 data, the most numerous races in Beaumont, TX are Hispanic (23,943 residents), White alone (31,191 residents), and Black alone (50,950 residents). 79.7% of Beaumont residents speak English at home. 11.8% of Beaumont, TX residents are foreign-born (7.9% born in Latin America, 2.4% born in Asia), which is 43.7% less than the foreign-born rate of 17.0% across the entire state of Texas.
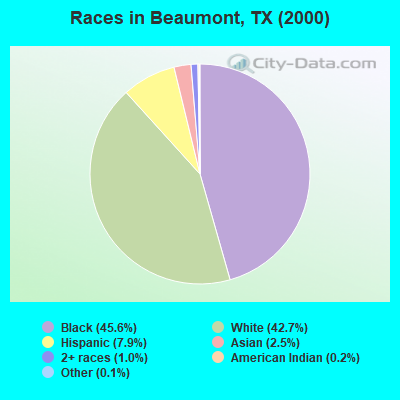
Race distribution in Beaumont
2000 2022
51,928 45.6% Black alone 48,595 42.7% White alone 9,028 7.9% Hispanic 2,808 2.5% Asian alone 1,130 1.0% Two or more races 223 0.2% American Indian alone 118 0.1% Other race alone 36 0.03% Native Hawaiian and Other
50,950 45.2% Black alone 31,191 27.7% White alone 23,943 21.2% Hispanic 3,835 3.4% Asian alone 2,890 2.6% Two or more races 215 0.2% Other race alone 36 0.03% American Indian alone 17 0.02% Native Hawaiian and Other
2000 2022
10,933,313 52.4% White alone 6,669,666 32.0% Hispanic 2,364,255 11.3% Black alone 554,445 2.7% Asian alone 230,567 1.1% Two or more races 68,859 0.3% American Indian alone 19,958 0.10% Other race alone 10,757 0.05% Native Hawaiian and Other
12,070,642 40.2% Hispanic 11,683,430 38.9% White alone 3,508,706 11.7% Black alone 1,608,173 5.4% Asian alone 956,560 3.2% Two or more races 125,763 0.4% Other race alone 47,023 0.2% American Indian alone 29,275 0.10% Native Hawaiian and Other
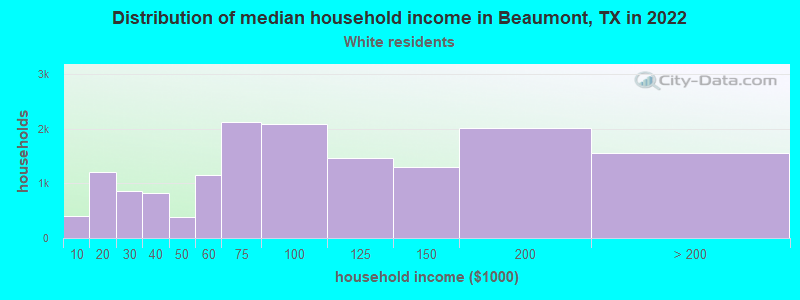
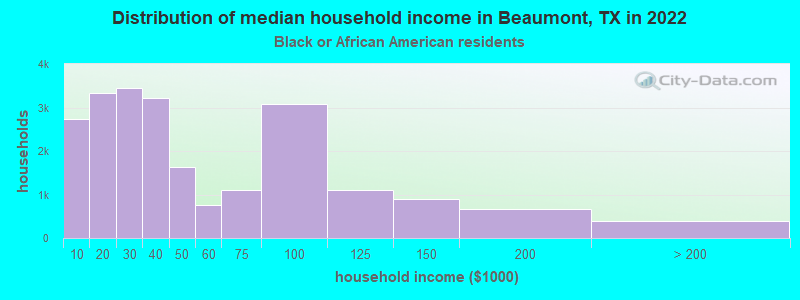
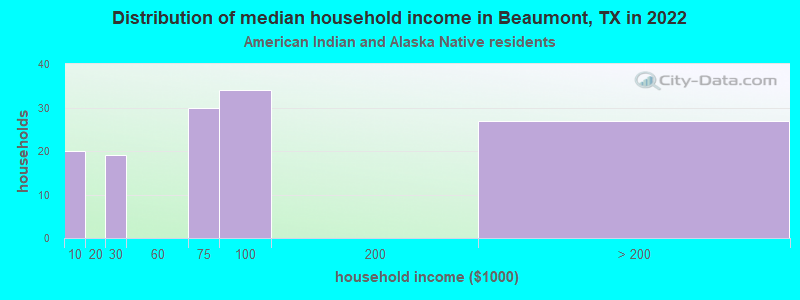
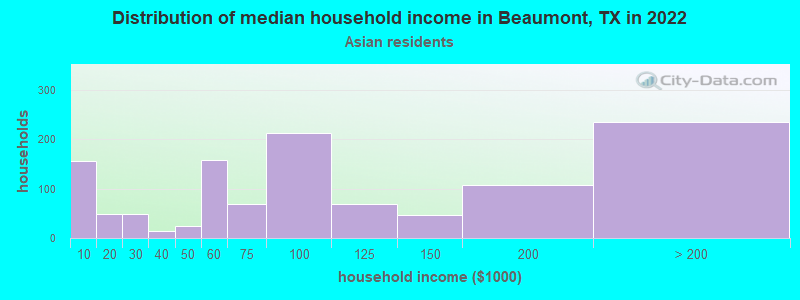
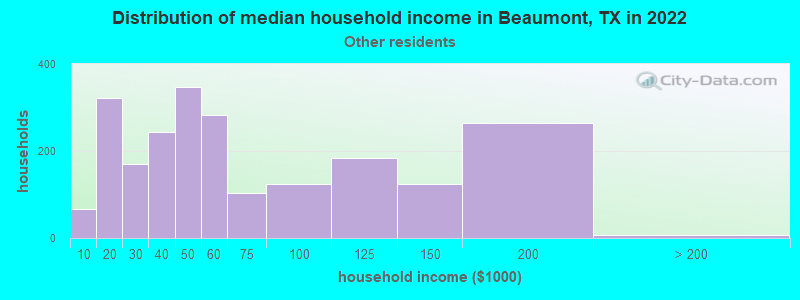
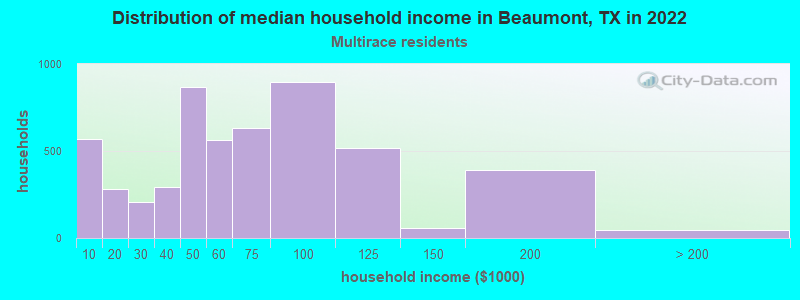
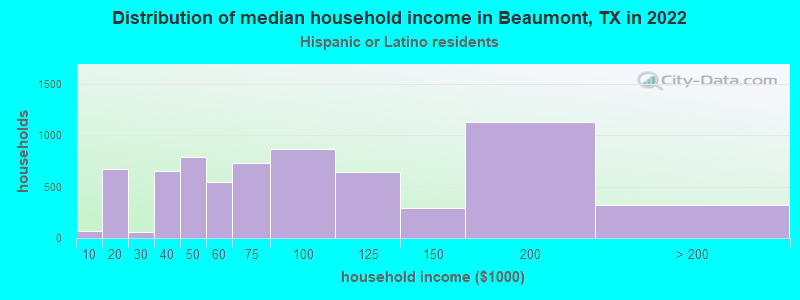
Income and house value in Beaumont Median household income in 2022 $90,299 White non-Hispanic householders$34,623 Black householders$82,959 Asian householders$66,773 Some other race householders$61,068 Two or more races householders$73,146 Hispanic or Latino race householdersMedian 2022 house value $191,661 White Non-Hispanic householders$98,506 Black or African American householders$150,556 American Indian or Alaska Native householders $168,069 Asian householders$66,887 Native Hawaiian and other Pacific Islander householders$103,127 Some other race householders$125,018 Two or more races householders$99,479 Hispanic or Latino householders
Median age by race in Beaumont
50.3 Median age for White residents48.7 51.4 35.3 Median age for Black or African American residents32.3 38.9 -666,666,666.0 Median age for American Indian / Alaska Native residents-666,666,666.0 -666,666,666.0 31.5 Median age for Asian residents32.5 31.1 -666,666,666.0 Median age for Native Hawaiian / Pacific Islander residents-666,666,666.0 -666,666,666.0 24.3 Median age for Other race residents27.8 20.4 30.3 Median age for Two or more races residents28.4 31.0 53.1 Median age for White alone residents52.6 53.4 23.8 Median age for Hispanic or Latino residents23.5 24.2
Owner/renter occupied households by race in Beaumont
House owners and renters - White residents 10,042 65.3% Owner occupied5,345 34.7% Renter occupiedHouse owners and renters - Black or African American residents 10,404 46.5% Owner occupied11,959 53.5% Renter occupiedHouse owners and renters - American Indian / Alaska Native residents 101 73.9% Owner occupied35 26.1% Renter occupiedHouse owners and renters - Asian residents 494 69.3% Owner occupied219 30.7% Renter occupiedHouse owners and renters - Native Hawaiian / Pacific Islander residents 6 100.0% Owner occupiedHouse owners and renters - Other race residents 1,409 58.0% Owner occupied1,020 42.0% Renter occupiedHouse owners and renters - Two or more races residents 3,668 74.1% Owner occupied1,283 25.9% Renter occupiedHouse owners and renters - White alone residents 9,735 68.3% Owner occupied4,528 31.7% Renter occupiedHouse owners and renters - Hispanic or Latino residents 4,404 64.9% Owner occupied2,384 35.1% Renter occupied
Language usage in Beaumont
English speakers - Total 79.7% of residents of Beaumont speak English at home.
16.6% of residents speak Spanish at home 10,284 59.2% Speak English very well7,087 40.8% Speak English less than very well3.7% of residents speak other language at home 3,057 79.1% Speak English very well807 20.9% Speak English less than very well
English speakers - Born in the United States 94.6% of residents of Beaumont speak English at home.
2.3% of residents speak Spanish at home 293 67.7% Speak English very well140 32.3% Speak English less than very well3.1% of residents speak other language at home 548 92.7% Speak English very well43 7.3% Speak English less than very well
English speakers - Native, born elsewhere 40.7% of residents of Beaumont speak English at home.
59.3% of residents speak Spanish at home 259 59.5% Speak English very well176 40.5% Speak English less than very well
English speakers - Foreign-born 10.8% of residents of Beaumont speak English at home.
66.0% of residents speak Spanish at home 2,772 35.5% Speak English very well5,041 64.5% Speak English less than very well23.2% of residents speak other language at home 1,980 72.2% Speak English very well764 27.8% Speak English less than very well
White (Caucasian) - Speak only English Native:
94.3% (30,221)Foreign-born:
26.8% (312)
White (Caucasian) - Speak another language Native:
5.7% (1,822)Foreign-born:
73.2% (854)
Black or African American - Speak only English Native:
99.1% (48,392)Foreign-born:
34.6% (190)
Black or African American - Speak another language Native:
0.9% (431)Foreign-born:
65.0% (358)
American Indian / Alaska Native - Speak another language Native:
21.0% (25)Foreign-born:
98.9% (23)
Asian - Speak only English Native:
61.9% (336)Foreign-born:
14.2% (274)
Asian - Speak another language Native:
38.1% (207)Foreign-born:
85.8% (1,660)
Other race - Speak only English Native:
16.1% (729)Foreign-born:
12.0% (571)
Other race - Speak another language Native:
83.9% (3,800)Foreign-born:
88.0% (4,168)
Two or more races - Speak only English Native:
55.8% (5,398)Foreign-born:
3.2% (115)
Two or more races - Speak another language Native:
44.2% (4,275)Foreign-born:
96.8% (3,535)
White alone - Speak only English Native:
98.6% (28,944)Foreign-born:
26.4% (178)
White alone - Speak another language Native:
1.4% (407)Foreign-born:
74.0% (497)
Hispanic or Latino - Speak only English Native:
32.9% (4,523)Foreign-born:
9.3% (805)
Hispanic or Latino - Speak another language Native:
67.1% (9,218)Foreign-born:
90.7% (7,813)
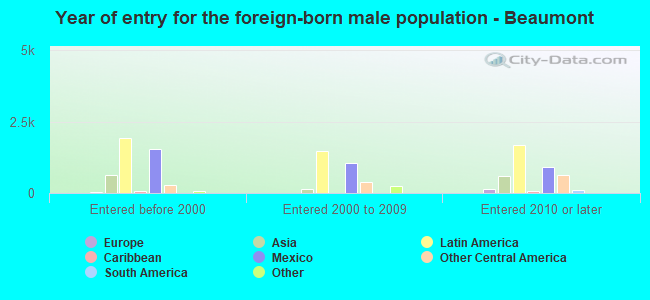
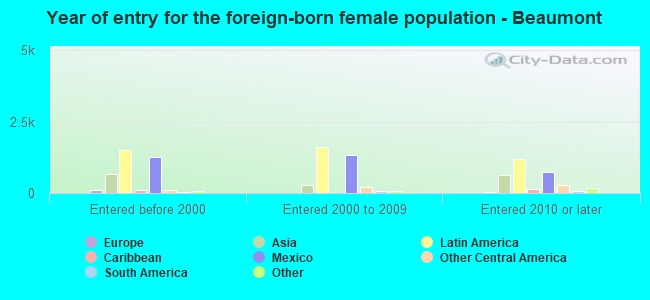
Foreign-born residents in Beaumont 13,336 residents are foreign born (7.9% Latin America , 2.4% Asia ).
This city:
11.8%Texas:
17.1%
Marital status for residents in Beaumont Marital status - White (Caucasian) population 15 years and over
Males 25.5% Never married59.6% Now married2.3% Separated4.5% Widowed8.2% DivorcedFemales 16.4% Never married59.0% Now married0.0% Separated7.5% Widowed17.1% DivorcedWomen who gave birth in the past 12 months Now married:
15.9% (104)Unmarried:
84.1% (550)
Women who did not give birth in the past 12 months Now married:
50.9% (3,122)Unmarried:
49.1% (3,013)
Marital status - Black or African American population 15 years and over
Males 51.9% Never married33.2% Now married2.5% Separated1.8% Widowed10.5% DivorcedFemales 48.1% Never married33.0% Now married0.5% Separated9.5% Widowed8.9% DivorcedWomen who gave birth in the past 12 months Now married:
10.3% (46)Unmarried:
89.7% (402)
Women who did not give birth in the past 12 months Now married:
21.7% (2,466)Unmarried:
78.3% (8,920)
Marital status - American Indian / Alaska Native population 15 years and over
Males 0.0% Never married100.0% Now married0.0% Separated0.0% Widowed0.0% DivorcedFemales 12.7% Never married41.3% Now married0.0% Separated0.0% Widowed46.0% DivorcedWomen who did not give birth in the past 12 months Now married:
57.7% (22)Unmarried:
42.3% (16)
Marital status - Asian population 15 years and over
Males 40.9% Never married53.3% Now married0.0% Separated3.1% Widowed2.7% DivorcedFemales 28.0% Never married62.7% Now married0.0% Separated7.2% Widowed2.1% DivorcedWomen who gave birth in the past 12 months Now married:
100.0% (69)Unmarried:
0.0% (0)
Women who did not give birth in the past 12 months Now married:
58.8% (587)Unmarried:
41.2% (410)
Marital status - Other race population 15 years and over
Males 34.2% Never married60.4% Now married0.6% Separated1.6% Widowed3.2% DivorcedFemales 32.8% Never married55.3% Now married1.1% Separated4.8% Widowed6.0% DivorcedWomen who gave birth in the past 12 months Now married:
100.0% (193)Unmarried:
0.0% (0)
Women who did not give birth in the past 12 months Now married:
52.0% (1,179)Unmarried:
48.0% (1,086)
Marital status - Two or more races population 15 years and over
Males 35.0% Never married48.9% Now married0.0% Separated1.2% Widowed14.9% DivorcedFemales 20.6% Never married56.6% Now married3.6% Separated1.1% Widowed18.1% DivorcedWomen who gave birth in the past 12 months Now married:
37.0% (46)Unmarried:
63.0% (78)
Women who did not give birth in the past 12 months Now married:
61.6% (2,302)Unmarried:
38.4% (1,436)
Marital status - White alone, not Hispanic / Latino population 15 years and over
Males 19.9% Never married64.6% Now married2.6% Separated5.0% Widowed7.9% DivorcedFemales 14.2% Never married59.6% Now married0.0% Separated8.0% Widowed18.2% DivorcedWomen who gave birth in the past 12 months Now married:
14.7% (80)Unmarried:
85.3% (466)
Women who did not give birth in the past 12 months Now married:
50.9% (2,736)Unmarried:
49.1% (2,639)
Marital status - Hispanic or Latino population 15 years and over
Males 40.3% Never married54.0% Now married0.0% Separated1.7% Widowed4.0% DivorcedFemales 32.0% Never married61.1% Now married2.2% Separated0.0% Widowed4.6% DivorcedWomen who gave birth in the past 12 months Now married:
47.8% (77)Unmarried:
52.2% (84)
Women who did not give birth in the past 12 months Now married:
61.7% (3,874)Unmarried:
38.3% (2,401)
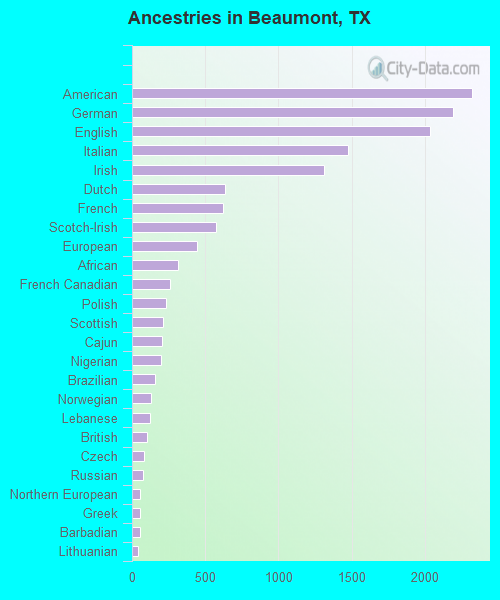
Ancestries in Beaumont
2,322 2.7% American2,195 2.6% German2,036 2.4% English1,475 1.7% Italian1,308 1.5% Irish635 0.7% Dutch619 0.7% French571 0.7% Scotch-Irish443 0.5% European313 0.4% African259 0.3% French Canadian232 0.3% Polish209 0.2% Scottish203 0.2% Cajun195 0.2% Nigerian155 0.2% Brazilian127 0.1% Norwegian120 0.1% Lebanese102 0.1% British84 0.10% Czech74 0.09% Russian54 0.06% Northern European54 0.06% Greek54 0.06% Barbadian42 0.05% Lithuanian40 0.05% Palestinian38 0.04% Arab37 0.04% Welsh36 0.04% Croatian36 0.04% Finnish32 0.04% Eastern European31 0.04% Belgian30 0.04% Jamaican26 0.03% Swedish25 0.03% Portuguese25 0.03% Slovene25 0.03% Canadian23 0.03% Haitian18 0.02% Hungarian18 0.02% Zimbabwean16 0.02% Iraqi15 0.02% Ukrainian14 0.02% Albanian11 0.01% Czechoslovakian10 0.01% British West Indian6 0.01% Kenyan6 0.01% Pennsylvania German5 0.01% Guyanese
Geographical mobility in Beaumont Same house 1 year ago 29,255 86.7% White (Caucasian)46,196 92.1% Black or African American134 89.5% American Indian / Alaska Native3,788 93.2% Asian21 98.2% Native Hawaiian / Pacific Islander6,867 86.9% Other race13,597 87.9% Two or more races27,119 88.0% White alone, not Hispanic / Latino21,389 87.3% Hispanic or LatinoMoved within same county 2,659 7.9% White / Caucasian2,342 4.7% Black or African American160 3.9% Asian744 9.4% Other race1,060 6.9% Two or more races2,215 7.2% White alone, not Hispanic / Latino2,098 8.6% Hispanic or LatinoMoved within same state 960 2.8% White / Caucasian1,645 3.3% Black or African American17 11.1% American Indian / Alaska Native15 0.4% Asian171 2.2% Other race695 4.5% Two or more races694 2.3% White alone, not Hispanic / Latino896 3.7% Hispanic or LatinoMoved from different state 863 2.6% White / Caucasian13 0.3% Asian74 0.9% Other race83 0.5% Two or more races783 2.5% White alone, not Hispanic / Latino80 0.3% Hispanic or LatinoMoved from abroad 7 0.0% White46 1.1% Asian34 0.2% Two or more races50 0.2% Hispanic or Latino
Children Nativity (place of birth) in Beaumont
Children under 6 years - Living with two parents Both parents native 1,695 100.0% NativeBoth parents foreign-born 608 46.9% Native689 53.1% Foreign-bornOne native, one foreign-born parent 223 100.0% NativeChildren under 6 years - Living with one parent Native parent 5,609 100.0% NativeForeign-born parent 284 100.0% NativeChildren 6 to 17 years - Living with two parents Both parents native 4,950 100.0% NativeBoth parents foreign-born 2,133 63.4% Native1,230 36.6% Foreign-bornOne native, one foreign-born parent 822 93.7% Native55 6.3% Foreign-bornChildren 6 to 17 years - Living with one parent Native parent 6,488 100.0% NativeForeign-born parent 829 58.9% Native578 41.1% Foreign-born
Grandparents responsible for own grandchildren in Beaumont
Grandparents (30 to 59 years) White / Caucasian 165 59.1% Responsible for grandchildren114 40.9% Not responsible for grandchildrenBlack or African American 182 48.1% Responsible for grandchildren196 51.9% Not responsible for grandchildrenOther race 94 100.0% Not responsible for grandchildrenTwo or more races 12 100.0% Not responsible for grandchildrenWhite alone, not Hispanic / Latino 169 48.6% Responsible for grandchildren179 51.4% Not responsible for grandchildrenHispanic or Latino 53 40.3% Responsible for grandchildren79 59.7% Not responsible for grandchildrenGrandparents (60 years and over) White / Caucasian 45 25.1% Responsible for grandchildren136 74.9% Not responsible for grandchildrenBlack or African American 307 47.2% Responsible for grandchildren345 52.8% Not responsible for grandchildrenOther race 105 100.0% Not responsible for grandchildrenTwo or more races 83 100.0% Responsible for grandchildrenWhite alone, not Hispanic / Latino 54 22.5% Responsible for grandchildren186 77.5% Not responsible for grandchildrenHispanic or Latino 14 13.7% Responsible for grandchildren91 86.3% Not responsible for grandchildren