Races in Centreville, Virginia (VA) Detailed Stats
Data:
Races - White alone (%)
Races - White alone (% change since 2000)
Races - Black alone (%)
Races - Black alone (% change since 2000)
Races - American Indian alone (%)
Races - American Indian alone (% change since 2000)
Races - Asian alone (%)
Races - Asian alone (% change since 2000)
Races - Hispanic (%)
Races - Hispanic (% change since 2000)
Races - Native Hawaiian and Other Pacific Islander alone (%)
Races - Native Hawaiian and Other Pacific Islander alone (% change since 2000)
Races - Two or more races(%)
Races - Two or more races(% change since 2000)
Races - Other race alone (%)
Races - Other race alone (% change since 2000)
Racial diversity
Place of birth - Born in state of residence (%)
Place of birth - Born in state of residence (%) - White
Place of birth - Born in state of residence (%) - Black or African American
Place of birth - Born in state of residence (%) - Asian
Place of birth - Born in state of residence (%) - Hispanic or Latino
Place of birth - Born in state of residence (%) - American Indian and Alaska Native
Place of birth - Born in state of residence (%) - Multirace
Place of birth - Born in state of residence (%) - Other Race
Place of birth - Born in other state (%)
Place of birth - Born in other state (%) - White
Place of birth - Born in other state (%) - Black or African American
Place of birth - Born in other state (%) - Asian
Place of birth - Born in other state (%) - Hispanic or Latino
Place of birth - Born in other state (%) - American Indian and Alaska Native
Place of birth - Born in other state (%) - Multirace
Place of birth - Born in other state (%) - Other Race
Place of birth - Native, outside of US (%)
Place of birth - Native, outside of US (%) - White
Place of birth - Native, outside of US (%) - Black or African American
Place of birth - Native, outside of US (%) - Asian
Place of birth - Native, outside of US (%) - Hispanic or Latino
Place of birth - Native, outside of US (%) - American Indian and Alaska Native
Place of birth - Native, outside of US (%) - Multirace
Place of birth - Native, outside of US (%) - Other Race
Place of birth - Foreign born (%)
Place of birth - Foreign born (%) - White
Place of birth - Foreign born (%) - Black or African American
Place of birth - Foreign born (%) - Asian
Place of birth - Foreign born (%) - Hispanic or Latino
Place of birth - Foreign born (%) - American Indian and Alaska Native
Place of birth - Foreign born (%) - Multirace
Place of birth - Foreign born (%) - Other Race
Residents speaking English at home (%)
Residents speaking English at home - Born in the United States (%)
Residents speaking English at home - Native, born elsewhere (%)
Residents speaking English at home - Foreign born (%)
Residents speaking Spanish at home (%)
Residents speaking Spanish at home - Born in the United States (%)
Residents speaking Spanish at home - Native, born elsewhere (%)
Residents speaking Spanish at home - Foreign born (%)
Residents speaking other language at home (%)
Residents speaking other language at home - Born in the United States (%)
Residents speaking other language at home - Native, born elsewhere (%)
Residents speaking other language at home - Foreign born (%)
Marital status - Never married (%)
Marital status - Now married (%)
Marital status - Separated (%)
Marital status - Widowed (%)
Marital status - Divorced (%)
Ancestries Reported - Arab (%)
Ancestries Reported - Czech (%)
Ancestries Reported - Danish (%)
Ancestries Reported - Dutch (%)
Ancestries Reported - English (%)
Ancestries Reported - French (%)
Ancestries Reported - French Canadian (%)
Ancestries Reported - German (%)
Ancestries Reported - Greek (%)
Ancestries Reported - Hungarian (%)
Ancestries Reported - Irish (%)
Ancestries Reported - Italian (%)
Ancestries Reported - Lithuanian (%)
Ancestries Reported - Norwegian (%)
Ancestries Reported - Polish (%)
Ancestries Reported - Portuguese (%)
Ancestries Reported - Russian (%)
Ancestries Reported - Scotch-Irish (%)
Ancestries Reported - Scottish (%)
Ancestries Reported - Slovak (%)
Ancestries Reported - Subsaharan African (%)
Ancestries Reported - Swedish (%)
Ancestries Reported - Swiss (%)
Ancestries Reported - Ukrainian (%)
Ancestries Reported - United States (%)
Ancestries Reported - Welsh (%)
Ancestries Reported - West Indian (%)
Ancestries Reported - Other (%)
Geographical mobility - Same house 1 year ago (%)
Geographical mobility - Same house 1 year ago (%) - White
Geographical mobility - Same house 1 year ago (%) - Black or African American
Geographical mobility - Same house 1 year ago (%) - Asian
Geographical mobility - Same house 1 year ago (%) - Hispanic or Latino
Geographical mobility - Same house 1 year ago (%) - American Indian and Alaska Native
Geographical mobility - Same house 1 year ago (%) - Multirace
Geographical mobility - Same house 1 year ago (%) - Other Race
Geographical mobility - Moved within same county (%)
Geographical mobility - Moved within same county (%) - White
Geographical mobility - Moved within same county (%) - Black or African American
Geographical mobility - Moved within same county (%) - Asian
Geographical mobility - Moved within same county (%) - Hispanic or Latino
Geographical mobility - Moved within same county (%) - American Indian and Alaska Native
Geographical mobility - Moved within same county (%) - Multirace
Geographical mobility - Moved within same county (%) - Other Race
Geographical mobility - Moved from different county within same state (%)
Geographical mobility - Moved from different county within same state (%) - White
Geographical mobility - Moved from different county within same state (%) - Black or African American
Geographical mobility - Moved from different county within same state (%) - Asian
Geographical mobility - Moved from different county within same state (%) - Hispanic or Latino
Geographical mobility - Moved from different county within same state (%) - American Indian and Alaska Native
Geographical mobility - Moved from different county within same state (%) - Multirace
Geographical mobility - Moved from different county within same state (%) - Other Race
Geographical mobility - Moved from different state (%)
Geographical mobility - Moved from different state (%) - White
Geographical mobility - Moved from different state (%) - Black or African American
Geographical mobility - Moved from different state (%) - Asian
Geographical mobility - Moved from different state (%) - Hispanic or Latino
Geographical mobility - Moved from different state (%) - American Indian and Alaska Native
Geographical mobility - Moved from different state (%) - Multirace
Geographical mobility - Moved from different state (%) - Other Race
Geographical mobility - Moved from abroad (%)
Geographical mobility - Moved from abroad (%) - White
Geographical mobility - Moved from abroad (%) - Black or African American
Geographical mobility - Moved from abroad (%) - Asian
Geographical mobility - Moved from abroad (%) - Hispanic or Latino
Geographical mobility - Moved from abroad (%) - American Indian and Alaska Native
Geographical mobility - Moved from abroad (%) - Multirace
Geographical mobility - Moved from abroad (%) - Other Race
Place of birth for the foreign-born population - Ireland (%)
Place of birth for the foreign-born population - Denmark (%)
Place of birth for the foreign-born population - Norway (%)
Place of birth for the foreign-born population - Sweden (%)
Place of birth for the foreign-born population - United Kingdom (%)
Place of birth for the foreign-born population - England (%)
Place of birth for the foreign-born population - Scotland (%)
Place of birth for the foreign-born population - Other Northern Europe (%)
Place of birth for the foreign-born population - Austria (%)
Place of birth for the foreign-born population - Belgium (%)
Place of birth for the foreign-born population - France (%)
Place of birth for the foreign-born population - Germany (%)
Place of birth for the foreign-born population - Netherlands (%)
Place of birth for the foreign-born population - Switzerland (%)
Place of birth for the foreign-born population - Other Western Europe (%)
Place of birth for the foreign-born population - Greece (%)
Place of birth for the foreign-born population - Italy (%)
Place of birth for the foreign-born population - Portugal (%)
Place of birth for the foreign-born population - Spain (%)
Place of birth for the foreign-born population - Other Southern Europe (%)
Place of birth for the foreign-born population - Albania (%)
Place of birth for the foreign-born population - Belarus (%)
Place of birth for the foreign-born population - Bosnia and Herzegovina (%)
Place of birth for the foreign-born population - Bulgaria (%)
Place of birth for the foreign-born population - Croatia (%)
Place of birth for the foreign-born population - Czechoslovakia (%)
Place of birth for the foreign-born population - Hungary (%)
Place of birth for the foreign-born population - Latvia (%)
Place of birth for the foreign-born population - Lithuania (%)
Place of birth for the foreign-born population - North Macedonia (Macedonia) (%)
Place of birth for the foreign-born population - Moldova (%)
Place of birth for the foreign-born population - Poland (%)
Place of birth for the foreign-born population - Romania (%)
Place of birth for the foreign-born population - Russia (%)
Place of birth for the foreign-born population - Serbia (%)
Place of birth for the foreign-born population - Ukraine (%)
Place of birth for the foreign-born population - Other Eastern Europe (%)
Place of birth for the foreign-born population - China (%)
Place of birth for the foreign-born population - Hong Kong (%)
Place of birth for the foreign-born population - Taiwan (%)
Place of birth for the foreign-born population - Japan (%)
Place of birth for the foreign-born population - Korea (%)
Place of birth for the foreign-born population - Other Eastern Asia (%)
Place of birth for the foreign-born population - Afghanistan (%)
Place of birth for the foreign-born population - Bangladesh (%)
Place of birth for the foreign-born population - India (%)
Place of birth for the foreign-born population - Iran (%)
Place of birth for the foreign-born population - Kazakhstan (%)
Place of birth for the foreign-born population - Nepal (%)
Place of birth for the foreign-born population - Pakistan (%)
Place of birth for the foreign-born population - Sri Lanka (%)
Place of birth for the foreign-born population - Uzbekistan (%)
Place of birth for the foreign-born population - Other South Central Asia (%)
Place of birth for the foreign-born population - Burma (%)
Place of birth for the foreign-born population - Cambodia (%)
Place of birth for the foreign-born population - Indonesia (%)
Place of birth for the foreign-born population - Laos (%)
Place of birth for the foreign-born population - Malaysia (%)
Place of birth for the foreign-born population - Philippines (%)
Place of birth for the foreign-born population - Singapore (%)
Place of birth for the foreign-born population - Thailand (%)
Place of birth for the foreign-born population - Vietnam (%)
Place of birth for the foreign-born population - Other South Eastern Asia (%)
Place of birth for the foreign-born population - Armenia (%)
Place of birth for the foreign-born population - Iraq (%)
Place of birth for the foreign-born population - Israel (%)
Place of birth for the foreign-born population - Jordan (%)
Place of birth for the foreign-born population - Kuwait (%)
Place of birth for the foreign-born population - Lebanon (%)
Place of birth for the foreign-born population - Saudi Arabia (%)
Place of birth for the foreign-born population - Syria (%)
Place of birth for the foreign-born population - Turkey (%)
Place of birth for the foreign-born population - Yemen (%)
Place of birth for the foreign-born population - Other Western Asia (%)
Place of birth for the foreign-born population - Eritrea (%)
Place of birth for the foreign-born population - Ethiopia (%)
Place of birth for the foreign-born population - Kenya (%)
Place of birth for the foreign-born population - Somalia (%)
Place of birth for the foreign-born population - Uganda (%)
Place of birth for the foreign-born population - Zimbabwe (%)
Place of birth for the foreign-born population - Other Eastern Africa (%)
Place of birth for the foreign-born population - Cameroon (%)
Place of birth for the foreign-born population - Congo (%)
Place of birth for the foreign-born population - Democratic Republic of Congo (Zaire) (%)
Place of birth for the foreign-born population - Other Middle Africa (%)
Place of birth for the foreign-born population - Egypt (%)
Place of birth for the foreign-born population - Morocco (%)
Place of birth for the foreign-born population - Sudan (%)
Place of birth for the foreign-born population - Other Northern Africa (%)
Place of birth for the foreign-born population - South Africa (%)
Place of birth for the foreign-born population - Other Southern Africa (%)
Place of birth for the foreign-born population - Cabo Verde (%)
Place of birth for the foreign-born population - Ghana (%)
Place of birth for the foreign-born population - Liberia (%)
Place of birth for the foreign-born population - Nigeria (%)
Place of birth for the foreign-born population - Senegal (%)
Place of birth for the foreign-born population - Sierra Leone (%)
Place of birth for the foreign-born population - Other Western Africa (%)
Place of birth for the foreign-born population - Australia (%)
Place of birth for the foreign-born population - New Zealand (%)
Place of birth for the foreign-born population - Fiji (%)
Place of birth for the foreign-born population - Micronesia (%)
Place of birth for the foreign-born population - Bahamas (%)
Place of birth for the foreign-born population - Barbados (%)
Place of birth for the foreign-born population - Cuba (%)
Place of birth for the foreign-born population - Dominica (%)
Place of birth for the foreign-born population - Dominican Republic (%)
Place of birth for the foreign-born population - Grenada (%)
Place of birth for the foreign-born population - Haiti (%)
Place of birth for the foreign-born population - Jamaica (%)
Place of birth for the foreign-born population - St. Vincent and the Grenadines (%)
Place of birth for the foreign-born population - Trinidad and Tobago (%)
Place of birth for the foreign-born population - West Indies (%)
Place of birth for the foreign-born population - Other Caribbean (%)
Place of birth for the foreign-born population - Belize (%)
Place of birth for the foreign-born population - Costa Rica (%)
Place of birth for the foreign-born population - El Salvador (%)
Place of birth for the foreign-born population - Guatemala (%)
Place of birth for the foreign-born population - Honduras (%)
Place of birth for the foreign-born population - Mexico (%)
Place of birth for the foreign-born population - Nicaragua (%)
Place of birth for the foreign-born population - Panama (%)
Place of birth for the foreign-born population - Other Central America (%)
Place of birth for the foreign-born population - Argentina (%)
Place of birth for the foreign-born population - Bolivia (%)
Place of birth for the foreign-born population - Brazil (%)
Place of birth for the foreign-born population - Chile (%)
Place of birth for the foreign-born population - Colombia (%)
Place of birth for the foreign-born population - Ecuador (%)
Place of birth for the foreign-born population - Guyana (%)
Place of birth for the foreign-born population - Peru (%)
Place of birth for the foreign-born population - Uruguay (%)
Place of birth for the foreign-born population - Venezuela (%)
Place of birth for the foreign-born population - Other South America (%)
Place of birth for the foreign-born population - Canada (%)
Place of birth for the foreign-born population - Other Northern America (%)
Place of birth for the foreign-born population - Other (%)
Latest news about races in Centreville, VA collected exclusively by city-data.com from local newspapers, TV, and radio stations
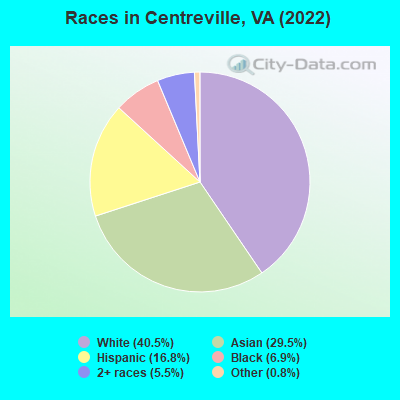
According to 2022 data, the most numerous races in Centreville, VA are White alone (29,274 residents), Black alone (5,005 residents), and Hispanic (12,157 residents). 59.0% of Centreville residents speak English at home. 35.4% of Centreville, VA residents are foreign-born (22.0% born in Asia, 8.4% born in Latin America, 3.7% born in Africa), which is 66.1% greater than the foreign-born rate of 12.0% across the entire state of Virginia.
Race distribution in Centreville
2000 2022
31,539 64.8% White alone 6,921 14.2% Asian alone 4,461 9.2% Hispanic 4,231 8.7% Black alone 1,255 2.6% Two or more races 124 0.3% Other race alone 109 0.2% American Indian alone 21 0.04% Native Hawaiian and Other
29,274 40.5% White alone 21,289 29.5% Asian alone 12,157 16.8% Hispanic 5,005 6.9% Black alone 3,985 5.5% Two or more races 590 0.8% Other race alone 66 0.09% Native Hawaiian and Other 50 0.07% American Indian alone
2000 2022
4,965,637 70.2% White alone 1,376,378 19.4% Black alone 329,540 4.7% Hispanic 259,277 3.7% Asian alone 114,022 1.6% Two or more races 18,596 0.3% American Indian alone 11,685 0.2% Other race alone 3,380 0.05% Native Hawaiian and Other
5,095,130 58.7% White alone 1,594,785 18.4% Black alone 905,750 10.4% Hispanic 602,881 6.9% Asian alone 406,047 4.7% Two or more races 60,419 0.7% Other race alone 11,738 0.1% American Indian alone 6,869 0.08% Native Hawaiian and Other
Income and house value in Centreville Median household income in 2022 $143,302 White non-Hispanic householders$116,174 Black householders$141,389 Asian householders$90,488 Some other race householders$123,739 Two or more races householders$91,892 Hispanic or Latino race householdersMedian 2022 house value $592,918 White Non-Hispanic householders$530,579 Black or African American householders$654,912 American Indian or Alaska Native householders $562,788 Asian householders$779,244 Native Hawaiian and other Pacific Islander householders$457,849 Some other race householders$563,827 Two or more races householders$489,365 Hispanic or Latino householders
Median age by race in Centreville
41.3 Median age for White residents40.1 43.9 51.9 Median age for Black or African American residents55.8 48.5 -666,666,666.0 Median age for American Indian / Alaska Native residents-666,666,666.0 -666,666,666.0 43.2 Median age for Asian residents36.8 45.7 27.1 Median age for Native Hawaiian / Pacific Islander residents-666,666,666.0 27.2 31.8 Median age for Other race residents33.7 27.8 26.9 Median age for Two or more races residents25.6 30.1 43.6 Median age for White alone residents41.9 44.5 30.1 Median age for Hispanic or Latino residents31.4 27.7
Owner/renter occupied households by race in Centreville
House owners and renters - White residents 10,393 78.0% Owner occupied2,931 22.0% Renter occupiedHouse owners and renters - Black or African American residents 924 58.0% Owner occupied669 42.0% Renter occupiedHouse owners and renters - American Indian / Alaska Native residents 29 80.3% Owner occupied7 19.7% Renter occupiedHouse owners and renters - Asian residents 6,414 87.5% Owner occupied914 12.5% Renter occupiedHouse owners and renters - Native Hawaiian / Pacific Islander residents 28 100.0% Owner occupiedHouse owners and renters - Other race residents 514 46.9% Owner occupied581 53.1% Renter occupiedHouse owners and renters - Two or more races residents 1,044 51.8% Owner occupied972 48.2% Renter occupiedHouse owners and renters - White alone residents 10,008 78.8% Owner occupied2,686 21.2% Renter occupiedHouse owners and renters - Hispanic or Latino residents 1,562 49.6% Owner occupied1,587 50.4% Renter occupied
Language usage in Centreville
English speakers - Total 59.0% of residents of Centreville speak English at home.
11.7% of residents speak Spanish at home 5,393 69.1% Speak English very well2,409 30.9% Speak English less than very well29.3% of residents speak other language at home 12,910 66.3% Speak English very well6,567 33.7% Speak English less than very well
English speakers - Born in the United States 93.6% of residents of Centreville speak English at home.
2.7% of residents speak Spanish at home 519 100.0% Speak English very well3.8% of residents speak other language at home 681 93.2% Speak English very well50 6.8% Speak English less than very well
English speakers - Native, born elsewhere 38.7% of residents of Centreville speak English at home.
47.6% of residents speak Spanish at home 1,457 100.0% Speak English very well13.7% of residents speak other language at home 418 100.0% Speak English very well
English speakers - Foreign-born 17.6% of residents of Centreville speak English at home.
16.3% of residents speak Spanish at home 1,380 36.4% Speak English very well2,409 63.6% Speak English less than very well66.1% of residents speak other language at home 8,912 58.1% Speak English very well6,421 41.9% Speak English less than very well
White (Caucasian) - Speak only English Native:
95.5% (26,240)Foreign-born:
20.3% (547)
White (Caucasian) - Speak another language Native:
4.5% (1,231)Foreign-born:
79.7% (2,147)
Black or African American - Speak only English Native:
87.3% (3,094)Foreign-born:
35.3% (483)
Black or African American - Speak another language Native:
12.9% (457)Foreign-born:
67.3% (921)
American Indian / Alaska Native - Speak only English Native:
92.4% (67)Foreign-born:
84.3% (24)
Asian - Speak only English Native:
45.3% (3,059)Foreign-born:
16.0% (2,315)
Asian - Speak another language Native:
54.7% (3,690)Foreign-born:
84.0% (12,141)
Native Hawaiian / Pacific Islander - Speak only English Native:
88.0% (52)Foreign-born:
41.5% (13)
Other race - Speak only English Native:
44.2% (646)Foreign-born:
38.3% (409)
Other race - Speak another language Native:
55.8% (817)Foreign-born:
61.7% (658)
Two or more races - Speak only English Native:
50.1% (2,358)Foreign-born:
6.8% (234)
Two or more races - Speak another language Native:
49.9% (2,345)Foreign-born:
93.2% (3,217)
White alone - Speak only English Native:
97.8% (25,825)Foreign-born:
26.3% (547)
White alone - Speak another language Native:
2.2% (577)Foreign-born:
73.7% (1,534)
Hispanic or Latino - Speak only English Native:
32.3% (1,791)Foreign-born:
11.2% (532)
Hispanic or Latino - Speak another language Native:
67.7% (3,749)Foreign-born:
88.8% (4,234)
Foreign-born residents in Centreville 25,606 residents are foreign born (22.0% Asia , 8.4% Latin America , 3.7% Africa ).
This city:
35.4%Virginia:
12.6%
Marital status for residents in Centreville Marital status - White (Caucasian) population 15 years and over
Males 34.2% Never married56.8% Now married0.4% Separated2.9% Widowed5.7% DivorcedFemales 30.9% Never married50.3% Now married1.2% Separated7.3% Widowed10.3% DivorcedWomen who gave birth in the past 12 months Now married:
100.0% (160)Unmarried:
0.0% (0)
Women who did not give birth in the past 12 months Now married:
43.2% (3,108)Unmarried:
56.8% (4,083)
Marital status - Black or African American population 15 years and over
Males 36.1% Never married47.6% Now married2.2% Separated0.8% Widowed13.2% DivorcedFemales 39.5% Never married41.2% Now married0.5% Separated8.1% Widowed10.8% DivorcedWomen who gave birth in the past 12 months Now married:
72.5% (57)Unmarried:
27.5% (22)
Women who did not give birth in the past 12 months Now married:
33.6% (379)Unmarried:
66.4% (750)
Marital status - American Indian / Alaska Native population 15 years and over
Males 25.9% Never married74.1% Now married0.0% Separated0.0% Widowed0.0% DivorcedFemales 78.6% Never married21.4% Now married0.0% Separated0.0% Widowed0.0% DivorcedWomen who did not give birth in the past 12 months Now married:
21.4% (3)Unmarried:
78.6% (12)
Marital status - Asian population 15 years and over
Males 34.2% Never married62.9% Now married0.7% Separated1.0% Widowed1.2% DivorcedFemales 19.5% Never married69.0% Now married1.7% Separated5.2% Widowed4.6% DivorcedWomen who gave birth in the past 12 months Now married:
90.5% (238)Unmarried:
9.5% (25)
Women who did not give birth in the past 12 months Now married:
58.7% (2,996)Unmarried:
41.3% (2,108)
Marital status - Native Hawaiian / Pacific Islander population 15 years and over
Males 61.1% Never married33.3% Now married0.0% Separated0.0% Widowed5.6% DivorcedFemales 71.9% Never married28.1% Now married0.0% Separated0.0% Widowed0.0% DivorcedWomen who did not give birth in the past 12 months Now married:
30.0% (9)Unmarried:
70.0% (22)
Marital status - Other race population 15 years and over
Males 49.7% Never married45.3% Now married0.0% Separated1.0% Widowed4.0% DivorcedFemales 34.0% Never married43.9% Now married0.6% Separated9.1% Widowed12.4% DivorcedWomen who gave birth in the past 12 months Now married:
77.8% (95)Unmarried:
22.2% (27)
Women who did not give birth in the past 12 months Now married:
41.5% (513)Unmarried:
58.5% (724)
Marital status - Two or more races population 15 years and over
Males 50.6% Never married40.6% Now married0.0% Separated0.0% Widowed8.8% DivorcedFemales 40.5% Never married42.5% Now married2.1% Separated4.7% Widowed10.2% DivorcedWomen who gave birth in the past 12 months Now married:
76.3% (60)Unmarried:
23.7% (19)
Women who did not give birth in the past 12 months Now married:
28.2% (643)Unmarried:
71.8% (1,636)
Marital status - White alone, not Hispanic / Latino population 15 years and over
Males 35.5% Never married57.0% Now married0.4% Separated3.0% Widowed4.0% DivorcedFemales 30.8% Never married50.2% Now married1.2% Separated7.6% Widowed10.3% DivorcedWomen who gave birth in the past 12 months Now married:
100.0% (160)Unmarried:
0.0% (0)
Women who did not give birth in the past 12 months Now married:
42.4% (2,870)Unmarried:
57.6% (3,894)
Marital status - Hispanic or Latino population 15 years and over
Males 42.0% Never married45.5% Now married0.0% Separated0.0% Widowed12.5% DivorcedFemales 49.3% Never married39.1% Now married1.8% Separated0.0% Widowed9.8% DivorcedWomen who gave birth in the past 12 months Now married:
89.1% (113)Unmarried:
10.9% (14)
Women who did not give birth in the past 12 months Now married:
44.1% (1,268)Unmarried:
55.9% (1,605)
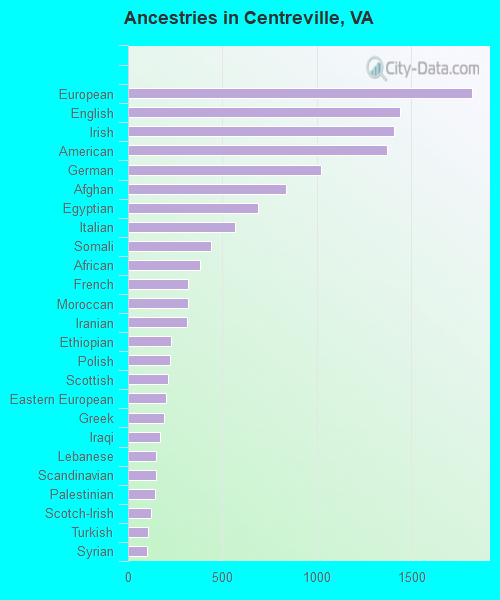
Ancestries in Centreville
1,821 4.6% European1,439 3.6% English1,410 3.5% Irish1,371 3.4% American1,021 2.6% German835 2.1% Afghan691 1.7% Egyptian565 1.4% Italian440 1.1% Somali383 1.0% African320 0.8% French319 0.8% Moroccan315 0.8% Iranian228 0.6% Ethiopian224 0.6% Polish210 0.5% Scottish199 0.5% Eastern European190 0.5% Greek171 0.4% Iraqi148 0.4% Lebanese146 0.4% Scandinavian142 0.4% Palestinian120 0.3% Scotch-Irish106 0.3% Turkish102 0.3% Syrian102 0.3% French Canadian102 0.3% British95 0.2% Sierra Leonean94 0.2% South African86 0.2% Armenian78 0.2% Ghanaian68 0.2% Arab67 0.2% Northern European62 0.2% Ukrainian60 0.2% Russian59 0.1% Jamaican56 0.1% Sudanese56 0.1% Finnish44 0.1% Dutch42 0.1% Portuguese36 0.09% Yugoslavian31 0.08% Romanian31 0.08% Croatian31 0.08% Belgian28 0.07% Serbian27 0.07% Norwegian27 0.07% Hungarian20 0.05% Welsh18 0.05% Czech18 0.05% Austrian18 0.05% Haitian17 0.04% Kenyan17 0.04% Nigerian17 0.04% Swedish16 0.04% Carpatho Rusyn16 0.04% Alsatian12 0.03% Jordanian12 0.03% Lithuanian10 0.03% British West Indian9 0.02% Estonian9 0.02% Trinidadian and Tobagonian8 0.02% Slovak8 0.02% Israeli7 0.02% Danish6 0.02% Canadian6 0.02% German Russian5 0.01% Pennsylvania German
Geographical mobility in Centreville Same house 1 year ago 28,301 91.2% White (Caucasian)4,334 85.3% Black or African American86 82.1% American Indian / Alaska Native18,929 89.1% Asian82 95.3% Native Hawaiian / Pacific Islander4,697 98.8% Other race8,195 79.4% Two or more races26,359 90.7% White alone, not Hispanic / Latino10,593 88.2% Hispanic or LatinoMoved within same county 752 2.4% White / Caucasian322 6.3% Black or African American29 27.5% American Indian / Alaska Native1,115 5.3% Asian64 1.4% Other race773 7.5% Two or more races752 2.6% White alone, not Hispanic / Latino357 3.0% Hispanic or LatinoMoved within same state 1,115 3.6% White / Caucasian143 2.8% Black or African American739 3.5% Asian53 1.1% Other race271 2.6% Two or more races1,115 3.8% White alone, not Hispanic / Latino333 2.8% Hispanic or LatinoMoved from different state 781 2.5% White / Caucasian163 3.2% Black or African American200 0.9% Asian81 1.7% Other race279 2.7% Two or more races746 2.6% White alone, not Hispanic / Latino141 1.2% Hispanic or LatinoMoved from abroad 77 0.2% White16 0.3% Black or African American139 0.7% Asian10 0.2% Other race793 7.7% Two or more races77 0.3% White alone, not Hispanic / Latino461 3.8% Hispanic or Latino
Children Nativity (place of birth) in Centreville
Children under 6 years - Living with two parents Both parents native 1,098 100.0% NativeBoth parents foreign-born 1,424 100.0% NativeOne native, one foreign-born parent 377 100.0% NativeChildren under 6 years - Living with one parent Native parent 361 100.0% NativeForeign-born parent 540 100.0% NativeChildren 6 to 17 years - Living with two parents Both parents native 3,769 98.9% Native42 1.1% Foreign-bornBoth parents foreign-born 2,968 94.8% Native164 5.2% Foreign-bornOne native, one foreign-born parent 562 89.9% Native63 10.1% Foreign-bornChildren 6 to 17 years - Living with one parent Native parent 1,653 100.0% NativeForeign-born parent 1,398 54.0% Native1,190 46.0% Foreign-born
Place of birth for residents in Centreville 15,934 Asia8,193 Eastern Asia6,197 Americas6,089 Latin America4,157 South Central Asia3,077 Central America2,775 South America2,713 Africa2,533 South Eastern Asia1,618 Northern Africa1,051 China1,002 Western Asia746 Europe525 Western Africa370 Eastern Africa344 Western Europe236 Caribbean179 Eastern Europe134 Southern Europe107 Northern America102 Middle Africa88 Northern Europe55 Southern Africa14 Oceania1 Australia and New Zealand Subregion6,994 Korea2,269 India1,271 Vietnam1,233 El Salvador1,030 Egypt1,018 Peru974 Guatemala813 China758 Philippines675 Afghanistan636 Bolivia496 Morocco487 Colombia482 Iraq385 Honduras377 Nepal302 Bangladesh293 Ghana290 Nicaragua272 Ecuador259 Iran246 Thailand242 Pakistan207 Taiwan187 Mexico182 Ethiopia165 Sierra Leone141 Somalia140 Venezuela138 Saudi Arabia123 Turkey119 Netherlands118 Chile110 Germany107 Canada105 Japan98 France90 Democratic Republic of Congo (Zaire)84 Lebanon75 Indonesia74 Cambodia73 Cuba72 Dominican Republic71 Russia69 Sudan68 Guyana56 Ukraine55 South Africa50 Syria48 Malaysia48 Spain47 Greece44 Laos41 Liberia40 England38 United Kingdom37 Italy36 Israel33 Haiti30 Hong Kong29 Uzbekistan27 Kenya26 Romania21 Kuwait21 United Arab Emirates20 Grenada18 Argentina16 Yemen15 Belgium13 Jamaica13 Ivory Coast12 Fiji12 Trinidad and Tobago11 Cameroon11 Burma (Myanmar)10 Nigeria7 Czechoslovakia6 Hungary6 Brazil5 Panama5 Uruguay1 New Zealand
Grandparents responsible for own grandchildren in Centreville
Grandparents (30 to 59 years) White / Caucasian 103 100.0% Not responsible for grandchildrenBlack or African American 8 55.0% Responsible for grandchildren7 45.0% Not responsible for grandchildrenAsian 35 55.6% Responsible for grandchildren28 44.4% Not responsible for grandchildrenTwo or more races 65 100.0% Responsible for grandchildrenWhite alone, not Hispanic / Latino 24 100.0% Not responsible for grandchildrenHispanic or Latino 27 15.3% Responsible for grandchildren149 84.7% Not responsible for grandchildrenGrandparents (60 years and over) White / Caucasian 20 7.0% Responsible for grandchildren267 93.0% Not responsible for grandchildrenBlack or African American 63 100.0% Not responsible for grandchildrenAsian 49 19.6% Responsible for grandchildren200 80.4% Not responsible for grandchildrenTwo or more races 112 100.0% Not responsible for grandchildrenWhite alone, not Hispanic / Latino 22 8.3% Responsible for grandchildren241 91.7% Not responsible for grandchildrenHispanic or Latino 63 26.9% Responsible for grandchildren172 73.1% Not responsible for grandchildren