Races in Chester, Virginia (VA) Detailed Stats
Data:
Races - White alone (%)
Races - White alone (% change since 2000)
Races - Black alone (%)
Races - Black alone (% change since 2000)
Races - American Indian alone (%)
Races - American Indian alone (% change since 2000)
Races - Asian alone (%)
Races - Asian alone (% change since 2000)
Races - Hispanic (%)
Races - Hispanic (% change since 2000)
Races - Native Hawaiian and Other Pacific Islander alone (%)
Races - Native Hawaiian and Other Pacific Islander alone (% change since 2000)
Races - Two or more races(%)
Races - Two or more races(% change since 2000)
Races - Other race alone (%)
Races - Other race alone (% change since 2000)
Racial diversity
Place of birth - Born in state of residence (%)
Place of birth - Born in state of residence (%) - White
Place of birth - Born in state of residence (%) - Black or African American
Place of birth - Born in state of residence (%) - Asian
Place of birth - Born in state of residence (%) - Hispanic or Latino
Place of birth - Born in state of residence (%) - American Indian and Alaska Native
Place of birth - Born in state of residence (%) - Multirace
Place of birth - Born in state of residence (%) - Other Race
Place of birth - Born in other state (%)
Place of birth - Born in other state (%) - White
Place of birth - Born in other state (%) - Black or African American
Place of birth - Born in other state (%) - Asian
Place of birth - Born in other state (%) - Hispanic or Latino
Place of birth - Born in other state (%) - American Indian and Alaska Native
Place of birth - Born in other state (%) - Multirace
Place of birth - Born in other state (%) - Other Race
Place of birth - Native, outside of US (%)
Place of birth - Native, outside of US (%) - White
Place of birth - Native, outside of US (%) - Black or African American
Place of birth - Native, outside of US (%) - Asian
Place of birth - Native, outside of US (%) - Hispanic or Latino
Place of birth - Native, outside of US (%) - American Indian and Alaska Native
Place of birth - Native, outside of US (%) - Multirace
Place of birth - Native, outside of US (%) - Other Race
Place of birth - Foreign born (%)
Place of birth - Foreign born (%) - White
Place of birth - Foreign born (%) - Black or African American
Place of birth - Foreign born (%) - Asian
Place of birth - Foreign born (%) - Hispanic or Latino
Place of birth - Foreign born (%) - American Indian and Alaska Native
Place of birth - Foreign born (%) - Multirace
Place of birth - Foreign born (%) - Other Race
Residents speaking English at home (%)
Residents speaking English at home - Born in the United States (%)
Residents speaking English at home - Native, born elsewhere (%)
Residents speaking English at home - Foreign born (%)
Residents speaking Spanish at home (%)
Residents speaking Spanish at home - Born in the United States (%)
Residents speaking Spanish at home - Native, born elsewhere (%)
Residents speaking Spanish at home - Foreign born (%)
Residents speaking other language at home (%)
Residents speaking other language at home - Born in the United States (%)
Residents speaking other language at home - Native, born elsewhere (%)
Residents speaking other language at home - Foreign born (%)
Marital status - Never married (%)
Marital status - Now married (%)
Marital status - Separated (%)
Marital status - Widowed (%)
Marital status - Divorced (%)
Ancestries Reported - Arab (%)
Ancestries Reported - Czech (%)
Ancestries Reported - Danish (%)
Ancestries Reported - Dutch (%)
Ancestries Reported - English (%)
Ancestries Reported - French (%)
Ancestries Reported - French Canadian (%)
Ancestries Reported - German (%)
Ancestries Reported - Greek (%)
Ancestries Reported - Hungarian (%)
Ancestries Reported - Irish (%)
Ancestries Reported - Italian (%)
Ancestries Reported - Lithuanian (%)
Ancestries Reported - Norwegian (%)
Ancestries Reported - Polish (%)
Ancestries Reported - Portuguese (%)
Ancestries Reported - Russian (%)
Ancestries Reported - Scotch-Irish (%)
Ancestries Reported - Scottish (%)
Ancestries Reported - Slovak (%)
Ancestries Reported - Subsaharan African (%)
Ancestries Reported - Swedish (%)
Ancestries Reported - Swiss (%)
Ancestries Reported - Ukrainian (%)
Ancestries Reported - United States (%)
Ancestries Reported - Welsh (%)
Ancestries Reported - West Indian (%)
Ancestries Reported - Other (%)
Geographical mobility - Same house 1 year ago (%)
Geographical mobility - Same house 1 year ago (%) - White
Geographical mobility - Same house 1 year ago (%) - Black or African American
Geographical mobility - Same house 1 year ago (%) - Asian
Geographical mobility - Same house 1 year ago (%) - Hispanic or Latino
Geographical mobility - Same house 1 year ago (%) - American Indian and Alaska Native
Geographical mobility - Same house 1 year ago (%) - Multirace
Geographical mobility - Same house 1 year ago (%) - Other Race
Geographical mobility - Moved within same county (%)
Geographical mobility - Moved within same county (%) - White
Geographical mobility - Moved within same county (%) - Black or African American
Geographical mobility - Moved within same county (%) - Asian
Geographical mobility - Moved within same county (%) - Hispanic or Latino
Geographical mobility - Moved within same county (%) - American Indian and Alaska Native
Geographical mobility - Moved within same county (%) - Multirace
Geographical mobility - Moved within same county (%) - Other Race
Geographical mobility - Moved from different county within same state (%)
Geographical mobility - Moved from different county within same state (%) - White
Geographical mobility - Moved from different county within same state (%) - Black or African American
Geographical mobility - Moved from different county within same state (%) - Asian
Geographical mobility - Moved from different county within same state (%) - Hispanic or Latino
Geographical mobility - Moved from different county within same state (%) - American Indian and Alaska Native
Geographical mobility - Moved from different county within same state (%) - Multirace
Geographical mobility - Moved from different county within same state (%) - Other Race
Geographical mobility - Moved from different state (%)
Geographical mobility - Moved from different state (%) - White
Geographical mobility - Moved from different state (%) - Black or African American
Geographical mobility - Moved from different state (%) - Asian
Geographical mobility - Moved from different state (%) - Hispanic or Latino
Geographical mobility - Moved from different state (%) - American Indian and Alaska Native
Geographical mobility - Moved from different state (%) - Multirace
Geographical mobility - Moved from different state (%) - Other Race
Geographical mobility - Moved from abroad (%)
Geographical mobility - Moved from abroad (%) - White
Geographical mobility - Moved from abroad (%) - Black or African American
Geographical mobility - Moved from abroad (%) - Asian
Geographical mobility - Moved from abroad (%) - Hispanic or Latino
Geographical mobility - Moved from abroad (%) - American Indian and Alaska Native
Geographical mobility - Moved from abroad (%) - Multirace
Geographical mobility - Moved from abroad (%) - Other Race
Place of birth for the foreign-born population - Ireland (%)
Place of birth for the foreign-born population - Denmark (%)
Place of birth for the foreign-born population - Norway (%)
Place of birth for the foreign-born population - Sweden (%)
Place of birth for the foreign-born population - United Kingdom (%)
Place of birth for the foreign-born population - England (%)
Place of birth for the foreign-born population - Scotland (%)
Place of birth for the foreign-born population - Other Northern Europe (%)
Place of birth for the foreign-born population - Austria (%)
Place of birth for the foreign-born population - Belgium (%)
Place of birth for the foreign-born population - France (%)
Place of birth for the foreign-born population - Germany (%)
Place of birth for the foreign-born population - Netherlands (%)
Place of birth for the foreign-born population - Switzerland (%)
Place of birth for the foreign-born population - Other Western Europe (%)
Place of birth for the foreign-born population - Greece (%)
Place of birth for the foreign-born population - Italy (%)
Place of birth for the foreign-born population - Portugal (%)
Place of birth for the foreign-born population - Spain (%)
Place of birth for the foreign-born population - Other Southern Europe (%)
Place of birth for the foreign-born population - Albania (%)
Place of birth for the foreign-born population - Belarus (%)
Place of birth for the foreign-born population - Bosnia and Herzegovina (%)
Place of birth for the foreign-born population - Bulgaria (%)
Place of birth for the foreign-born population - Croatia (%)
Place of birth for the foreign-born population - Czechoslovakia (%)
Place of birth for the foreign-born population - Hungary (%)
Place of birth for the foreign-born population - Latvia (%)
Place of birth for the foreign-born population - Lithuania (%)
Place of birth for the foreign-born population - North Macedonia (Macedonia) (%)
Place of birth for the foreign-born population - Moldova (%)
Place of birth for the foreign-born population - Poland (%)
Place of birth for the foreign-born population - Romania (%)
Place of birth for the foreign-born population - Russia (%)
Place of birth for the foreign-born population - Serbia (%)
Place of birth for the foreign-born population - Ukraine (%)
Place of birth for the foreign-born population - Other Eastern Europe (%)
Place of birth for the foreign-born population - China (%)
Place of birth for the foreign-born population - Hong Kong (%)
Place of birth for the foreign-born population - Taiwan (%)
Place of birth for the foreign-born population - Japan (%)
Place of birth for the foreign-born population - Korea (%)
Place of birth for the foreign-born population - Other Eastern Asia (%)
Place of birth for the foreign-born population - Afghanistan (%)
Place of birth for the foreign-born population - Bangladesh (%)
Place of birth for the foreign-born population - India (%)
Place of birth for the foreign-born population - Iran (%)
Place of birth for the foreign-born population - Kazakhstan (%)
Place of birth for the foreign-born population - Nepal (%)
Place of birth for the foreign-born population - Pakistan (%)
Place of birth for the foreign-born population - Sri Lanka (%)
Place of birth for the foreign-born population - Uzbekistan (%)
Place of birth for the foreign-born population - Other South Central Asia (%)
Place of birth for the foreign-born population - Burma (%)
Place of birth for the foreign-born population - Cambodia (%)
Place of birth for the foreign-born population - Indonesia (%)
Place of birth for the foreign-born population - Laos (%)
Place of birth for the foreign-born population - Malaysia (%)
Place of birth for the foreign-born population - Philippines (%)
Place of birth for the foreign-born population - Singapore (%)
Place of birth for the foreign-born population - Thailand (%)
Place of birth for the foreign-born population - Vietnam (%)
Place of birth for the foreign-born population - Other South Eastern Asia (%)
Place of birth for the foreign-born population - Armenia (%)
Place of birth for the foreign-born population - Iraq (%)
Place of birth for the foreign-born population - Israel (%)
Place of birth for the foreign-born population - Jordan (%)
Place of birth for the foreign-born population - Kuwait (%)
Place of birth for the foreign-born population - Lebanon (%)
Place of birth for the foreign-born population - Saudi Arabia (%)
Place of birth for the foreign-born population - Syria (%)
Place of birth for the foreign-born population - Turkey (%)
Place of birth for the foreign-born population - Yemen (%)
Place of birth for the foreign-born population - Other Western Asia (%)
Place of birth for the foreign-born population - Eritrea (%)
Place of birth for the foreign-born population - Ethiopia (%)
Place of birth for the foreign-born population - Kenya (%)
Place of birth for the foreign-born population - Somalia (%)
Place of birth for the foreign-born population - Uganda (%)
Place of birth for the foreign-born population - Zimbabwe (%)
Place of birth for the foreign-born population - Other Eastern Africa (%)
Place of birth for the foreign-born population - Cameroon (%)
Place of birth for the foreign-born population - Congo (%)
Place of birth for the foreign-born population - Democratic Republic of Congo (Zaire) (%)
Place of birth for the foreign-born population - Other Middle Africa (%)
Place of birth for the foreign-born population - Egypt (%)
Place of birth for the foreign-born population - Morocco (%)
Place of birth for the foreign-born population - Sudan (%)
Place of birth for the foreign-born population - Other Northern Africa (%)
Place of birth for the foreign-born population - South Africa (%)
Place of birth for the foreign-born population - Other Southern Africa (%)
Place of birth for the foreign-born population - Cabo Verde (%)
Place of birth for the foreign-born population - Ghana (%)
Place of birth for the foreign-born population - Liberia (%)
Place of birth for the foreign-born population - Nigeria (%)
Place of birth for the foreign-born population - Senegal (%)
Place of birth for the foreign-born population - Sierra Leone (%)
Place of birth for the foreign-born population - Other Western Africa (%)
Place of birth for the foreign-born population - Australia (%)
Place of birth for the foreign-born population - New Zealand (%)
Place of birth for the foreign-born population - Fiji (%)
Place of birth for the foreign-born population - Micronesia (%)
Place of birth for the foreign-born population - Bahamas (%)
Place of birth for the foreign-born population - Barbados (%)
Place of birth for the foreign-born population - Cuba (%)
Place of birth for the foreign-born population - Dominica (%)
Place of birth for the foreign-born population - Dominican Republic (%)
Place of birth for the foreign-born population - Grenada (%)
Place of birth for the foreign-born population - Haiti (%)
Place of birth for the foreign-born population - Jamaica (%)
Place of birth for the foreign-born population - St. Vincent and the Grenadines (%)
Place of birth for the foreign-born population - Trinidad and Tobago (%)
Place of birth for the foreign-born population - West Indies (%)
Place of birth for the foreign-born population - Other Caribbean (%)
Place of birth for the foreign-born population - Belize (%)
Place of birth for the foreign-born population - Costa Rica (%)
Place of birth for the foreign-born population - El Salvador (%)
Place of birth for the foreign-born population - Guatemala (%)
Place of birth for the foreign-born population - Honduras (%)
Place of birth for the foreign-born population - Mexico (%)
Place of birth for the foreign-born population - Nicaragua (%)
Place of birth for the foreign-born population - Panama (%)
Place of birth for the foreign-born population - Other Central America (%)
Place of birth for the foreign-born population - Argentina (%)
Place of birth for the foreign-born population - Bolivia (%)
Place of birth for the foreign-born population - Brazil (%)
Place of birth for the foreign-born population - Chile (%)
Place of birth for the foreign-born population - Colombia (%)
Place of birth for the foreign-born population - Ecuador (%)
Place of birth for the foreign-born population - Guyana (%)
Place of birth for the foreign-born population - Peru (%)
Place of birth for the foreign-born population - Uruguay (%)
Place of birth for the foreign-born population - Venezuela (%)
Place of birth for the foreign-born population - Other South America (%)
Place of birth for the foreign-born population - Canada (%)
Place of birth for the foreign-born population - Other Northern America (%)
Place of birth for the foreign-born population - Other (%)
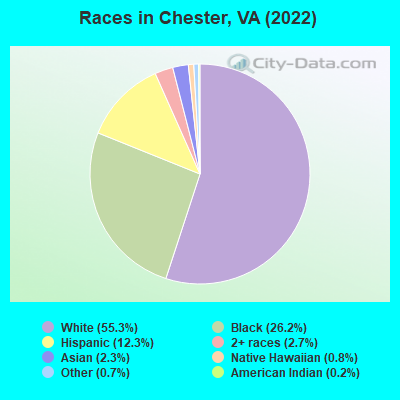
According to 2022 data, the most numerous races in Chester, VA are White alone (13,190 residents), Black alone (6,258 residents), and Hispanic (2,937 residents). 88.9% of Chester residents speak English at home. 7.4% of Chester, VA residents are foreign-born (5.4% born in Latin America, 1.3% born in Asia), which is 61.4% less than the foreign-born rate of 12.0% across the entire state of Virginia.
Race distribution in Chester
2000 2022
4,965,637 70.2% White alone 1,376,378 19.4% Black alone 329,540 4.7% Hispanic 259,277 3.7% Asian alone 114,022 1.6% Two or more races 18,596 0.3% American Indian alone 11,685 0.2% Other race alone 3,380 0.05% Native Hawaiian and Other
5,095,130 58.7% White alone 1,594,785 18.4% Black alone 905,750 10.4% Hispanic 602,881 6.9% Asian alone 406,047 4.7% Two or more races 60,419 0.7% Other race alone 11,738 0.1% American Indian alone 6,869 0.08% Native Hawaiian and Other
Income and house value in Chester Median household income in 2022 $109,327 White non-Hispanic householders$65,895 Black householders$2,499 American Indian and Alaska Native householders$79,145 Asian householders$38,791 Some other race householders$129,078 Two or more races householders$63,431 Hispanic or Latino race householdersMedian 2022 house value $328,659 White Non-Hispanic householders$349,976 Black or African American householders $248,248 Asian householders$371,023 Native Hawaiian and other Pacific Islander householders$316,516 Two or more races householders$388,022 Hispanic or Latino householders
Median age by race in Chester
46.5 Median age for White residents42.1 51.7 34.0 Median age for Black or African American residents30.9 39.0 22.3 Median age for American Indian / Alaska Native residents22.3 40.3 38.3 Median age for Asian residents49.3 18.5 11.0 Median age for Native Hawaiian / Pacific Islander residents3.6 13.5 28.1 Median age for Other race residents23.9 44.3 28.5 Median age for Two or more races residents33.1 25.8 46.5 Median age for White alone residents43.0 51.7 26.5 Median age for Hispanic or Latino residents21.4 30.9
Owner/renter occupied households by race in Chester
House owners and renters - White residents 4,874 83.2% Owner occupied984 16.8% Renter occupiedHouse owners and renters - Black or African American residents 1,356 57.0% Owner occupied1,025 43.0% Renter occupiedHouse owners and renters - American Indian / Alaska Native residents 11 24.1% Owner occupied35 75.9% Renter occupiedHouse owners and renters - Asian residents 181 95.8% Owner occupied8 4.2% Renter occupiedHouse owners and renters - Native Hawaiian / Pacific Islander residents 47 100.0% Owner occupiedHouse owners and renters - Other race residents 274 59.7% Owner occupied185 40.3% Renter occupiedHouse owners and renters - Two or more races residents 172 55.0% Owner occupied140 45.0% Renter occupiedHouse owners and renters - White alone residents 4,841 83.3% Owner occupied972 16.7% Renter occupiedHouse owners and renters - Hispanic or Latino residents 496 60.3% Owner occupied326 39.7% Renter occupied
Language usage in Chester
English speakers - Total 88.9% of residents of Chester speak English at home.
8.3% of residents speak Spanish at home 1,097 58.5% Speak English very well777 41.5% Speak English less than very well2.4% of residents speak other language at home 349 64.9% Speak English very well189 35.1% Speak English less than very well
English speakers - Born in the United States 96.2% of residents of Chester speak English at home.
3.2% of residents speak Spanish at home 244 93.5% Speak English very well17 6.5% Speak English less than very well0.4% of residents speak other language at home 29 100.0% Speak English very well
English speakers - Native, born elsewhere 87.3% of residents of Chester speak English at home.
14.7% of residents speak Spanish at home 71 86.6% Speak English very well11 13.4% Speak English less than very well5.7% of residents speak other language at home 32 100.0% Speak English very well
English speakers - Foreign-born 18.3% of residents of Chester speak English at home.
49.6% of residents speak Spanish at home 252 27.6% Speak English very well660 72.4% Speak English less than very well25.6% of residents speak other language at home 289 61.4% Speak English very well182 38.6% Speak English less than very well
White (Caucasian) - Speak only English Native:
97.9% (12,427)Foreign-born:
8.2% (24)
White (Caucasian) - Speak another language Native:
2.3% (287)Foreign-born:
78.6% (228)
Black or African American - Speak only English Native:
98.2% (5,592)Foreign-born:
64.0% (176)
Black or African American - Speak another language Native:
0.9% (53)Foreign-born:
23.6% (65)
American Indian / Alaska Native - Speak another language Native:
20.0% (20)Foreign-born:
100.0% (19)
Asian - Speak only English Native:
96.3% (180)Foreign-born:
25.2% (89)
Other race - Speak only English Native:
32.0% (181)Foreign-born:
6.6% (43)
Other race - Speak another language Native:
66.2% (375)Foreign-born:
89.8% (591)
Two or more races - Speak another language Native:
11.3% (154)Foreign-born:
98.5% (242)
White alone - Speak only English Native:
99.0% (12,359)Foreign-born:
3.9% (5)
White alone - Speak another language Native:
1.0% (126)Foreign-born:
86.9% (115)
Hispanic or Latino - Speak only English Native:
61.9% (988)Foreign-born:
5.1% (52)
Hispanic or Latino - Speak another language Native:
40.3% (643)Foreign-born:
94.7% (968)
Foreign-born residents in Chester 1,773 residents are foreign born (5.4% Latin America , 1.3% Asia ).
This city:
7.4%Virginia:
12.6%
Marital status for residents in Chester Marital status - White (Caucasian) population 15 years and over
Males 24.6% Never married59.2% Now married0.4% Separated5.1% Widowed10.8% DivorcedFemales 18.9% Never married59.4% Now married0.9% Separated12.7% Widowed8.1% DivorcedWomen who gave birth in the past 12 months Now married:
39.3% (97)Unmarried:
60.7% (150)
Women who did not give birth in the past 12 months Now married:
63.1% (1,480)Unmarried:
36.9% (865)
Marital status - Black or African American population 15 years and over
Males 48.8% Never married36.9% Now married0.0% Separated1.7% Widowed12.5% DivorcedFemales 45.8% Never married32.5% Now married2.8% Separated7.5% Widowed11.4% DivorcedWomen who gave birth in the past 12 months Now married:
57.1% (54)Unmarried:
42.9% (41)
Women who did not give birth in the past 12 months Now married:
33.9% (638)Unmarried:
66.1% (1,241)
Marital status - American Indian / Alaska Native population 15 years and over
Males 55.1% Never married44.9% Now married0.0% Separated0.0% Widowed0.0% DivorcedFemales 68.8% Never married31.2% Now married0.0% Separated0.0% Widowed0.0% DivorcedWomen who did not give birth in the past 12 months Now married:
31.2% (11)Unmarried:
68.8% (23)
Marital status - Asian population 15 years and over
Males 21.3% Never married78.7% Now married0.0% Separated0.0% Widowed0.0% DivorcedFemales 38.6% Never married55.4% Now married6.0% Separated0.0% Widowed0.0% DivorcedWomen who did not give birth in the past 12 months Now married:
46.7% (57)Unmarried:
53.3% (65)
Marital status - Native Hawaiian / Pacific Islander population 15 years and over
Males 0.0% Never married100.0% Now married0.0% Separated0.0% Widowed0.0% DivorcedFemales 52.7% Never married47.3% Now married0.0% Separated0.0% Widowed0.0% DivorcedWomen who did not give birth in the past 12 months Now married:
47.3% (27)Unmarried:
52.7% (31)
Marital status - Other race population 15 years and over
Males 81.7% Never married18.3% Now married0.0% Separated0.0% Widowed0.0% DivorcedFemales 49.0% Never married32.9% Now married13.5% Separated0.0% Widowed4.7% DivorcedWomen who did not give birth in the past 12 months Now married:
36.6% (116)Unmarried:
63.4% (201)
Marital status - Two or more races population 15 years and over
Males 52.1% Never married46.6% Now married0.0% Separated0.0% Widowed1.3% DivorcedFemales 46.5% Never married42.3% Now married8.5% Separated0.0% Widowed2.8% DivorcedWomen who gave birth in the past 12 months Now married:
100.0% (42)Unmarried:
0.0% (0)
Women who did not give birth in the past 12 months Now married:
40.4% (168)Unmarried:
59.6% (248)
Marital status - White alone, not Hispanic / Latino population 15 years and over
Males 23.9% Never married59.8% Now married0.4% Separated4.7% Widowed11.2% DivorcedFemales 17.9% Never married60.6% Now married0.9% Separated12.6% Widowed7.9% DivorcedWomen who gave birth in the past 12 months Now married:
45.9% (100)Unmarried:
54.1% (118)
Women who did not give birth in the past 12 months Now married:
63.1% (1,447)Unmarried:
36.9% (845)
Marital status - Hispanic or Latino population 15 years and over
Males 69.3% Never married27.7% Now married0.0% Separated3.1% Widowed0.0% DivorcedFemales 51.5% Never married32.0% Now married6.1% Separated4.4% Widowed5.9% DivorcedWomen who gave birth in the past 12 months Now married:
43.1% (33)Unmarried:
56.9% (44)
Women who did not give birth in the past 12 months Now married:
43.8% (354)Unmarried:
56.2% (455)
Ancestries in Chester
1,746 15.0% American1,539 13.2% English830 7.1% German432 3.7% Irish176 1.5% Polish142 1.2% European142 1.2% Italian100 0.9% Scotch-Irish64 0.5% Swedish62 0.5% African61 0.5% Nigerian57 0.5% Romanian51 0.4% Scottish50 0.4% Slovak39 0.3% Jamaican30 0.3% French28 0.2% British22 0.2% Austrian19 0.2% Dutch19 0.2% Portuguese17 0.1% Hungarian16 0.1% Belgian15 0.1% French Canadian15 0.1% Pennsylvania German15 0.1% Trinidadian and Tobagonian13 0.1% Danish12 0.1% Czech12 0.1% Norwegian8 0.07% Eastern European7 0.06% Alsatian2 0.02% Lebanese
Geographical mobility in Chester Same house 1 year ago 12,037 90.2% White (Caucasian)5,177 82.1% Black or African American113 76.8% American Indian / Alaska Native470 96.8% Asian250 95.3% Native Hawaiian / Pacific Islander1,240 80.8% Other race1,384 80.0% Two or more races11,751 90.4% White alone, not Hispanic / Latino2,320 80.9% Hispanic or LatinoMoved within same county 497 3.7% White / Caucasian233 3.7% Black or African American65 4.3% Other race107 6.2% Two or more races505 3.9% White alone, not Hispanic / Latino61 2.1% Hispanic or LatinoMoved within same state 341 2.6% White / Caucasian890 14.1% Black or African American207 13.5% Other race226 1.7% White alone, not Hispanic / Latino419 14.6% Hispanic or LatinoMoved from different state 463 3.5% White / Caucasian28 0.4% Black or African American21 1.4% Other race220 12.7% Two or more races499 3.8% White alone, not Hispanic / Latino82 2.9% Hispanic or LatinoMoved from abroad 7 0.1% White6 0.1% Black or African American37 25.1% American Indian / Alaska Native13 2.7% Asian9 0.1% White alone, not Hispanic / Latino
Children Nativity (place of birth) in Chester
Children under 6 years - Living with two parents Both parents native 830 100.0% NativeBoth parents foreign-born 33 100.0% NativeOne native, one foreign-born parent 113 100.0% NativeChildren under 6 years - Living with one parent Native parent 317 100.0% NativeForeign-born parent 111 100.0% NativeChildren 6 to 17 years - Living with two parents Both parents native 2,031 100.0% NativeBoth parents foreign-born 151 73.2% Native55 26.8% Foreign-bornOne native, one foreign-born parent 81 100.0% NativeChildren 6 to 17 years - Living with one parent Native parent 1,167 100.0% NativeForeign-born parent 105 46.9% Native119 53.1% Foreign-born
Grandparents responsible for own grandchildren in Chester
Grandparents (30 to 59 years) White / Caucasian 34 55.0% Responsible for grandchildren28 45.0% Not responsible for grandchildrenBlack or African American 30 100.0% Responsible for grandchildrenWhite alone, not Hispanic / Latino 34 53.2% Responsible for grandchildren30 46.8% Not responsible for grandchildrenGrandparents (60 years and over) White / Caucasian 42 37.4% Responsible for grandchildren71 62.6% Not responsible for grandchildrenBlack or African American 69 100.0% Not responsible for grandchildrenWhite alone, not Hispanic / Latino 31 29.2% Responsible for grandchildren75 70.8% Not responsible for grandchildren