Races in Colleyville, Texas (TX) Detailed Stats
Data:
Races - White alone (%)
Races - White alone (% change since 2000)
Races - Black alone (%)
Races - Black alone (% change since 2000)
Races - American Indian alone (%)
Races - American Indian alone (% change since 2000)
Races - Asian alone (%)
Races - Asian alone (% change since 2000)
Races - Hispanic (%)
Races - Hispanic (% change since 2000)
Races - Native Hawaiian and Other Pacific Islander alone (%)
Races - Native Hawaiian and Other Pacific Islander alone (% change since 2000)
Races - Two or more races(%)
Races - Two or more races(% change since 2000)
Races - Other race alone (%)
Races - Other race alone (% change since 2000)
Racial diversity
Place of birth - Born in state of residence (%)
Place of birth - Born in state of residence (%) - White
Place of birth - Born in state of residence (%) - Black or African American
Place of birth - Born in state of residence (%) - Asian
Place of birth - Born in state of residence (%) - Hispanic or Latino
Place of birth - Born in state of residence (%) - American Indian and Alaska Native
Place of birth - Born in state of residence (%) - Multirace
Place of birth - Born in state of residence (%) - Other Race
Place of birth - Born in other state (%)
Place of birth - Born in other state (%) - White
Place of birth - Born in other state (%) - Black or African American
Place of birth - Born in other state (%) - Asian
Place of birth - Born in other state (%) - Hispanic or Latino
Place of birth - Born in other state (%) - American Indian and Alaska Native
Place of birth - Born in other state (%) - Multirace
Place of birth - Born in other state (%) - Other Race
Place of birth - Native, outside of US (%)
Place of birth - Native, outside of US (%) - White
Place of birth - Native, outside of US (%) - Black or African American
Place of birth - Native, outside of US (%) - Asian
Place of birth - Native, outside of US (%) - Hispanic or Latino
Place of birth - Native, outside of US (%) - American Indian and Alaska Native
Place of birth - Native, outside of US (%) - Multirace
Place of birth - Native, outside of US (%) - Other Race
Place of birth - Foreign born (%)
Place of birth - Foreign born (%) - White
Place of birth - Foreign born (%) - Black or African American
Place of birth - Foreign born (%) - Asian
Place of birth - Foreign born (%) - Hispanic or Latino
Place of birth - Foreign born (%) - American Indian and Alaska Native
Place of birth - Foreign born (%) - Multirace
Place of birth - Foreign born (%) - Other Race
Residents speaking English at home (%)
Residents speaking English at home - Born in the United States (%)
Residents speaking English at home - Native, born elsewhere (%)
Residents speaking English at home - Foreign born (%)
Residents speaking Spanish at home (%)
Residents speaking Spanish at home - Born in the United States (%)
Residents speaking Spanish at home - Native, born elsewhere (%)
Residents speaking Spanish at home - Foreign born (%)
Residents speaking other language at home (%)
Residents speaking other language at home - Born in the United States (%)
Residents speaking other language at home - Native, born elsewhere (%)
Residents speaking other language at home - Foreign born (%)
Marital status - Never married (%)
Marital status - Now married (%)
Marital status - Separated (%)
Marital status - Widowed (%)
Marital status - Divorced (%)
Ancestries Reported - Arab (%)
Ancestries Reported - Czech (%)
Ancestries Reported - Danish (%)
Ancestries Reported - Dutch (%)
Ancestries Reported - English (%)
Ancestries Reported - French (%)
Ancestries Reported - French Canadian (%)
Ancestries Reported - German (%)
Ancestries Reported - Greek (%)
Ancestries Reported - Hungarian (%)
Ancestries Reported - Irish (%)
Ancestries Reported - Italian (%)
Ancestries Reported - Lithuanian (%)
Ancestries Reported - Norwegian (%)
Ancestries Reported - Polish (%)
Ancestries Reported - Portuguese (%)
Ancestries Reported - Russian (%)
Ancestries Reported - Scotch-Irish (%)
Ancestries Reported - Scottish (%)
Ancestries Reported - Slovak (%)
Ancestries Reported - Subsaharan African (%)
Ancestries Reported - Swedish (%)
Ancestries Reported - Swiss (%)
Ancestries Reported - Ukrainian (%)
Ancestries Reported - United States (%)
Ancestries Reported - Welsh (%)
Ancestries Reported - West Indian (%)
Ancestries Reported - Other (%)
Geographical mobility - Same house 1 year ago (%)
Geographical mobility - Same house 1 year ago (%) - White
Geographical mobility - Same house 1 year ago (%) - Black or African American
Geographical mobility - Same house 1 year ago (%) - Asian
Geographical mobility - Same house 1 year ago (%) - Hispanic or Latino
Geographical mobility - Same house 1 year ago (%) - American Indian and Alaska Native
Geographical mobility - Same house 1 year ago (%) - Multirace
Geographical mobility - Same house 1 year ago (%) - Other Race
Geographical mobility - Moved within same county (%)
Geographical mobility - Moved within same county (%) - White
Geographical mobility - Moved within same county (%) - Black or African American
Geographical mobility - Moved within same county (%) - Asian
Geographical mobility - Moved within same county (%) - Hispanic or Latino
Geographical mobility - Moved within same county (%) - American Indian and Alaska Native
Geographical mobility - Moved within same county (%) - Multirace
Geographical mobility - Moved within same county (%) - Other Race
Geographical mobility - Moved from different county within same state (%)
Geographical mobility - Moved from different county within same state (%) - White
Geographical mobility - Moved from different county within same state (%) - Black or African American
Geographical mobility - Moved from different county within same state (%) - Asian
Geographical mobility - Moved from different county within same state (%) - Hispanic or Latino
Geographical mobility - Moved from different county within same state (%) - American Indian and Alaska Native
Geographical mobility - Moved from different county within same state (%) - Multirace
Geographical mobility - Moved from different county within same state (%) - Other Race
Geographical mobility - Moved from different state (%)
Geographical mobility - Moved from different state (%) - White
Geographical mobility - Moved from different state (%) - Black or African American
Geographical mobility - Moved from different state (%) - Asian
Geographical mobility - Moved from different state (%) - Hispanic or Latino
Geographical mobility - Moved from different state (%) - American Indian and Alaska Native
Geographical mobility - Moved from different state (%) - Multirace
Geographical mobility - Moved from different state (%) - Other Race
Geographical mobility - Moved from abroad (%)
Geographical mobility - Moved from abroad (%) - White
Geographical mobility - Moved from abroad (%) - Black or African American
Geographical mobility - Moved from abroad (%) - Asian
Geographical mobility - Moved from abroad (%) - Hispanic or Latino
Geographical mobility - Moved from abroad (%) - American Indian and Alaska Native
Geographical mobility - Moved from abroad (%) - Multirace
Geographical mobility - Moved from abroad (%) - Other Race
Place of birth for the foreign-born population - Ireland (%)
Place of birth for the foreign-born population - Denmark (%)
Place of birth for the foreign-born population - Norway (%)
Place of birth for the foreign-born population - Sweden (%)
Place of birth for the foreign-born population - United Kingdom (%)
Place of birth for the foreign-born population - England (%)
Place of birth for the foreign-born population - Scotland (%)
Place of birth for the foreign-born population - Other Northern Europe (%)
Place of birth for the foreign-born population - Austria (%)
Place of birth for the foreign-born population - Belgium (%)
Place of birth for the foreign-born population - France (%)
Place of birth for the foreign-born population - Germany (%)
Place of birth for the foreign-born population - Netherlands (%)
Place of birth for the foreign-born population - Switzerland (%)
Place of birth for the foreign-born population - Other Western Europe (%)
Place of birth for the foreign-born population - Greece (%)
Place of birth for the foreign-born population - Italy (%)
Place of birth for the foreign-born population - Portugal (%)
Place of birth for the foreign-born population - Spain (%)
Place of birth for the foreign-born population - Other Southern Europe (%)
Place of birth for the foreign-born population - Albania (%)
Place of birth for the foreign-born population - Belarus (%)
Place of birth for the foreign-born population - Bosnia and Herzegovina (%)
Place of birth for the foreign-born population - Bulgaria (%)
Place of birth for the foreign-born population - Croatia (%)
Place of birth for the foreign-born population - Czechoslovakia (%)
Place of birth for the foreign-born population - Hungary (%)
Place of birth for the foreign-born population - Latvia (%)
Place of birth for the foreign-born population - Lithuania (%)
Place of birth for the foreign-born population - North Macedonia (Macedonia) (%)
Place of birth for the foreign-born population - Moldova (%)
Place of birth for the foreign-born population - Poland (%)
Place of birth for the foreign-born population - Romania (%)
Place of birth for the foreign-born population - Russia (%)
Place of birth for the foreign-born population - Serbia (%)
Place of birth for the foreign-born population - Ukraine (%)
Place of birth for the foreign-born population - Other Eastern Europe (%)
Place of birth for the foreign-born population - China (%)
Place of birth for the foreign-born population - Hong Kong (%)
Place of birth for the foreign-born population - Taiwan (%)
Place of birth for the foreign-born population - Japan (%)
Place of birth for the foreign-born population - Korea (%)
Place of birth for the foreign-born population - Other Eastern Asia (%)
Place of birth for the foreign-born population - Afghanistan (%)
Place of birth for the foreign-born population - Bangladesh (%)
Place of birth for the foreign-born population - India (%)
Place of birth for the foreign-born population - Iran (%)
Place of birth for the foreign-born population - Kazakhstan (%)
Place of birth for the foreign-born population - Nepal (%)
Place of birth for the foreign-born population - Pakistan (%)
Place of birth for the foreign-born population - Sri Lanka (%)
Place of birth for the foreign-born population - Uzbekistan (%)
Place of birth for the foreign-born population - Other South Central Asia (%)
Place of birth for the foreign-born population - Burma (%)
Place of birth for the foreign-born population - Cambodia (%)
Place of birth for the foreign-born population - Indonesia (%)
Place of birth for the foreign-born population - Laos (%)
Place of birth for the foreign-born population - Malaysia (%)
Place of birth for the foreign-born population - Philippines (%)
Place of birth for the foreign-born population - Singapore (%)
Place of birth for the foreign-born population - Thailand (%)
Place of birth for the foreign-born population - Vietnam (%)
Place of birth for the foreign-born population - Other South Eastern Asia (%)
Place of birth for the foreign-born population - Armenia (%)
Place of birth for the foreign-born population - Iraq (%)
Place of birth for the foreign-born population - Israel (%)
Place of birth for the foreign-born population - Jordan (%)
Place of birth for the foreign-born population - Kuwait (%)
Place of birth for the foreign-born population - Lebanon (%)
Place of birth for the foreign-born population - Saudi Arabia (%)
Place of birth for the foreign-born population - Syria (%)
Place of birth for the foreign-born population - Turkey (%)
Place of birth for the foreign-born population - Yemen (%)
Place of birth for the foreign-born population - Other Western Asia (%)
Place of birth for the foreign-born population - Eritrea (%)
Place of birth for the foreign-born population - Ethiopia (%)
Place of birth for the foreign-born population - Kenya (%)
Place of birth for the foreign-born population - Somalia (%)
Place of birth for the foreign-born population - Uganda (%)
Place of birth for the foreign-born population - Zimbabwe (%)
Place of birth for the foreign-born population - Other Eastern Africa (%)
Place of birth for the foreign-born population - Cameroon (%)
Place of birth for the foreign-born population - Congo (%)
Place of birth for the foreign-born population - Democratic Republic of Congo (Zaire) (%)
Place of birth for the foreign-born population - Other Middle Africa (%)
Place of birth for the foreign-born population - Egypt (%)
Place of birth for the foreign-born population - Morocco (%)
Place of birth for the foreign-born population - Sudan (%)
Place of birth for the foreign-born population - Other Northern Africa (%)
Place of birth for the foreign-born population - South Africa (%)
Place of birth for the foreign-born population - Other Southern Africa (%)
Place of birth for the foreign-born population - Cabo Verde (%)
Place of birth for the foreign-born population - Ghana (%)
Place of birth for the foreign-born population - Liberia (%)
Place of birth for the foreign-born population - Nigeria (%)
Place of birth for the foreign-born population - Senegal (%)
Place of birth for the foreign-born population - Sierra Leone (%)
Place of birth for the foreign-born population - Other Western Africa (%)
Place of birth for the foreign-born population - Australia (%)
Place of birth for the foreign-born population - New Zealand (%)
Place of birth for the foreign-born population - Fiji (%)
Place of birth for the foreign-born population - Micronesia (%)
Place of birth for the foreign-born population - Bahamas (%)
Place of birth for the foreign-born population - Barbados (%)
Place of birth for the foreign-born population - Cuba (%)
Place of birth for the foreign-born population - Dominica (%)
Place of birth for the foreign-born population - Dominican Republic (%)
Place of birth for the foreign-born population - Grenada (%)
Place of birth for the foreign-born population - Haiti (%)
Place of birth for the foreign-born population - Jamaica (%)
Place of birth for the foreign-born population - St. Vincent and the Grenadines (%)
Place of birth for the foreign-born population - Trinidad and Tobago (%)
Place of birth for the foreign-born population - West Indies (%)
Place of birth for the foreign-born population - Other Caribbean (%)
Place of birth for the foreign-born population - Belize (%)
Place of birth for the foreign-born population - Costa Rica (%)
Place of birth for the foreign-born population - El Salvador (%)
Place of birth for the foreign-born population - Guatemala (%)
Place of birth for the foreign-born population - Honduras (%)
Place of birth for the foreign-born population - Mexico (%)
Place of birth for the foreign-born population - Nicaragua (%)
Place of birth for the foreign-born population - Panama (%)
Place of birth for the foreign-born population - Other Central America (%)
Place of birth for the foreign-born population - Argentina (%)
Place of birth for the foreign-born population - Bolivia (%)
Place of birth for the foreign-born population - Brazil (%)
Place of birth for the foreign-born population - Chile (%)
Place of birth for the foreign-born population - Colombia (%)
Place of birth for the foreign-born population - Ecuador (%)
Place of birth for the foreign-born population - Guyana (%)
Place of birth for the foreign-born population - Peru (%)
Place of birth for the foreign-born population - Uruguay (%)
Place of birth for the foreign-born population - Venezuela (%)
Place of birth for the foreign-born population - Other South America (%)
Place of birth for the foreign-born population - Canada (%)
Place of birth for the foreign-born population - Other Northern America (%)
Place of birth for the foreign-born population - Other (%)
Latest news about races in Colleyville, TX collected exclusively by city-data.com from local newspapers, TV, and radio stations
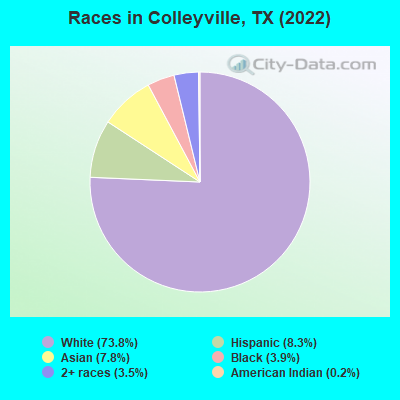
According to 2022 data, the most numerous races in Colleyville, TX are Hispanic (2,202 residents), White alone (19,456 residents), and Black alone (1,027 residents). 89.5% of Colleyville residents speak English at home. 9.3% of Colleyville, TX residents are foreign-born (5.5% born in Asia, 1.5% born in Europe, 1.3% born in Latin America), which is 83.5% less than the foreign-born rate of 17.0% across the entire state of Texas.
Race distribution in Colleyville
2000 2022
10,933,313 52.4% White alone 6,669,666 32.0% Hispanic 2,364,255 11.3% Black alone 554,445 2.7% Asian alone 230,567 1.1% Two or more races 68,859 0.3% American Indian alone 19,958 0.10% Other race alone 10,757 0.05% Native Hawaiian and Other
12,070,642 40.2% Hispanic 11,683,430 38.9% White alone 3,508,706 11.7% Black alone 1,608,173 5.4% Asian alone 956,560 3.2% Two or more races 125,763 0.4% Other race alone 47,023 0.2% American Indian alone 29,275 0.10% Native Hawaiian and Other
Income and house value in Colleyville Median household income in 2022 $178,304 White non-Hispanic householdersover $200,000 Black householdersover $200,000 Asian householdersover $200,000 Two or more races householdersover $200,000 Hispanic or Latino race householdersMedian 2022 house value $785,347 White Non-Hispanic householders$772,501 Black or African American householders$441,721 American Indian or Alaska Native householders $706,520 Asian householders$577,770 Some other race householders$797,609 Two or more races householders$673,530 Hispanic or Latino householders
Median age by race in Colleyville
51.7 Median age for White residents48.4 53.8 45.3 Median age for Black or African American residents38.0 46.2 -831,349,205.5 Median age for American Indian / Alaska Native residents-867,996,200.5 -763,406,939.3 50.6 Median age for Asian residents51.5 48.6 -565,040,649.8 Median age for Native Hawaiian / Pacific Islander residents-550,102,248.9 -551,928,782.8 68.0 Median age for Other race residents72.5 -682,703,321.2 15.8 Median age for Two or more races residents16.1 16.1 50.2 Median age for White alone residents46.7 52.0 20.5 Median age for Hispanic or Latino residents17.9 36.2
Owner/renter occupied households by race in Colleyville
House owners and renters - White residents 7,053 96.3% Owner occupied268 3.7% Renter occupiedHouse owners and renters - Black or African American residents 358 90.6% Owner occupied37 9.4% Renter occupiedHouse owners and renters - American Indian / Alaska Native residents 105 100.0% Owner occupiedHouse owners and renters - Asian residents 680 100.0% Owner occupiedHouse owners and renters - Other race residents 29 100.0% Renter occupiedHouse owners and renters - Two or more races residents 752 100.0% Owner occupiedHouse owners and renters - White alone residents 7,453 96.1% Owner occupied305 3.9% Renter occupiedHouse owners and renters - Hispanic or Latino residents 432 91.5% Owner occupied40 8.5% Renter occupied
Language usage in Colleyville
English speakers - Total 89.5% of residents of Colleyville speak English at home.
2.7% of residents speak Spanish at home 588 85.7% Speak English very well98 14.3% Speak English less than very well7.2% of residents speak other language at home 1,545 85.2% Speak English very well269 14.8% Speak English less than very well
English speakers - Born in the United States 97.0% of residents of Colleyville speak English at home.
0.8% of residents speak Spanish at home 95 100.0% Speak English very well0.8% of residents speak other language at home 98 100.0% Speak English very well
English speakers - Native, born elsewhere 95.3% of residents of Colleyville speak English at home.
10.0% of residents speak Spanish at home 28 100.0% Speak English very well
English speakers - Foreign-born 31.4% of residents of Colleyville speak English at home.
10.1% of residents speak Spanish at home 143 59.1% Speak English very well99 40.9% Speak English less than very well58.2% of residents speak other language at home 1,127 80.8% Speak English very well267 19.2% Speak English less than very well
White (Caucasian) - Speak only English Native:
100.0% (17,635)Foreign-born:
100.0% (384)
White (Caucasian) - Speak another language Native:
0.7% (117)Foreign-born:
33.9% (130)
Black or African American - Speak another language Native:
1.3% (13)Foreign-born:
100.0% (27)
Asian - Speak only English Native:
40.4% (204)Foreign-born:
20.5% (304)
Asian - Speak another language Native:
56.6% (286)Foreign-born:
80.7% (1,194)
Two or more races - Speak only English Native:
72.9% (1,819)Foreign-born:
10.3% (38)
Two or more races - Speak another language Native:
16.8% (418)Foreign-born:
85.7% (317)
White alone - Speak only English Native:
99.6% (18,361)Foreign-born:
74.8% (411)
White alone - Speak another language Native:
0.8% (140)Foreign-born:
33.7% (185)
Hispanic or Latino - Speak only English Native:
77.7% (1,376)Foreign-born:
15.2% (35)
Hispanic or Latino - Speak another language Native:
19.6% (348)Foreign-born:
84.2% (193)
Foreign-born residents in Colleyville 2,443 residents are foreign born (5.5% Asia , 1.5% Europe , 1.3% Latin America ).
This city:
9.3%Texas:
17.1%
Marital status for residents in Colleyville Marital status - White (Caucasian) population 15 years and over
Males 23.6% Never married68.9% Now married0.3% Separated1.7% Widowed5.6% DivorcedFemales 13.5% Never married72.0% Now married0.6% Separated4.9% Widowed9.1% DivorcedWomen who gave birth in the past 12 months Now married:
100.0% (31)Unmarried:
0.0% (0)
Women who did not give birth in the past 12 months Now married:
68.0% (1,969)Unmarried:
32.0% (928)
Marital status - Black or African American population 15 years and over
Males 26.5% Never married73.5% Now married0.0% Separated0.0% Widowed0.0% DivorcedFemales 0.3% Never married70.7% Now married4.0% Separated0.0% Widowed25.1% DivorcedWomen who gave birth in the past 12 months Now married:
100.0% (12)Unmarried:
0.0% (0)
Women who did not give birth in the past 12 months Now married:
93.3% (162)Unmarried:
6.7% (12)
Marital status - Asian population 15 years and over
Males 25.2% Never married74.8% Now married0.0% Separated0.0% Widowed0.0% DivorcedFemales 6.1% Never married78.0% Now married0.0% Separated10.0% Widowed5.8% DivorcedWomen who did not give birth in the past 12 months Now married:
88.1% (473)Unmarried:
11.9% (64)
Marital status - Other race population 15 years and over
Males 39.7% Never married60.3% Now married0.0% Separated0.0% Widowed0.0% DivorcedFemales 28.6% Never married71.4% Now married0.0% Separated0.0% Widowed0.0% DivorcedWomen who did not give birth in the past 12 months Now married:
0.0% (0)Unmarried:
100.0% (15)
Marital status - Two or more races population 15 years and over
Males 13.0% Never married75.8% Now married0.0% Separated3.5% Widowed7.6% DivorcedFemales 17.8% Never married67.3% Now married0.0% Separated1.9% Widowed13.0% DivorcedWomen who did not give birth in the past 12 months Now married:
46.6% (164)Unmarried:
53.4% (188)
Marital status - White alone, not Hispanic / Latino population 15 years and over
Males 23.9% Never married68.8% Now married0.3% Separated1.7% Widowed5.3% DivorcedFemales 13.9% Never married71.6% Now married0.6% Separated4.7% Widowed9.3% DivorcedWomen who gave birth in the past 12 months Now married:
100.0% (36)Unmarried:
0.0% (0)
Women who did not give birth in the past 12 months Now married:
67.1% (2,146)Unmarried:
32.9% (1,054)
Marital status - Hispanic or Latino population 15 years and over
Males 13.7% Never married72.3% Now married0.0% Separated3.1% Widowed10.9% DivorcedFemales 8.3% Never married84.2% Now married0.0% Separated7.6% Widowed0.0% DivorcedWomen who did not give birth in the past 12 months Now married:
78.4% (138)Unmarried:
21.6% (38)
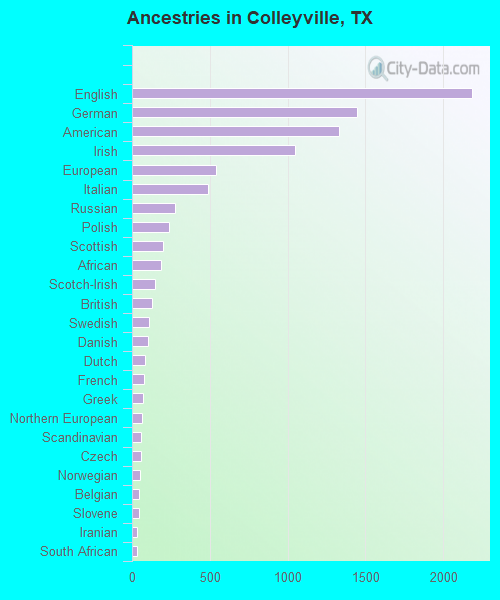
Ancestries in Colleyville
2,186 17.4% English1,448 11.5% German1,332 10.6% American1,049 8.3% Irish542 4.3% European486 3.9% Italian278 2.2% Russian238 1.9% Polish202 1.6% Scottish188 1.5% African147 1.2% Scotch-Irish128 1.0% British112 0.9% Swedish104 0.8% Danish82 0.7% Dutch80 0.6% French68 0.5% Greek64 0.5% Northern European56 0.4% Scandinavian56 0.4% Czech54 0.4% Norwegian48 0.4% Belgian43 0.3% Slovene33 0.3% Iranian31 0.2% South African29 0.2% Eastern European25 0.2% French Canadian25 0.2% Austrian24 0.2% Welsh21 0.2% Canadian20 0.2% Slavic20 0.2% Trinidadian and Tobagonian19 0.2% Portuguese16 0.1% Brazilian14 0.1% Armenian12 0.10% Lebanese11 0.09% Hungarian11 0.09% Turkish9 0.07% Czechoslovakian9 0.07% Swiss8 0.06% Finnish7 0.06% Slovak2 0.02% Egyptian
Geographical mobility in Colleyville Same house 1 year ago 16,537 91.5% White (Caucasian)1,019 98.1% Black or African American92 100.0% American Indian / Alaska Native2,025 98.8% Asian113 100.0% Other race3,418 95.7% Two or more races17,827 91.6% White alone, not Hispanic / Latino2,115 96.4% Hispanic or LatinoMoved within same county 782 4.3% White / Caucasian16 1.5% Black or African American117 3.3% Two or more races857 4.4% White alone, not Hispanic / Latino57 2.6% Hispanic or LatinoMoved within same state 451 2.5% White / Caucasian442 2.3% White alone, not Hispanic / Latino41 1.9% Hispanic or LatinoMoved from different state 320 1.8% White / Caucasian11 0.3% Two or more races344 1.8% White alone, not Hispanic / LatinoMoved from abroad 24 0.1% White18 0.9% Asian6 0.2% Two or more races31 0.2% White alone, not Hispanic / Latino
Children Nativity (place of birth) in Colleyville
Children under 6 years - Living with two parents Both parents native 1,088 100.0% Native0 0.0% Foreign-bornBoth parents foreign-born 115 89.6% Native13 10.4% Foreign-bornOne native, one foreign-born parent 36 90.0% Native4 10.0% Foreign-bornChildren under 6 years - Living with one parent Native parent 52 100.0% Native
Children 6 to 17 years - Living with two parents Both parents native 3,760 100.0% Native1 0.0% Foreign-bornBoth parents foreign-born 356 96.3% Native14 3.7% Foreign-bornOne native, one foreign-born parent 263 100.0% NativeChildren 6 to 17 years - Living with one parent Native parent 366 100.0% Native
Grandparents responsible for own grandchildren in Colleyville
Grandparents (30 to 59 years) White / Caucasian 41 100.0% Not responsible for grandchildrenWhite alone, not Hispanic / Latino 52 100.0% Not responsible for grandchildrenGrandparents (60 years and over) White / Caucasian 77 46.8% Responsible for grandchildren87 53.2% Not responsible for grandchildrenWhite alone, not Hispanic / Latino 83 47.8% Responsible for grandchildren90 52.2% Not responsible for grandchildren