Races in Gallup, New Mexico (NM) Detailed Stats
Data:
Races - White alone (%)
Races - White alone (% change since 2000)
Races - Black alone (%)
Races - Black alone (% change since 2000)
Races - American Indian alone (%)
Races - American Indian alone (% change since 2000)
Races - Asian alone (%)
Races - Asian alone (% change since 2000)
Races - Hispanic (%)
Races - Hispanic (% change since 2000)
Races - Native Hawaiian and Other Pacific Islander alone (%)
Races - Native Hawaiian and Other Pacific Islander alone (% change since 2000)
Races - Two or more races(%)
Races - Two or more races(% change since 2000)
Races - Other race alone (%)
Races - Other race alone (% change since 2000)
Racial diversity
Place of birth - Born in state of residence (%)
Place of birth - Born in state of residence (%) - White
Place of birth - Born in state of residence (%) - Black or African American
Place of birth - Born in state of residence (%) - Asian
Place of birth - Born in state of residence (%) - Hispanic or Latino
Place of birth - Born in state of residence (%) - American Indian and Alaska Native
Place of birth - Born in state of residence (%) - Multirace
Place of birth - Born in state of residence (%) - Other Race
Place of birth - Born in other state (%)
Place of birth - Born in other state (%) - White
Place of birth - Born in other state (%) - Black or African American
Place of birth - Born in other state (%) - Asian
Place of birth - Born in other state (%) - Hispanic or Latino
Place of birth - Born in other state (%) - American Indian and Alaska Native
Place of birth - Born in other state (%) - Multirace
Place of birth - Born in other state (%) - Other Race
Place of birth - Native, outside of US (%)
Place of birth - Native, outside of US (%) - White
Place of birth - Native, outside of US (%) - Black or African American
Place of birth - Native, outside of US (%) - Asian
Place of birth - Native, outside of US (%) - Hispanic or Latino
Place of birth - Native, outside of US (%) - American Indian and Alaska Native
Place of birth - Native, outside of US (%) - Multirace
Place of birth - Native, outside of US (%) - Other Race
Place of birth - Foreign born (%)
Place of birth - Foreign born (%) - White
Place of birth - Foreign born (%) - Black or African American
Place of birth - Foreign born (%) - Asian
Place of birth - Foreign born (%) - Hispanic or Latino
Place of birth - Foreign born (%) - American Indian and Alaska Native
Place of birth - Foreign born (%) - Multirace
Place of birth - Foreign born (%) - Other Race
Residents speaking English at home (%)
Residents speaking English at home - Born in the United States (%)
Residents speaking English at home - Native, born elsewhere (%)
Residents speaking English at home - Foreign born (%)
Residents speaking Spanish at home (%)
Residents speaking Spanish at home - Born in the United States (%)
Residents speaking Spanish at home - Native, born elsewhere (%)
Residents speaking Spanish at home - Foreign born (%)
Residents speaking other language at home (%)
Residents speaking other language at home - Born in the United States (%)
Residents speaking other language at home - Native, born elsewhere (%)
Residents speaking other language at home - Foreign born (%)
Marital status - Never married (%)
Marital status - Now married (%)
Marital status - Separated (%)
Marital status - Widowed (%)
Marital status - Divorced (%)
Ancestries Reported - Arab (%)
Ancestries Reported - Czech (%)
Ancestries Reported - Danish (%)
Ancestries Reported - Dutch (%)
Ancestries Reported - English (%)
Ancestries Reported - French (%)
Ancestries Reported - French Canadian (%)
Ancestries Reported - German (%)
Ancestries Reported - Greek (%)
Ancestries Reported - Hungarian (%)
Ancestries Reported - Irish (%)
Ancestries Reported - Italian (%)
Ancestries Reported - Lithuanian (%)
Ancestries Reported - Norwegian (%)
Ancestries Reported - Polish (%)
Ancestries Reported - Portuguese (%)
Ancestries Reported - Russian (%)
Ancestries Reported - Scotch-Irish (%)
Ancestries Reported - Scottish (%)
Ancestries Reported - Slovak (%)
Ancestries Reported - Subsaharan African (%)
Ancestries Reported - Swedish (%)
Ancestries Reported - Swiss (%)
Ancestries Reported - Ukrainian (%)
Ancestries Reported - United States (%)
Ancestries Reported - Welsh (%)
Ancestries Reported - West Indian (%)
Ancestries Reported - Other (%)
Geographical mobility - Same house 1 year ago (%)
Geographical mobility - Same house 1 year ago (%) - White
Geographical mobility - Same house 1 year ago (%) - Black or African American
Geographical mobility - Same house 1 year ago (%) - Asian
Geographical mobility - Same house 1 year ago (%) - Hispanic or Latino
Geographical mobility - Same house 1 year ago (%) - American Indian and Alaska Native
Geographical mobility - Same house 1 year ago (%) - Multirace
Geographical mobility - Same house 1 year ago (%) - Other Race
Geographical mobility - Moved within same county (%)
Geographical mobility - Moved within same county (%) - White
Geographical mobility - Moved within same county (%) - Black or African American
Geographical mobility - Moved within same county (%) - Asian
Geographical mobility - Moved within same county (%) - Hispanic or Latino
Geographical mobility - Moved within same county (%) - American Indian and Alaska Native
Geographical mobility - Moved within same county (%) - Multirace
Geographical mobility - Moved within same county (%) - Other Race
Geographical mobility - Moved from different county within same state (%)
Geographical mobility - Moved from different county within same state (%) - White
Geographical mobility - Moved from different county within same state (%) - Black or African American
Geographical mobility - Moved from different county within same state (%) - Asian
Geographical mobility - Moved from different county within same state (%) - Hispanic or Latino
Geographical mobility - Moved from different county within same state (%) - American Indian and Alaska Native
Geographical mobility - Moved from different county within same state (%) - Multirace
Geographical mobility - Moved from different county within same state (%) - Other Race
Geographical mobility - Moved from different state (%)
Geographical mobility - Moved from different state (%) - White
Geographical mobility - Moved from different state (%) - Black or African American
Geographical mobility - Moved from different state (%) - Asian
Geographical mobility - Moved from different state (%) - Hispanic or Latino
Geographical mobility - Moved from different state (%) - American Indian and Alaska Native
Geographical mobility - Moved from different state (%) - Multirace
Geographical mobility - Moved from different state (%) - Other Race
Geographical mobility - Moved from abroad (%)
Geographical mobility - Moved from abroad (%) - White
Geographical mobility - Moved from abroad (%) - Black or African American
Geographical mobility - Moved from abroad (%) - Asian
Geographical mobility - Moved from abroad (%) - Hispanic or Latino
Geographical mobility - Moved from abroad (%) - American Indian and Alaska Native
Geographical mobility - Moved from abroad (%) - Multirace
Geographical mobility - Moved from abroad (%) - Other Race
Place of birth for the foreign-born population - Ireland (%)
Place of birth for the foreign-born population - Denmark (%)
Place of birth for the foreign-born population - Norway (%)
Place of birth for the foreign-born population - Sweden (%)
Place of birth for the foreign-born population - United Kingdom (%)
Place of birth for the foreign-born population - England (%)
Place of birth for the foreign-born population - Scotland (%)
Place of birth for the foreign-born population - Other Northern Europe (%)
Place of birth for the foreign-born population - Austria (%)
Place of birth for the foreign-born population - Belgium (%)
Place of birth for the foreign-born population - France (%)
Place of birth for the foreign-born population - Germany (%)
Place of birth for the foreign-born population - Netherlands (%)
Place of birth for the foreign-born population - Switzerland (%)
Place of birth for the foreign-born population - Other Western Europe (%)
Place of birth for the foreign-born population - Greece (%)
Place of birth for the foreign-born population - Italy (%)
Place of birth for the foreign-born population - Portugal (%)
Place of birth for the foreign-born population - Spain (%)
Place of birth for the foreign-born population - Other Southern Europe (%)
Place of birth for the foreign-born population - Albania (%)
Place of birth for the foreign-born population - Belarus (%)
Place of birth for the foreign-born population - Bosnia and Herzegovina (%)
Place of birth for the foreign-born population - Bulgaria (%)
Place of birth for the foreign-born population - Croatia (%)
Place of birth for the foreign-born population - Czechoslovakia (%)
Place of birth for the foreign-born population - Hungary (%)
Place of birth for the foreign-born population - Latvia (%)
Place of birth for the foreign-born population - Lithuania (%)
Place of birth for the foreign-born population - North Macedonia (Macedonia) (%)
Place of birth for the foreign-born population - Moldova (%)
Place of birth for the foreign-born population - Poland (%)
Place of birth for the foreign-born population - Romania (%)
Place of birth for the foreign-born population - Russia (%)
Place of birth for the foreign-born population - Serbia (%)
Place of birth for the foreign-born population - Ukraine (%)
Place of birth for the foreign-born population - Other Eastern Europe (%)
Place of birth for the foreign-born population - China (%)
Place of birth for the foreign-born population - Hong Kong (%)
Place of birth for the foreign-born population - Taiwan (%)
Place of birth for the foreign-born population - Japan (%)
Place of birth for the foreign-born population - Korea (%)
Place of birth for the foreign-born population - Other Eastern Asia (%)
Place of birth for the foreign-born population - Afghanistan (%)
Place of birth for the foreign-born population - Bangladesh (%)
Place of birth for the foreign-born population - India (%)
Place of birth for the foreign-born population - Iran (%)
Place of birth for the foreign-born population - Kazakhstan (%)
Place of birth for the foreign-born population - Nepal (%)
Place of birth for the foreign-born population - Pakistan (%)
Place of birth for the foreign-born population - Sri Lanka (%)
Place of birth for the foreign-born population - Uzbekistan (%)
Place of birth for the foreign-born population - Other South Central Asia (%)
Place of birth for the foreign-born population - Burma (%)
Place of birth for the foreign-born population - Cambodia (%)
Place of birth for the foreign-born population - Indonesia (%)
Place of birth for the foreign-born population - Laos (%)
Place of birth for the foreign-born population - Malaysia (%)
Place of birth for the foreign-born population - Philippines (%)
Place of birth for the foreign-born population - Singapore (%)
Place of birth for the foreign-born population - Thailand (%)
Place of birth for the foreign-born population - Vietnam (%)
Place of birth for the foreign-born population - Other South Eastern Asia (%)
Place of birth for the foreign-born population - Armenia (%)
Place of birth for the foreign-born population - Iraq (%)
Place of birth for the foreign-born population - Israel (%)
Place of birth for the foreign-born population - Jordan (%)
Place of birth for the foreign-born population - Kuwait (%)
Place of birth for the foreign-born population - Lebanon (%)
Place of birth for the foreign-born population - Saudi Arabia (%)
Place of birth for the foreign-born population - Syria (%)
Place of birth for the foreign-born population - Turkey (%)
Place of birth for the foreign-born population - Yemen (%)
Place of birth for the foreign-born population - Other Western Asia (%)
Place of birth for the foreign-born population - Eritrea (%)
Place of birth for the foreign-born population - Ethiopia (%)
Place of birth for the foreign-born population - Kenya (%)
Place of birth for the foreign-born population - Somalia (%)
Place of birth for the foreign-born population - Uganda (%)
Place of birth for the foreign-born population - Zimbabwe (%)
Place of birth for the foreign-born population - Other Eastern Africa (%)
Place of birth for the foreign-born population - Cameroon (%)
Place of birth for the foreign-born population - Congo (%)
Place of birth for the foreign-born population - Democratic Republic of Congo (Zaire) (%)
Place of birth for the foreign-born population - Other Middle Africa (%)
Place of birth for the foreign-born population - Egypt (%)
Place of birth for the foreign-born population - Morocco (%)
Place of birth for the foreign-born population - Sudan (%)
Place of birth for the foreign-born population - Other Northern Africa (%)
Place of birth for the foreign-born population - South Africa (%)
Place of birth for the foreign-born population - Other Southern Africa (%)
Place of birth for the foreign-born population - Cabo Verde (%)
Place of birth for the foreign-born population - Ghana (%)
Place of birth for the foreign-born population - Liberia (%)
Place of birth for the foreign-born population - Nigeria (%)
Place of birth for the foreign-born population - Senegal (%)
Place of birth for the foreign-born population - Sierra Leone (%)
Place of birth for the foreign-born population - Other Western Africa (%)
Place of birth for the foreign-born population - Australia (%)
Place of birth for the foreign-born population - New Zealand (%)
Place of birth for the foreign-born population - Fiji (%)
Place of birth for the foreign-born population - Micronesia (%)
Place of birth for the foreign-born population - Bahamas (%)
Place of birth for the foreign-born population - Barbados (%)
Place of birth for the foreign-born population - Cuba (%)
Place of birth for the foreign-born population - Dominica (%)
Place of birth for the foreign-born population - Dominican Republic (%)
Place of birth for the foreign-born population - Grenada (%)
Place of birth for the foreign-born population - Haiti (%)
Place of birth for the foreign-born population - Jamaica (%)
Place of birth for the foreign-born population - St. Vincent and the Grenadines (%)
Place of birth for the foreign-born population - Trinidad and Tobago (%)
Place of birth for the foreign-born population - West Indies (%)
Place of birth for the foreign-born population - Other Caribbean (%)
Place of birth for the foreign-born population - Belize (%)
Place of birth for the foreign-born population - Costa Rica (%)
Place of birth for the foreign-born population - El Salvador (%)
Place of birth for the foreign-born population - Guatemala (%)
Place of birth for the foreign-born population - Honduras (%)
Place of birth for the foreign-born population - Mexico (%)
Place of birth for the foreign-born population - Nicaragua (%)
Place of birth for the foreign-born population - Panama (%)
Place of birth for the foreign-born population - Other Central America (%)
Place of birth for the foreign-born population - Argentina (%)
Place of birth for the foreign-born population - Bolivia (%)
Place of birth for the foreign-born population - Brazil (%)
Place of birth for the foreign-born population - Chile (%)
Place of birth for the foreign-born population - Colombia (%)
Place of birth for the foreign-born population - Ecuador (%)
Place of birth for the foreign-born population - Guyana (%)
Place of birth for the foreign-born population - Peru (%)
Place of birth for the foreign-born population - Uruguay (%)
Place of birth for the foreign-born population - Venezuela (%)
Place of birth for the foreign-born population - Other South America (%)
Place of birth for the foreign-born population - Canada (%)
Place of birth for the foreign-born population - Other Northern America (%)
Place of birth for the foreign-born population - Other (%)
Latest news about races in Gallup, NM collected exclusively by city-data.com from local newspapers, TV, and radio stations
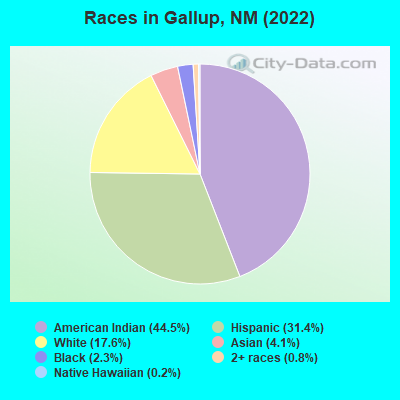
According to 2022 data, the most numerous races in Gallup, NM are Hispanic (6,590 residents), White alone (3,691 residents), and American Indian alone (9,338 residents). 72.8% of Gallup residents speak English at home. 7.4% of Gallup, NM residents are foreign-born (3.6% born in Latin America, 2.8% born in Asia), which is 21.2% less than the foreign-born rate of 9.0% across the entire state of New Mexico.
Race distribution in Gallup
2000 2022
813,495 44.7% White alone 765,386 42.1% Hispanic 161,460 8.9% American Indian alone 30,654 1.7% Black alone 25,793 1.4% Two or more races 18,257 1.0% Asian alone 3,009 0.2% Other race alone 992 0.05% Native Hawaiian and Other
1,059,867 50.2% Hispanic 735,478 34.8% White alone 171,808 8.1% American Indian alone 65,084 3.1% Two or more races 36,870 1.7% Black alone 35,870 1.7% Asian alone 7,582 0.4% Other race alone 785 0.04% Native Hawaiian and Other
Income and house value in Gallup Median household income in 2022 $81,162 White non-Hispanic householders$67,524 Black householders$55,330 American Indian and Alaska Native householders$110,432 Asian householders$62,099 Some other race householders$80,573 Two or more races householders$57,311 Hispanic or Latino race householdersMedian 2022 house value $231,927 White Non-Hispanic householders$167,266 Black or African American householders$181,786 American Indian or Alaska Native householders $293,103 Asian householders$164,749 Some other race householders$164,556 Two or more races householders$162,813 Hispanic or Latino householders
Median age by race in Gallup
40.5 Median age for White residents40.6 48.5 36.9 Median age for Black or African American residents20.4 50.2 28.8 Median age for American Indian / Alaska Native residents24.0 32.1 31.1 Median age for Asian residents44.1 19.5 59.6 Median age for Native Hawaiian / Pacific Islander residents-685,897,435.2 -659,380,691.5 28.7 Median age for Other race residents20.4 29.7 29.7 Median age for Two or more races residents29.8 29.5 42.8 Median age for White alone residents43.4 41.2 33.6 Median age for Hispanic or Latino residents28.2 32.5
Owner/renter occupied households by race in Gallup
House owners and renters - White residents 1,441 77.2% Owner occupied426 22.8% Renter occupiedHouse owners and renters - Black or African American residents 78 50.7% Owner occupied76 49.3% Renter occupiedHouse owners and renters - American Indian / Alaska Native residents 1,259 41.2% Owner occupied1,796 58.8% Renter occupiedHouse owners and renters - Asian residents 95 54.1% Owner occupied81 45.9% Renter occupiedHouse owners and renters - Native Hawaiian / Pacific Islander residents 12 19.5% Owner occupied51 80.5% Renter occupiedHouse owners and renters - Other race residents 779 71.5% Owner occupied310 28.5% Renter occupiedHouse owners and renters - Two or more races residents 273 58.5% Owner occupied194 41.5% Renter occupiedHouse owners and renters - White alone residents 1,164 74.7% Owner occupied394 25.3% Renter occupiedHouse owners and renters - Hispanic or Latino residents 1,654 77.4% Owner occupied484 22.6% Renter occupied
Language usage in Gallup
English speakers - Total 72.8% of residents of Gallup speak English at home.
13.0% of residents speak Spanish at home 2,212 85.1% Speak English very well388 14.9% Speak English less than very well20.3% of residents speak other language at home 3,218 79.7% Speak English very well819 20.3% Speak English less than very well
English speakers - Born in the United States 70.9% of residents of Gallup speak English at home.
7.2% of residents speak Spanish at home 464 99.8% Speak English very well1 0.2% Speak English less than very well20.2% of residents speak other language at home 1,241 95.2% Speak English very well63 4.8% Speak English less than very well
All residents speak only English at home
English speakers - Foreign-born 9.8% of residents of Gallup speak English at home.
24.2% of residents speak Spanish at home 165 46.3% Speak English very well191 53.7% Speak English less than very well66.4% of residents speak other language at home 659 67.5% Speak English very well317 32.5% Speak English less than very well
White (Caucasian) - Speak only English Native:
97.5% (3,764)Foreign-born:
43.1% (39)
White (Caucasian) - Speak another language Native:
5.9% (229)Foreign-born:
100.0% (90)
Black or African American - Speak only English Native:
86.7% (162)Foreign-born:
100.0% (108)
Black or African American - Speak another language Native:
12.2% (23)Foreign-born:
3.4% (4)
Asian - Speak only English Native:
2.0% (4)Foreign-born:
13.6% (84)
Asian - Speak another language Native:
95.8% (177)Foreign-born:
85.9% (532)
Other race - Speak only English Native:
43.3% (1,021)Foreign-born:
21.3% (79)
Other race - Speak another language Native:
54.3% (1,280)Foreign-born:
93.9% (349)
Two or more races - Speak only English Native:
68.9% (774)Foreign-born:
63.7% (13)
Two or more races - Speak another language Native:
30.8% (346)Foreign-born:
65.1% (13)
White alone - Speak only English Native:
94.5% (3,352)Foreign-born:
41.4% (48)
White alone - Speak another language Native:
5.1% (180)Foreign-born:
57.4% (66)
Hispanic or Latino - Speak only English Native:
68.3% (4,171)Foreign-born:
22.0% (92)
Hispanic or Latino - Speak another language Native:
31.7% (1,935)Foreign-born:
94.4% (395)
Foreign-born residents in Gallup 1,559 residents are foreign born (3.6% Latin America , 2.8% Asia ).
This city:
7.4%New Mexico:
9.2%
Marital status for residents in Gallup Marital status - White (Caucasian) population 15 years and over
Males 34.4% Never married45.3% Now married2.4% Separated2.3% Widowed15.6% DivorcedFemales 22.9% Never married38.2% Now married2.7% Separated15.5% Widowed20.6% DivorcedWomen who gave birth in the past 12 months Now married:
100.0% (50)Unmarried:
0.0% (0)
Women who did not give birth in the past 12 months Now married:
43.9% (383)Unmarried:
56.1% (489)
Marital status - Black or African American population 15 years and over
Males 16.1% Never married68.8% Now married0.0% Separated0.0% Widowed15.1% DivorcedFemales 8.3% Never married78.0% Now married0.0% Separated0.0% Widowed13.8% DivorcedWomen who did not give birth in the past 12 months Now married:
62.5% (35)Unmarried:
37.5% (21)
Marital status - American Indian / Alaska Native population 15 years and over
Males 56.6% Never married33.5% Now married0.7% Separated2.5% Widowed6.7% DivorcedFemales 51.9% Never married28.4% Now married2.7% Separated3.8% Widowed13.2% DivorcedWomen who gave birth in the past 12 months Now married:
3.7% (9)Unmarried:
96.3% (233)
Women who did not give birth in the past 12 months Now married:
24.2% (624)Unmarried:
75.8% (1,956)
Marital status - Asian population 15 years and over
Males 38.8% Never married61.2% Now married0.0% Separated0.0% Widowed0.0% DivorcedFemales 33.3% Never married61.2% Now married0.0% Separated0.0% Widowed5.4% DivorcedWomen who gave birth in the past 12 months Now married:
100.0% (16)Unmarried:
0.0% (0)
Women who did not give birth in the past 12 months Now married:
57.4% (148)Unmarried:
42.6% (110)
Marital status - Native Hawaiian / Pacific Islander population 15 years and over
Males 0.0% Never married44.0% Now married0.0% Separated0.0% Widowed56.0% DivorcedFemales 100.0% Never married0.0% Now married0.0% Separated0.0% Widowed0.0% DivorcedWomen who did not give birth in the past 12 months Now married:
0.0% (0)Unmarried:
100.0% (17)
Marital status - Other race population 15 years and over
Males 58.3% Never married29.8% Now married2.4% Separated4.4% Widowed5.1% DivorcedFemales 30.5% Never married41.1% Now married11.5% Separated5.2% Widowed11.8% DivorcedWomen who did not give birth in the past 12 months Now married:
38.0% (290)Unmarried:
62.0% (473)
Marital status - Two or more races population 15 years and over
Males 50.5% Never married30.2% Now married0.0% Separated0.1% Widowed19.2% DivorcedFemales 49.4% Never married32.8% Now married2.5% Separated4.5% Widowed10.7% DivorcedWomen who gave birth in the past 12 months Now married:
100.0% (18)Unmarried:
0.0% (0)
Women who did not give birth in the past 12 months Now married:
32.0% (186)Unmarried:
68.0% (394)
Marital status - White alone, not Hispanic / Latino population 15 years and over
Males 28.8% Never married51.1% Now married0.8% Separated2.6% Widowed16.6% DivorcedFemales 21.0% Never married39.6% Now married2.8% Separated12.0% Widowed24.6% DivorcedWomen who gave birth in the past 12 months Now married:
100.0% (50)Unmarried:
0.0% (0)
Women who did not give birth in the past 12 months Now married:
44.3% (316)Unmarried:
55.7% (396)
Marital status - Hispanic or Latino population 15 years and over
Males 55.1% Never married30.3% Now married2.8% Separated2.6% Widowed9.2% DivorcedFemales 39.5% Never married34.9% Now married6.7% Separated9.6% Widowed9.3% DivorcedWomen who gave birth in the past 12 months Now married:
100.0% (12)Unmarried:
0.0% (0)
Women who did not give birth in the past 12 months Now married:
31.7% (381)Unmarried:
68.3% (822)
Ancestries in Gallup
370 2.4% English225 1.4% Irish134 0.9% German121 0.8% Dutch97 0.6% European93 0.6% Italian85 0.5% Palestinian83 0.5% Jamaican77 0.5% American72 0.5% Norwegian68 0.4% Hungarian62 0.4% African47 0.3% Slavic44 0.3% Swedish33 0.2% Arab31 0.2% Polish29 0.2% Scotch-Irish21 0.1% Northern European17 0.1% Croatian17 0.1% Nigerian9 0.06% Russian8 0.05% Danish3 0.02% Welsh
Geographical mobility in Gallup Same house 1 year ago 4,910 95.9% White (Caucasian)287 63.8% Black or African American9,109 87.7% American Indian / Alaska Native798 87.7% Asian29 66.6% Native Hawaiian / Pacific Islander3,740 98.7% Other race2,403 88.0% Two or more races3,459 94.3% White alone, not Hispanic / Latino5,989 90.0% Hispanic or LatinoMoved within same county 159 3.1% White / Caucasian129 28.6% Black or African American692 6.7% American Indian / Alaska Native11 1.2% Asian61 1.6% Other race220 8.0% Two or more races159 4.3% White alone, not Hispanic / Latino666 10.0% Hispanic or LatinoMoved within same state 34 0.7% White / Caucasian6 1.2% Black or African American322 3.1% American Indian / Alaska Native70 7.6% Asian16 35.8% Native Hawaiian / Pacific Islander16 0.4% Other race78 2.9% Two or more races25 0.7% White alone, not Hispanic / Latino83 1.2% Hispanic or LatinoMoved from different state 104 2.0% White / Caucasian222 2.1% American Indian / Alaska Native39 1.0% Other race17 0.6% Two or more races106 2.9% White alone, not Hispanic / Latino59 0.9% Hispanic or LatinoMoved from abroad 47 0.9% White25 0.2% American Indian / Alaska Native27 2.9% Asian10 0.4% Two or more races63 1.7% White alone, not Hispanic / Latino
Children Nativity (place of birth) in Gallup
Children under 6 years - Living with two parents Both parents native 449 100.0% NativeBoth parents foreign-born 24 54.5% Native20 45.5% Foreign-bornOne native, one foreign-born parent 86 100.0% NativeChildren under 6 years - Living with one parent Native parent 1,038 100.0% NativeForeign-born parent 25 100.0% NativeChildren 6 to 17 years - Living with two parents Both parents native 1,458 99.9% Native1 0.1% Foreign-bornBoth parents foreign-born 179 77.3% Native53 22.7% Foreign-bornOne native, one foreign-born parent 46 100.0% NativeChildren 6 to 17 years - Living with one parent Native parent 2,371 100.0% NativeForeign-born parent 172 59.1% Native119 40.9% Foreign-born
Grandparents responsible for own grandchildren in Gallup
Grandparents (30 to 59 years) White / Caucasian 46 100.0% Not responsible for grandchildrenAmerican Indian / Alaska Native 23 11.0% Responsible for grandchildren183 89.0% Not responsible for grandchildrenOther race 34 100.0% Responsible for grandchildrenTwo or more races 29 100.0% Not responsible for grandchildrenWhite alone, not Hispanic / Latino 71 100.0% Not responsible for grandchildrenHispanic or Latino 27 57.0% Responsible for grandchildren20 43.0% Not responsible for grandchildrenGrandparents (60 years and over) White / Caucasian 19 78.2% Responsible for grandchildren5 21.8% Not responsible for grandchildrenAmerican Indian / Alaska Native 119 36.3% Responsible for grandchildren209 63.7% Not responsible for grandchildrenOther race 50 100.0% Not responsible for grandchildrenWhite alone, not Hispanic / Latino 8 100.0% Not responsible for grandchildrenHispanic or Latino 21 27.8% Responsible for grandchildren54 72.2% Not responsible for grandchildren