Races in Gatesville, Texas (TX) Detailed Stats
Data:
Races - White alone (%)
Races - White alone (% change since 2000)
Races - Black alone (%)
Races - Black alone (% change since 2000)
Races - American Indian alone (%)
Races - American Indian alone (% change since 2000)
Races - Asian alone (%)
Races - Asian alone (% change since 2000)
Races - Hispanic (%)
Races - Hispanic (% change since 2000)
Races - Native Hawaiian and Other Pacific Islander alone (%)
Races - Native Hawaiian and Other Pacific Islander alone (% change since 2000)
Races - Two or more races(%)
Races - Two or more races(% change since 2000)
Races - Other race alone (%)
Races - Other race alone (% change since 2000)
Racial diversity
Place of birth - Born in state of residence (%)
Place of birth - Born in state of residence (%) - White
Place of birth - Born in state of residence (%) - Black or African American
Place of birth - Born in state of residence (%) - Asian
Place of birth - Born in state of residence (%) - Hispanic or Latino
Place of birth - Born in state of residence (%) - American Indian and Alaska Native
Place of birth - Born in state of residence (%) - Multirace
Place of birth - Born in state of residence (%) - Other Race
Place of birth - Born in other state (%)
Place of birth - Born in other state (%) - White
Place of birth - Born in other state (%) - Black or African American
Place of birth - Born in other state (%) - Asian
Place of birth - Born in other state (%) - Hispanic or Latino
Place of birth - Born in other state (%) - American Indian and Alaska Native
Place of birth - Born in other state (%) - Multirace
Place of birth - Born in other state (%) - Other Race
Place of birth - Native, outside of US (%)
Place of birth - Native, outside of US (%) - White
Place of birth - Native, outside of US (%) - Black or African American
Place of birth - Native, outside of US (%) - Asian
Place of birth - Native, outside of US (%) - Hispanic or Latino
Place of birth - Native, outside of US (%) - American Indian and Alaska Native
Place of birth - Native, outside of US (%) - Multirace
Place of birth - Native, outside of US (%) - Other Race
Place of birth - Foreign born (%)
Place of birth - Foreign born (%) - White
Place of birth - Foreign born (%) - Black or African American
Place of birth - Foreign born (%) - Asian
Place of birth - Foreign born (%) - Hispanic or Latino
Place of birth - Foreign born (%) - American Indian and Alaska Native
Place of birth - Foreign born (%) - Multirace
Place of birth - Foreign born (%) - Other Race
Residents speaking English at home (%)
Residents speaking English at home - Born in the United States (%)
Residents speaking English at home - Native, born elsewhere (%)
Residents speaking English at home - Foreign born (%)
Residents speaking Spanish at home (%)
Residents speaking Spanish at home - Born in the United States (%)
Residents speaking Spanish at home - Native, born elsewhere (%)
Residents speaking Spanish at home - Foreign born (%)
Residents speaking other language at home (%)
Residents speaking other language at home - Born in the United States (%)
Residents speaking other language at home - Native, born elsewhere (%)
Residents speaking other language at home - Foreign born (%)
Marital status - Never married (%)
Marital status - Now married (%)
Marital status - Separated (%)
Marital status - Widowed (%)
Marital status - Divorced (%)
Ancestries Reported - Arab (%)
Ancestries Reported - Czech (%)
Ancestries Reported - Danish (%)
Ancestries Reported - Dutch (%)
Ancestries Reported - English (%)
Ancestries Reported - French (%)
Ancestries Reported - French Canadian (%)
Ancestries Reported - German (%)
Ancestries Reported - Greek (%)
Ancestries Reported - Hungarian (%)
Ancestries Reported - Irish (%)
Ancestries Reported - Italian (%)
Ancestries Reported - Lithuanian (%)
Ancestries Reported - Norwegian (%)
Ancestries Reported - Polish (%)
Ancestries Reported - Portuguese (%)
Ancestries Reported - Russian (%)
Ancestries Reported - Scotch-Irish (%)
Ancestries Reported - Scottish (%)
Ancestries Reported - Slovak (%)
Ancestries Reported - Subsaharan African (%)
Ancestries Reported - Swedish (%)
Ancestries Reported - Swiss (%)
Ancestries Reported - Ukrainian (%)
Ancestries Reported - United States (%)
Ancestries Reported - Welsh (%)
Ancestries Reported - West Indian (%)
Ancestries Reported - Other (%)
Geographical mobility - Same house 1 year ago (%)
Geographical mobility - Same house 1 year ago (%) - White
Geographical mobility - Same house 1 year ago (%) - Black or African American
Geographical mobility - Same house 1 year ago (%) - Asian
Geographical mobility - Same house 1 year ago (%) - Hispanic or Latino
Geographical mobility - Same house 1 year ago (%) - American Indian and Alaska Native
Geographical mobility - Same house 1 year ago (%) - Multirace
Geographical mobility - Same house 1 year ago (%) - Other Race
Geographical mobility - Moved within same county (%)
Geographical mobility - Moved within same county (%) - White
Geographical mobility - Moved within same county (%) - Black or African American
Geographical mobility - Moved within same county (%) - Asian
Geographical mobility - Moved within same county (%) - Hispanic or Latino
Geographical mobility - Moved within same county (%) - American Indian and Alaska Native
Geographical mobility - Moved within same county (%) - Multirace
Geographical mobility - Moved within same county (%) - Other Race
Geographical mobility - Moved from different county within same state (%)
Geographical mobility - Moved from different county within same state (%) - White
Geographical mobility - Moved from different county within same state (%) - Black or African American
Geographical mobility - Moved from different county within same state (%) - Asian
Geographical mobility - Moved from different county within same state (%) - Hispanic or Latino
Geographical mobility - Moved from different county within same state (%) - American Indian and Alaska Native
Geographical mobility - Moved from different county within same state (%) - Multirace
Geographical mobility - Moved from different county within same state (%) - Other Race
Geographical mobility - Moved from different state (%)
Geographical mobility - Moved from different state (%) - White
Geographical mobility - Moved from different state (%) - Black or African American
Geographical mobility - Moved from different state (%) - Asian
Geographical mobility - Moved from different state (%) - Hispanic or Latino
Geographical mobility - Moved from different state (%) - American Indian and Alaska Native
Geographical mobility - Moved from different state (%) - Multirace
Geographical mobility - Moved from different state (%) - Other Race
Geographical mobility - Moved from abroad (%)
Geographical mobility - Moved from abroad (%) - White
Geographical mobility - Moved from abroad (%) - Black or African American
Geographical mobility - Moved from abroad (%) - Asian
Geographical mobility - Moved from abroad (%) - Hispanic or Latino
Geographical mobility - Moved from abroad (%) - American Indian and Alaska Native
Geographical mobility - Moved from abroad (%) - Multirace
Geographical mobility - Moved from abroad (%) - Other Race
Place of birth for the foreign-born population - Ireland (%)
Place of birth for the foreign-born population - Denmark (%)
Place of birth for the foreign-born population - Norway (%)
Place of birth for the foreign-born population - Sweden (%)
Place of birth for the foreign-born population - United Kingdom (%)
Place of birth for the foreign-born population - England (%)
Place of birth for the foreign-born population - Scotland (%)
Place of birth for the foreign-born population - Other Northern Europe (%)
Place of birth for the foreign-born population - Austria (%)
Place of birth for the foreign-born population - Belgium (%)
Place of birth for the foreign-born population - France (%)
Place of birth for the foreign-born population - Germany (%)
Place of birth for the foreign-born population - Netherlands (%)
Place of birth for the foreign-born population - Switzerland (%)
Place of birth for the foreign-born population - Other Western Europe (%)
Place of birth for the foreign-born population - Greece (%)
Place of birth for the foreign-born population - Italy (%)
Place of birth for the foreign-born population - Portugal (%)
Place of birth for the foreign-born population - Spain (%)
Place of birth for the foreign-born population - Other Southern Europe (%)
Place of birth for the foreign-born population - Albania (%)
Place of birth for the foreign-born population - Belarus (%)
Place of birth for the foreign-born population - Bosnia and Herzegovina (%)
Place of birth for the foreign-born population - Bulgaria (%)
Place of birth for the foreign-born population - Croatia (%)
Place of birth for the foreign-born population - Czechoslovakia (%)
Place of birth for the foreign-born population - Hungary (%)
Place of birth for the foreign-born population - Latvia (%)
Place of birth for the foreign-born population - Lithuania (%)
Place of birth for the foreign-born population - North Macedonia (Macedonia) (%)
Place of birth for the foreign-born population - Moldova (%)
Place of birth for the foreign-born population - Poland (%)
Place of birth for the foreign-born population - Romania (%)
Place of birth for the foreign-born population - Russia (%)
Place of birth for the foreign-born population - Serbia (%)
Place of birth for the foreign-born population - Ukraine (%)
Place of birth for the foreign-born population - Other Eastern Europe (%)
Place of birth for the foreign-born population - China (%)
Place of birth for the foreign-born population - Hong Kong (%)
Place of birth for the foreign-born population - Taiwan (%)
Place of birth for the foreign-born population - Japan (%)
Place of birth for the foreign-born population - Korea (%)
Place of birth for the foreign-born population - Other Eastern Asia (%)
Place of birth for the foreign-born population - Afghanistan (%)
Place of birth for the foreign-born population - Bangladesh (%)
Place of birth for the foreign-born population - India (%)
Place of birth for the foreign-born population - Iran (%)
Place of birth for the foreign-born population - Kazakhstan (%)
Place of birth for the foreign-born population - Nepal (%)
Place of birth for the foreign-born population - Pakistan (%)
Place of birth for the foreign-born population - Sri Lanka (%)
Place of birth for the foreign-born population - Uzbekistan (%)
Place of birth for the foreign-born population - Other South Central Asia (%)
Place of birth for the foreign-born population - Burma (%)
Place of birth for the foreign-born population - Cambodia (%)
Place of birth for the foreign-born population - Indonesia (%)
Place of birth for the foreign-born population - Laos (%)
Place of birth for the foreign-born population - Malaysia (%)
Place of birth for the foreign-born population - Philippines (%)
Place of birth for the foreign-born population - Singapore (%)
Place of birth for the foreign-born population - Thailand (%)
Place of birth for the foreign-born population - Vietnam (%)
Place of birth for the foreign-born population - Other South Eastern Asia (%)
Place of birth for the foreign-born population - Armenia (%)
Place of birth for the foreign-born population - Iraq (%)
Place of birth for the foreign-born population - Israel (%)
Place of birth for the foreign-born population - Jordan (%)
Place of birth for the foreign-born population - Kuwait (%)
Place of birth for the foreign-born population - Lebanon (%)
Place of birth for the foreign-born population - Saudi Arabia (%)
Place of birth for the foreign-born population - Syria (%)
Place of birth for the foreign-born population - Turkey (%)
Place of birth for the foreign-born population - Yemen (%)
Place of birth for the foreign-born population - Other Western Asia (%)
Place of birth for the foreign-born population - Eritrea (%)
Place of birth for the foreign-born population - Ethiopia (%)
Place of birth for the foreign-born population - Kenya (%)
Place of birth for the foreign-born population - Somalia (%)
Place of birth for the foreign-born population - Uganda (%)
Place of birth for the foreign-born population - Zimbabwe (%)
Place of birth for the foreign-born population - Other Eastern Africa (%)
Place of birth for the foreign-born population - Cameroon (%)
Place of birth for the foreign-born population - Congo (%)
Place of birth for the foreign-born population - Democratic Republic of Congo (Zaire) (%)
Place of birth for the foreign-born population - Other Middle Africa (%)
Place of birth for the foreign-born population - Egypt (%)
Place of birth for the foreign-born population - Morocco (%)
Place of birth for the foreign-born population - Sudan (%)
Place of birth for the foreign-born population - Other Northern Africa (%)
Place of birth for the foreign-born population - South Africa (%)
Place of birth for the foreign-born population - Other Southern Africa (%)
Place of birth for the foreign-born population - Cabo Verde (%)
Place of birth for the foreign-born population - Ghana (%)
Place of birth for the foreign-born population - Liberia (%)
Place of birth for the foreign-born population - Nigeria (%)
Place of birth for the foreign-born population - Senegal (%)
Place of birth for the foreign-born population - Sierra Leone (%)
Place of birth for the foreign-born population - Other Western Africa (%)
Place of birth for the foreign-born population - Australia (%)
Place of birth for the foreign-born population - New Zealand (%)
Place of birth for the foreign-born population - Fiji (%)
Place of birth for the foreign-born population - Micronesia (%)
Place of birth for the foreign-born population - Bahamas (%)
Place of birth for the foreign-born population - Barbados (%)
Place of birth for the foreign-born population - Cuba (%)
Place of birth for the foreign-born population - Dominica (%)
Place of birth for the foreign-born population - Dominican Republic (%)
Place of birth for the foreign-born population - Grenada (%)
Place of birth for the foreign-born population - Haiti (%)
Place of birth for the foreign-born population - Jamaica (%)
Place of birth for the foreign-born population - St. Vincent and the Grenadines (%)
Place of birth for the foreign-born population - Trinidad and Tobago (%)
Place of birth for the foreign-born population - West Indies (%)
Place of birth for the foreign-born population - Other Caribbean (%)
Place of birth for the foreign-born population - Belize (%)
Place of birth for the foreign-born population - Costa Rica (%)
Place of birth for the foreign-born population - El Salvador (%)
Place of birth for the foreign-born population - Guatemala (%)
Place of birth for the foreign-born population - Honduras (%)
Place of birth for the foreign-born population - Mexico (%)
Place of birth for the foreign-born population - Nicaragua (%)
Place of birth for the foreign-born population - Panama (%)
Place of birth for the foreign-born population - Other Central America (%)
Place of birth for the foreign-born population - Argentina (%)
Place of birth for the foreign-born population - Bolivia (%)
Place of birth for the foreign-born population - Brazil (%)
Place of birth for the foreign-born population - Chile (%)
Place of birth for the foreign-born population - Colombia (%)
Place of birth for the foreign-born population - Ecuador (%)
Place of birth for the foreign-born population - Guyana (%)
Place of birth for the foreign-born population - Peru (%)
Place of birth for the foreign-born population - Uruguay (%)
Place of birth for the foreign-born population - Venezuela (%)
Place of birth for the foreign-born population - Other South America (%)
Place of birth for the foreign-born population - Canada (%)
Place of birth for the foreign-born population - Other Northern America (%)
Place of birth for the foreign-born population - Other (%)
Latest news about races in Gatesville, TX collected exclusively by city-data.com from local newspapers, TV, and radio stations
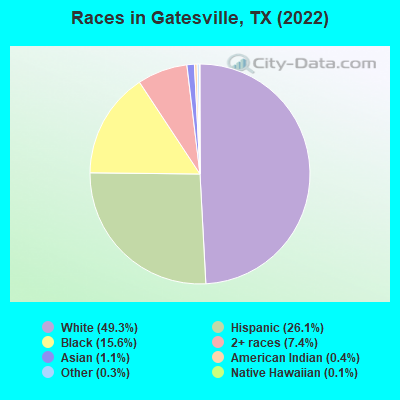
According to 2022 data, the most numerous races in Gatesville, TX are Hispanic (4,243 residents), White alone (8,019 residents), and Black alone (2,542 residents). 78.6% of Gatesville residents speak English at home. 5.3% of Gatesville, TX residents are foreign-born (3.9% born in Latin America, 0.8% born in Asia), which is 221.7% less than the foreign-born rate of 17.0% across the entire state of Texas.
Race distribution in Gatesville
2000 2022
10,933,313 52.4% White alone 6,669,666 32.0% Hispanic 2,364,255 11.3% Black alone 554,445 2.7% Asian alone 230,567 1.1% Two or more races 68,859 0.3% American Indian alone 19,958 0.10% Other race alone 10,757 0.05% Native Hawaiian and Other
12,070,642 40.2% Hispanic 11,683,430 38.9% White alone 3,508,706 11.7% Black alone 1,608,173 5.4% Asian alone 956,560 3.2% Two or more races 125,763 0.4% Other race alone 47,023 0.2% American Indian alone 29,275 0.10% Native Hawaiian and Other
Income and house value in Gatesville Median household income in 2022 $52,203 White non-Hispanic householders$33,854 Black householders$62,215 Asian householders$46,570 Some other race householders$49,244 Two or more races householders$54,272 Hispanic or Latino race householdersMedian 2022 house value $145,000 White Non-Hispanic householders$142,310 Black or African American householders$156,837 American Indian or Alaska Native householders $147,959 Asian householders$152,263 Some other race householders$131,818 Hispanic or Latino householders
Median age by race in Gatesville
40.6 Median age for White residents40.6 41.3 40.5 Median age for Black or African American residents45.4 36.6 52.3 Median age for American Indian / Alaska Native residents90.5 45.7 42.4 Median age for Asian residents44.6 45.2 -544,747,081.2 Median age for Native Hawaiian / Pacific Islander residents-602,898,550.1 -467,908,902.2 39.3 Median age for Other race residents49.0 36.1 39.8 Median age for Two or more races residents38.4 41.5 42.0 Median age for White alone residents41.3 43.6 35.0 Median age for Hispanic or Latino residents37.5 32.7
Owner/renter occupied households by race in Gatesville
House owners and renters - White residents 1,527 64.0% Owner occupied860 36.0% Renter occupiedHouse owners and renters - Black or African American residents 3 1.0% Owner occupied289 99.0% Renter occupiedHouse owners and renters - Asian residents 23 39.7% Owner occupied35 60.3% Renter occupiedHouse owners and renters - Other race residents 26 28.2% Owner occupied66 71.8% Renter occupiedHouse owners and renters - Two or more races residents 226 45.7% Owner occupied269 54.3% Renter occupiedHouse owners and renters - White alone residents 1,521 63.7% Owner occupied868 36.3% Renter occupiedHouse owners and renters - Hispanic or Latino residents 175 51.4% Owner occupied166 48.6% Renter occupied
Language usage in Gatesville
English speakers - Total 78.6% of residents of Gatesville speak English at home.
18.6% of residents speak Spanish at home 2,411 81.2% Speak English very well560 18.8% Speak English less than very well2.9% of residents speak other language at home 293 63.7% Speak English very well167 36.3% Speak English less than very well
English speakers - Born in the United States 87.8% of residents of Gatesville speak English at home.
8.3% of residents speak Spanish at home 341 90.9% Speak English very well34 9.1% Speak English less than very well3.8% of residents speak other language at home 172 100.0% Speak English very well
English speakers - Native, born elsewhere 84.7% of residents of Gatesville speak English at home.
19.8% of residents speak Spanish at home 6 23.1% Speak English very well20 76.9% Speak English less than very well
English speakers - Foreign-born 9.1% of residents of Gatesville speak English at home.
56.0% of residents speak Spanish at home 169 32.3% Speak English very well354 67.7% Speak English less than very well27.9% of residents speak other language at home 107 41.0% Speak English very well154 59.0% Speak English less than very well
White (Caucasian) - Speak only English Native:
92.1% (8,049)Foreign-born:
3.7% (5)
White (Caucasian) - Speak another language Native:
7.1% (620)Foreign-born:
100.0% (141)
Black or African American - Speak only English Native:
95.3% (2,264)Foreign-born:
64.1% (75)
Black or African American - Speak another language Native:
4.7% (111)Foreign-born:
30.8% (36)
Asian - Speak only English Native:
56.2% (38)Foreign-born:
22.6% (28)
Asian - Speak another language Native:
34.1% (23)Foreign-born:
100.0% (124)
Other race - Speak only English Native:
26.7% (256)Foreign-born:
25.9% (23)
Other race - Speak another language Native:
72.7% (695)Foreign-born:
75.7% (66)
Two or more races - Speak only English Native:
68.6% (1,879)Foreign-born:
15.5% (91)
Two or more races - Speak another language Native:
31.8% (872)Foreign-born:
84.6% (499)
White alone - Speak only English Native:
97.4% (7,649)Foreign-born:
18.2% (6)
White alone - Speak another language Native:
2.5% (199)Foreign-born:
95.3% (32)
Hispanic or Latino - Speak only English Native:
39.7% (1,383)Foreign-born:
5.8% (32)
Hispanic or Latino - Speak another language Native:
61.1% (2,126)Foreign-born:
94.5% (525)
Foreign-born residents in Gatesville 859 residents are foreign born (3.9% Latin America , 0.8% Asia ).
This city:
5.3%Texas:
17.1%
Marital status for residents in Gatesville Marital status - White (Caucasian) population 15 years and over
Males 35.7% Never married39.3% Now married4.7% Separated3.9% Widowed16.4% DivorcedFemales 32.4% Never married33.3% Now married7.5% Separated8.1% Widowed18.6% DivorcedWomen who gave birth in the past 12 months Now married:
51.4% (33)Unmarried:
48.6% (31)
Women who did not give birth in the past 12 months Now married:
36.8% (1,166)Unmarried:
63.2% (2,003)
Marital status - Black or African American population 15 years and over
Males 64.6% Never married19.0% Now married4.0% Separated2.6% Widowed9.8% DivorcedFemales 67.0% Never married8.8% Now married5.5% Separated9.3% Widowed9.4% DivorcedWomen who gave birth in the past 12 months Now married:
0.0% (0)Unmarried:
100.0% (104)
Women who did not give birth in the past 12 months Now married:
13.3% (124)Unmarried:
86.7% (810)
Marital status - American Indian / Alaska Native population 15 years and over
Males 52.8% Never married0.0% Now married47.2% Separated0.0% Widowed0.0% DivorcedFemales 59.1% Never married22.7% Now married0.0% Separated0.0% Widowed18.2% DivorcedWomen who gave birth in the past 12 months Now married:
0.0% (0)Unmarried:
100.0% (4)
Women who did not give birth in the past 12 months Now married:
33.3% (7)Unmarried:
66.7% (14)
Marital status - Asian population 15 years and over
Males 72.2% Never married27.8% Now married0.0% Separated0.0% Widowed0.0% DivorcedFemales 66.1% Never married16.1% Now married0.0% Separated0.0% Widowed17.8% DivorcedWomen who did not give birth in the past 12 months Now married:
0.0% (0)Unmarried:
100.0% (80)
Marital status - Other race population 15 years and over
Males 42.1% Never married14.9% Now married15.7% Separated0.0% Widowed27.2% DivorcedFemales 53.5% Never married16.9% Now married2.9% Separated7.6% Widowed19.1% DivorcedWomen who gave birth in the past 12 months Now married:
0.0% (0)Unmarried:
100.0% (26)
Women who did not give birth in the past 12 months Now married:
19.9% (98)Unmarried:
80.1% (391)
Marital status - Two or more races population 15 years and over
Males 35.9% Never married34.3% Now married4.2% Separated1.4% Widowed24.1% DivorcedFemales 31.2% Never married29.9% Now married8.7% Separated4.0% Widowed26.2% DivorcedWomen who gave birth in the past 12 months Now married:
100.0% (35)Unmarried:
0.0% (0)
Women who did not give birth in the past 12 months Now married:
35.2% (548)Unmarried:
64.8% (1,009)
Marital status - White alone, not Hispanic / Latino population 15 years and over
Males 32.2% Never married40.9% Now married5.3% Separated4.3% Widowed17.3% DivorcedFemales 28.4% Never married34.7% Now married8.2% Separated8.7% Widowed20.0% DivorcedWomen who gave birth in the past 12 months Now married:
50.0% (34)Unmarried:
50.0% (34)
Women who did not give birth in the past 12 months Now married:
39.7% (1,073)Unmarried:
60.3% (1,630)
Marital status - Hispanic or Latino population 15 years and over
Males 47.0% Never married27.5% Now married7.5% Separated0.8% Widowed17.1% DivorcedFemales 47.1% Never married23.3% Now married3.4% Separated5.0% Widowed21.3% DivorcedWomen who gave birth in the past 12 months Now married:
56.0% (31)Unmarried:
44.0% (24)
Women who did not give birth in the past 12 months Now married:
22.0% (396)Unmarried:
78.0% (1,401)
Ancestries in Gatesville
1,041 11.5% American818 9.0% English537 5.9% German406 4.5% Irish103 1.1% Dutch76 0.8% European66 0.7% Haitian63 0.7% Italian58 0.6% French Canadian51 0.6% Scottish45 0.5% Jamaican41 0.5% French33 0.4% Czech27 0.3% Scotch-Irish18 0.2% African14 0.2% Swedish13 0.1% Brazilian13 0.1% Norwegian13 0.1% Welsh12 0.1% Ukrainian11 0.1% Moroccan7 0.08% Danish6 0.07% Nigerian5 0.06% Austrian5 0.06% Polish5 0.06% Somali4 0.04% Cajun4 0.04% Canadian
Geographical mobility in Gatesville Same house 1 year ago 6,652 74.7% White (Caucasian)1,739 70.1% Black or African American84 76.6% American Indian / Alaska Native97 58.0% Asian802 61.0% Other race2,350 70.3% Two or more races5,864 73.9% White alone, not Hispanic / Latino2,917 70.1% Hispanic or LatinoMoved within same county 605 6.8% White / Caucasian77 3.1% Black or African American4 3.3% American Indian / Alaska Native55 33.1% Asian8 44.4% Native Hawaiian / Pacific Islander52 4.0% Other race147 4.4% Two or more races636 8.0% White alone, not Hispanic / Latino157 3.8% Hispanic or LatinoMoved within same state 1,231 13.8% White / Caucasian715 28.8% Black or African American20 18.6% American Indian / Alaska Native7 4.2% Asian295 22.4% Other race748 22.4% Two or more races1,143 14.4% White alone, not Hispanic / Latino966 23.2% Hispanic or LatinoMoved from different state 245 2.7% White / Caucasian63 2.5% Black or African American135 4.0% Two or more races230 2.9% White alone, not Hispanic / Latino77 1.8% Hispanic or LatinoMoved from abroad 113 1.3% White14 0.6% Black or African American22 0.7% Two or more races15 0.2% White alone, not Hispanic / Latino126 3.0% Hispanic or Latino
Children Nativity (place of birth) in Gatesville
Children under 6 years - Living with two parents Both parents native 200 100.0% NativeOne native, one foreign-born parent 75 100.0% NativeChildren under 6 years - Living with one parent Native parent 134 100.0% NativeChildren 6 to 17 years - Living with two parents Both parents native 531 100.0% NativeOne native, one foreign-born parent 88 100.0% NativeChildren 6 to 17 years - Living with one parent Native parent 343 100.0% NativeForeign-born parent 4 50.5% Native4 49.5% Foreign-born
Grandparents responsible for own grandchildren in Gatesville
Grandparents (30 to 59 years) White / Caucasian 18 22.6% Responsible for grandchildren61 77.4% Not responsible for grandchildrenTwo or more races 21 100.0% Responsible for grandchildrenWhite alone, not Hispanic / Latino 23 57.2% Responsible for grandchildren17 42.8% Not responsible for grandchildrenHispanic or Latino 12 14.1% Responsible for grandchildren76 85.9% Not responsible for grandchildrenGrandparents (60 years and over) White / Caucasian 39 73.5% Responsible for grandchildren14 26.5% Not responsible for grandchildrenWhite alone, not Hispanic / Latino 46 70.6% Responsible for grandchildren19 29.4% Not responsible for grandchildren