Races in Hyattsville, Maryland (MD) Detailed Stats
Data:
Races - White alone (%)
Races - White alone (% change since 2000)
Races - Black alone (%)
Races - Black alone (% change since 2000)
Races - American Indian alone (%)
Races - American Indian alone (% change since 2000)
Races - Asian alone (%)
Races - Asian alone (% change since 2000)
Races - Hispanic (%)
Races - Hispanic (% change since 2000)
Races - Native Hawaiian and Other Pacific Islander alone (%)
Races - Native Hawaiian and Other Pacific Islander alone (% change since 2000)
Races - Two or more races(%)
Races - Two or more races(% change since 2000)
Races - Other race alone (%)
Races - Other race alone (% change since 2000)
Racial diversity
Place of birth - Born in state of residence (%)
Place of birth - Born in state of residence (%) - White
Place of birth - Born in state of residence (%) - Black or African American
Place of birth - Born in state of residence (%) - Asian
Place of birth - Born in state of residence (%) - Hispanic or Latino
Place of birth - Born in state of residence (%) - American Indian and Alaska Native
Place of birth - Born in state of residence (%) - Multirace
Place of birth - Born in state of residence (%) - Other Race
Place of birth - Born in other state (%)
Place of birth - Born in other state (%) - White
Place of birth - Born in other state (%) - Black or African American
Place of birth - Born in other state (%) - Asian
Place of birth - Born in other state (%) - Hispanic or Latino
Place of birth - Born in other state (%) - American Indian and Alaska Native
Place of birth - Born in other state (%) - Multirace
Place of birth - Born in other state (%) - Other Race
Place of birth - Native, outside of US (%)
Place of birth - Native, outside of US (%) - White
Place of birth - Native, outside of US (%) - Black or African American
Place of birth - Native, outside of US (%) - Asian
Place of birth - Native, outside of US (%) - Hispanic or Latino
Place of birth - Native, outside of US (%) - American Indian and Alaska Native
Place of birth - Native, outside of US (%) - Multirace
Place of birth - Native, outside of US (%) - Other Race
Place of birth - Foreign born (%)
Place of birth - Foreign born (%) - White
Place of birth - Foreign born (%) - Black or African American
Place of birth - Foreign born (%) - Asian
Place of birth - Foreign born (%) - Hispanic or Latino
Place of birth - Foreign born (%) - American Indian and Alaska Native
Place of birth - Foreign born (%) - Multirace
Place of birth - Foreign born (%) - Other Race
Residents speaking English at home (%)
Residents speaking English at home - Born in the United States (%)
Residents speaking English at home - Native, born elsewhere (%)
Residents speaking English at home - Foreign born (%)
Residents speaking Spanish at home (%)
Residents speaking Spanish at home - Born in the United States (%)
Residents speaking Spanish at home - Native, born elsewhere (%)
Residents speaking Spanish at home - Foreign born (%)
Residents speaking other language at home (%)
Residents speaking other language at home - Born in the United States (%)
Residents speaking other language at home - Native, born elsewhere (%)
Residents speaking other language at home - Foreign born (%)
Marital status - Never married (%)
Marital status - Now married (%)
Marital status - Separated (%)
Marital status - Widowed (%)
Marital status - Divorced (%)
Ancestries Reported - Arab (%)
Ancestries Reported - Czech (%)
Ancestries Reported - Danish (%)
Ancestries Reported - Dutch (%)
Ancestries Reported - English (%)
Ancestries Reported - French (%)
Ancestries Reported - French Canadian (%)
Ancestries Reported - German (%)
Ancestries Reported - Greek (%)
Ancestries Reported - Hungarian (%)
Ancestries Reported - Irish (%)
Ancestries Reported - Italian (%)
Ancestries Reported - Lithuanian (%)
Ancestries Reported - Norwegian (%)
Ancestries Reported - Polish (%)
Ancestries Reported - Portuguese (%)
Ancestries Reported - Russian (%)
Ancestries Reported - Scotch-Irish (%)
Ancestries Reported - Scottish (%)
Ancestries Reported - Slovak (%)
Ancestries Reported - Subsaharan African (%)
Ancestries Reported - Swedish (%)
Ancestries Reported - Swiss (%)
Ancestries Reported - Ukrainian (%)
Ancestries Reported - United States (%)
Ancestries Reported - Welsh (%)
Ancestries Reported - West Indian (%)
Ancestries Reported - Other (%)
Geographical mobility - Same house 1 year ago (%)
Geographical mobility - Same house 1 year ago (%) - White
Geographical mobility - Same house 1 year ago (%) - Black or African American
Geographical mobility - Same house 1 year ago (%) - Asian
Geographical mobility - Same house 1 year ago (%) - Hispanic or Latino
Geographical mobility - Same house 1 year ago (%) - American Indian and Alaska Native
Geographical mobility - Same house 1 year ago (%) - Multirace
Geographical mobility - Same house 1 year ago (%) - Other Race
Geographical mobility - Moved within same county (%)
Geographical mobility - Moved within same county (%) - White
Geographical mobility - Moved within same county (%) - Black or African American
Geographical mobility - Moved within same county (%) - Asian
Geographical mobility - Moved within same county (%) - Hispanic or Latino
Geographical mobility - Moved within same county (%) - American Indian and Alaska Native
Geographical mobility - Moved within same county (%) - Multirace
Geographical mobility - Moved within same county (%) - Other Race
Geographical mobility - Moved from different county within same state (%)
Geographical mobility - Moved from different county within same state (%) - White
Geographical mobility - Moved from different county within same state (%) - Black or African American
Geographical mobility - Moved from different county within same state (%) - Asian
Geographical mobility - Moved from different county within same state (%) - Hispanic or Latino
Geographical mobility - Moved from different county within same state (%) - American Indian and Alaska Native
Geographical mobility - Moved from different county within same state (%) - Multirace
Geographical mobility - Moved from different county within same state (%) - Other Race
Geographical mobility - Moved from different state (%)
Geographical mobility - Moved from different state (%) - White
Geographical mobility - Moved from different state (%) - Black or African American
Geographical mobility - Moved from different state (%) - Asian
Geographical mobility - Moved from different state (%) - Hispanic or Latino
Geographical mobility - Moved from different state (%) - American Indian and Alaska Native
Geographical mobility - Moved from different state (%) - Multirace
Geographical mobility - Moved from different state (%) - Other Race
Geographical mobility - Moved from abroad (%)
Geographical mobility - Moved from abroad (%) - White
Geographical mobility - Moved from abroad (%) - Black or African American
Geographical mobility - Moved from abroad (%) - Asian
Geographical mobility - Moved from abroad (%) - Hispanic or Latino
Geographical mobility - Moved from abroad (%) - American Indian and Alaska Native
Geographical mobility - Moved from abroad (%) - Multirace
Geographical mobility - Moved from abroad (%) - Other Race
Place of birth for the foreign-born population - Ireland (%)
Place of birth for the foreign-born population - Denmark (%)
Place of birth for the foreign-born population - Norway (%)
Place of birth for the foreign-born population - Sweden (%)
Place of birth for the foreign-born population - United Kingdom (%)
Place of birth for the foreign-born population - England (%)
Place of birth for the foreign-born population - Scotland (%)
Place of birth for the foreign-born population - Other Northern Europe (%)
Place of birth for the foreign-born population - Austria (%)
Place of birth for the foreign-born population - Belgium (%)
Place of birth for the foreign-born population - France (%)
Place of birth for the foreign-born population - Germany (%)
Place of birth for the foreign-born population - Netherlands (%)
Place of birth for the foreign-born population - Switzerland (%)
Place of birth for the foreign-born population - Other Western Europe (%)
Place of birth for the foreign-born population - Greece (%)
Place of birth for the foreign-born population - Italy (%)
Place of birth for the foreign-born population - Portugal (%)
Place of birth for the foreign-born population - Spain (%)
Place of birth for the foreign-born population - Other Southern Europe (%)
Place of birth for the foreign-born population - Albania (%)
Place of birth for the foreign-born population - Belarus (%)
Place of birth for the foreign-born population - Bosnia and Herzegovina (%)
Place of birth for the foreign-born population - Bulgaria (%)
Place of birth for the foreign-born population - Croatia (%)
Place of birth for the foreign-born population - Czechoslovakia (%)
Place of birth for the foreign-born population - Hungary (%)
Place of birth for the foreign-born population - Latvia (%)
Place of birth for the foreign-born population - Lithuania (%)
Place of birth for the foreign-born population - North Macedonia (Macedonia) (%)
Place of birth for the foreign-born population - Moldova (%)
Place of birth for the foreign-born population - Poland (%)
Place of birth for the foreign-born population - Romania (%)
Place of birth for the foreign-born population - Russia (%)
Place of birth for the foreign-born population - Serbia (%)
Place of birth for the foreign-born population - Ukraine (%)
Place of birth for the foreign-born population - Other Eastern Europe (%)
Place of birth for the foreign-born population - China (%)
Place of birth for the foreign-born population - Hong Kong (%)
Place of birth for the foreign-born population - Taiwan (%)
Place of birth for the foreign-born population - Japan (%)
Place of birth for the foreign-born population - Korea (%)
Place of birth for the foreign-born population - Other Eastern Asia (%)
Place of birth for the foreign-born population - Afghanistan (%)
Place of birth for the foreign-born population - Bangladesh (%)
Place of birth for the foreign-born population - India (%)
Place of birth for the foreign-born population - Iran (%)
Place of birth for the foreign-born population - Kazakhstan (%)
Place of birth for the foreign-born population - Nepal (%)
Place of birth for the foreign-born population - Pakistan (%)
Place of birth for the foreign-born population - Sri Lanka (%)
Place of birth for the foreign-born population - Uzbekistan (%)
Place of birth for the foreign-born population - Other South Central Asia (%)
Place of birth for the foreign-born population - Burma (%)
Place of birth for the foreign-born population - Cambodia (%)
Place of birth for the foreign-born population - Indonesia (%)
Place of birth for the foreign-born population - Laos (%)
Place of birth for the foreign-born population - Malaysia (%)
Place of birth for the foreign-born population - Philippines (%)
Place of birth for the foreign-born population - Singapore (%)
Place of birth for the foreign-born population - Thailand (%)
Place of birth for the foreign-born population - Vietnam (%)
Place of birth for the foreign-born population - Other South Eastern Asia (%)
Place of birth for the foreign-born population - Armenia (%)
Place of birth for the foreign-born population - Iraq (%)
Place of birth for the foreign-born population - Israel (%)
Place of birth for the foreign-born population - Jordan (%)
Place of birth for the foreign-born population - Kuwait (%)
Place of birth for the foreign-born population - Lebanon (%)
Place of birth for the foreign-born population - Saudi Arabia (%)
Place of birth for the foreign-born population - Syria (%)
Place of birth for the foreign-born population - Turkey (%)
Place of birth for the foreign-born population - Yemen (%)
Place of birth for the foreign-born population - Other Western Asia (%)
Place of birth for the foreign-born population - Eritrea (%)
Place of birth for the foreign-born population - Ethiopia (%)
Place of birth for the foreign-born population - Kenya (%)
Place of birth for the foreign-born population - Somalia (%)
Place of birth for the foreign-born population - Uganda (%)
Place of birth for the foreign-born population - Zimbabwe (%)
Place of birth for the foreign-born population - Other Eastern Africa (%)
Place of birth for the foreign-born population - Cameroon (%)
Place of birth for the foreign-born population - Congo (%)
Place of birth for the foreign-born population - Democratic Republic of Congo (Zaire) (%)
Place of birth for the foreign-born population - Other Middle Africa (%)
Place of birth for the foreign-born population - Egypt (%)
Place of birth for the foreign-born population - Morocco (%)
Place of birth for the foreign-born population - Sudan (%)
Place of birth for the foreign-born population - Other Northern Africa (%)
Place of birth for the foreign-born population - South Africa (%)
Place of birth for the foreign-born population - Other Southern Africa (%)
Place of birth for the foreign-born population - Cabo Verde (%)
Place of birth for the foreign-born population - Ghana (%)
Place of birth for the foreign-born population - Liberia (%)
Place of birth for the foreign-born population - Nigeria (%)
Place of birth for the foreign-born population - Senegal (%)
Place of birth for the foreign-born population - Sierra Leone (%)
Place of birth for the foreign-born population - Other Western Africa (%)
Place of birth for the foreign-born population - Australia (%)
Place of birth for the foreign-born population - New Zealand (%)
Place of birth for the foreign-born population - Fiji (%)
Place of birth for the foreign-born population - Micronesia (%)
Place of birth for the foreign-born population - Bahamas (%)
Place of birth for the foreign-born population - Barbados (%)
Place of birth for the foreign-born population - Cuba (%)
Place of birth for the foreign-born population - Dominica (%)
Place of birth for the foreign-born population - Dominican Republic (%)
Place of birth for the foreign-born population - Grenada (%)
Place of birth for the foreign-born population - Haiti (%)
Place of birth for the foreign-born population - Jamaica (%)
Place of birth for the foreign-born population - St. Vincent and the Grenadines (%)
Place of birth for the foreign-born population - Trinidad and Tobago (%)
Place of birth for the foreign-born population - West Indies (%)
Place of birth for the foreign-born population - Other Caribbean (%)
Place of birth for the foreign-born population - Belize (%)
Place of birth for the foreign-born population - Costa Rica (%)
Place of birth for the foreign-born population - El Salvador (%)
Place of birth for the foreign-born population - Guatemala (%)
Place of birth for the foreign-born population - Honduras (%)
Place of birth for the foreign-born population - Mexico (%)
Place of birth for the foreign-born population - Nicaragua (%)
Place of birth for the foreign-born population - Panama (%)
Place of birth for the foreign-born population - Other Central America (%)
Place of birth for the foreign-born population - Argentina (%)
Place of birth for the foreign-born population - Bolivia (%)
Place of birth for the foreign-born population - Brazil (%)
Place of birth for the foreign-born population - Chile (%)
Place of birth for the foreign-born population - Colombia (%)
Place of birth for the foreign-born population - Ecuador (%)
Place of birth for the foreign-born population - Guyana (%)
Place of birth for the foreign-born population - Peru (%)
Place of birth for the foreign-born population - Uruguay (%)
Place of birth for the foreign-born population - Venezuela (%)
Place of birth for the foreign-born population - Other South America (%)
Place of birth for the foreign-born population - Canada (%)
Place of birth for the foreign-born population - Other Northern America (%)
Place of birth for the foreign-born population - Other (%)
Latest news about races in Hyattsville, MD collected exclusively by city-data.com from local newspapers, TV, and radio stations
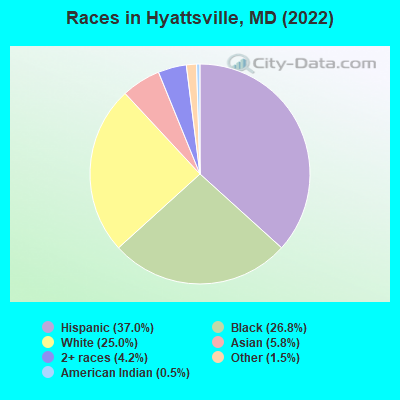
According to 2022 data, the most numerous races in Hyattsville, MD are White alone (5,147 residents), Black alone (5,533 residents), and Hispanic (7,633 residents). 52.4% of Hyattsville residents speak English at home. 38.3% of Hyattsville, MD residents are foreign-born (23.1% born in Latin America, 4.7% born in Africa, 4.3% born in Asia), which is 58.2% greater than the foreign-born rate of 16.0% across the entire state of Maryland.
Race distribution in Hyattsville
2000 2022
3,286,547 62.1% White alone 1,464,735 27.7% Black alone 227,916 4.3% Hispanic 209,738 4.0% Asian alone 82,946 1.6% Two or more races 13,312 0.3% American Indian alone 9,379 0.2% Other race alone 1,913 0.04% Native Hawaiian and Other
2,906,492 47.1% White alone 1,800,914 29.2% Black alone 705,842 11.4% Hispanic 401,818 6.5% Asian alone 291,317 4.7% Two or more races 46,930 0.8% Other race alone 8,930 0.1% American Indian alone 2,417 0.04% Native Hawaiian and Other
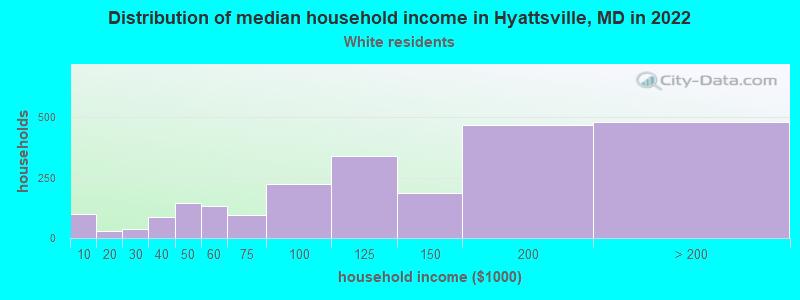
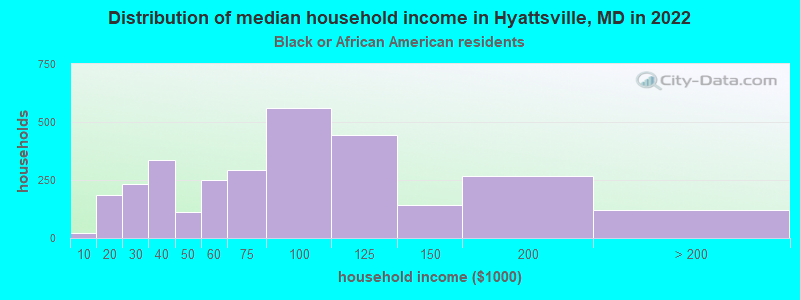
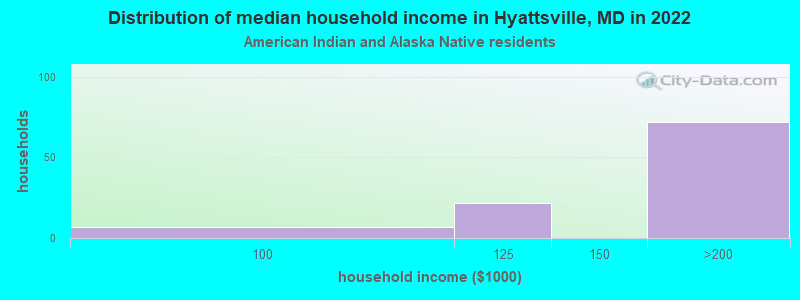
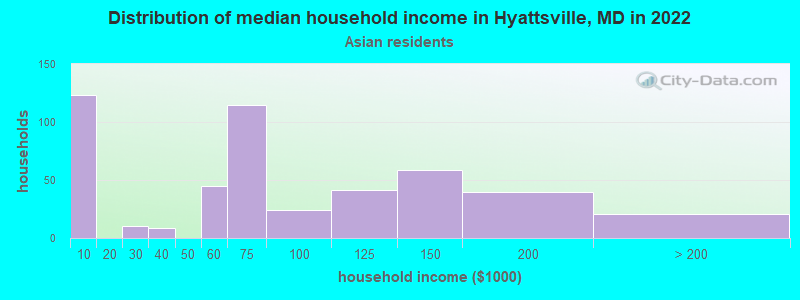
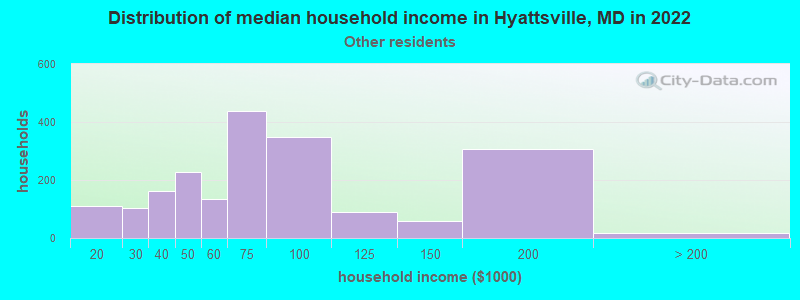
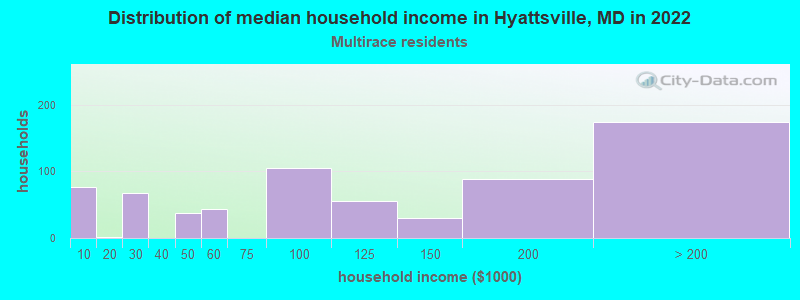
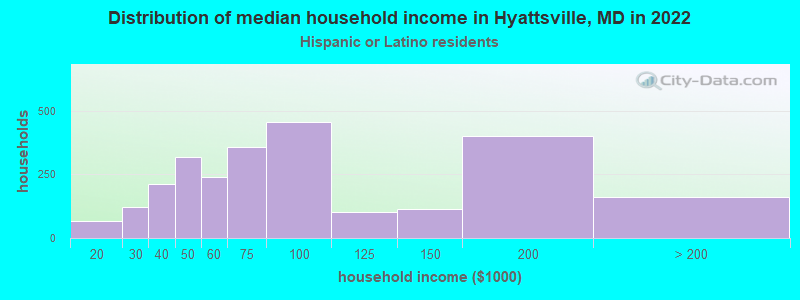
Income and house value in Hyattsville Median household income in 2022 $127,127 White non-Hispanic householders$75,585 Black householdersover $200,000 American Indian and Alaska Native householders$53,308 Asian householders$63,517 Some other race householders$119,251 Two or more races householders$72,789 Hispanic or Latino race householdersMedian 2022 house value $471,367 White Non-Hispanic householders$470,636 Black or African American householders$593,776 American Indian or Alaska Native householders $379,286 Asian householders$485,617 Some other race householders$502,426 Two or more races householders$445,058 Hispanic or Latino householders
Median age by race in Hyattsville
35.5 Median age for White residents35.0 36.2 38.8 Median age for Black or African American residents37.1 40.5 62.5 Median age for American Indian / Alaska Native residents47.2 56.0 37.0 Median age for Asian residents34.8 40.7 -571,600,480.8 Median age for Native Hawaiian / Pacific Islander residents-720,061,021.4 -760,942,760.2 32.6 Median age for Other race residents29.3 35.6 42.4 Median age for Two or more races residents42.7 40.1 35.2 Median age for White alone residents32.9 37.1 35.4 Median age for Hispanic or Latino residents36.0 35.1
Owner/renter occupied households by race in Hyattsville
House owners and renters - White residents 1,483 63.4% Owner occupied858 36.6% Renter occupiedHouse owners and renters - Black or African American residents 968 32.6% Owner occupied1,999 67.4% Renter occupiedHouse owners and renters - American Indian / Alaska Native residents 93 100.0% Owner occupiedHouse owners and renters - Asian residents 295 62.4% Owner occupied178 37.6% Renter occupiedHouse owners and renters - Other race residents 767 43.1% Owner occupied1,013 56.9% Renter occupiedHouse owners and renters - Two or more races residents 604 77.4% Owner occupied176 22.6% Renter occupiedHouse owners and renters - White alone residents 1,476 65.5% Owner occupied778 34.5% Renter occupiedHouse owners and renters - Hispanic or Latino residents 1,173 48.8% Owner occupied1,232 51.2% Renter occupied
Language usage in Hyattsville
English speakers - Total 52.4% of residents of Hyattsville speak English at home.
32.4% of residents speak Spanish at home 2,287 36.6% Speak English very well3,964 63.4% Speak English less than very well16.9% of residents speak other language at home 2,487 76.2% Speak English very well776 23.8% Speak English less than very well
English speakers - Born in the United States 84.2% of residents of Hyattsville speak English at home.
12.3% of residents speak Spanish at home 858 81.6% Speak English very well194 18.4% Speak English less than very well4.3% of residents speak other language at home 364 100.0% Speak English very well
English speakers - Native, born elsewhere 32.5% of residents of Hyattsville speak English at home.
56.8% of residents speak Spanish at home 69 32.4% Speak English very well144 67.6% Speak English less than very well8.3% of residents speak other language at home 31 100.0% Speak English very well
English speakers - Foreign-born 11.2% of residents of Hyattsville speak English at home.
54.9% of residents speak Spanish at home 743 17.1% Speak English very well3,591 82.9% Speak English less than very well33.5% of residents speak other language at home 1,872 70.8% Speak English very well771 29.2% Speak English less than very well
White (Caucasian) - Speak only English Native:
93.2% (4,415)Foreign-born:
34.8% (111)
White (Caucasian) - Speak another language Native:
7.1% (334)Foreign-born:
69.1% (220)
Black or African American - Speak only English Native:
95.7% (3,861)Foreign-born:
24.7% (381)
Black or African American - Speak another language Native:
4.3% (173)Foreign-born:
77.0% (1,189)
American Indian / Alaska Native - Speak another language Native:
88.9% (149)Foreign-born:
99.9% (350)
Asian - Speak only English Native:
19.8% (53)Foreign-born:
6.6% (61)
Asian - Speak another language Native:
91.5% (244)Foreign-born:
91.9% (846)
Other race - Speak only English Native:
16.4% (301)Foreign-born:
1.1% (41)
Other race - Speak another language Native:
83.6% (1,537)Foreign-born:
99.3% (3,827)
Two or more races - Speak only English Native:
87.3% (632)Foreign-born:
32.9% (317)
Two or more races - Speak another language Native:
11.8% (86)Foreign-born:
64.2% (617)
White alone - Speak only English Native:
96.3% (4,324)Foreign-born:
47.9% (104)
White alone - Speak another language Native:
3.3% (150)Foreign-born:
53.0% (115)
Hispanic or Latino - Speak only English Native:
20.4% (505)Foreign-born:
4.2% (201)
Hispanic or Latino - Speak another language Native:
79.4% (1,961)Foreign-born:
95.7% (4,617)
Foreign-born residents in Hyattsville 7,901 residents are foreign born (23.1% Latin America , 4.7% Africa , 4.3% Asia ).
This city:
38.3%Maryland:
15.7%
Marital status for residents in Hyattsville Marital status - White (Caucasian) population 15 years and over
Males 46.9% Never married47.6% Now married1.0% Separated1.2% Widowed3.3% DivorcedFemales 26.1% Never married51.8% Now married1.6% Separated5.6% Widowed14.8% DivorcedWomen who gave birth in the past 12 months Now married:
94.1% (137)Unmarried:
5.9% (9)
Women who did not give birth in the past 12 months Now married:
48.7% (524)Unmarried:
51.3% (551)
Marital status - Black or African American population 15 years and over
Males 54.1% Never married23.9% Now married1.6% Separated0.7% Widowed19.7% DivorcedFemales 57.7% Never married17.8% Now married3.0% Separated6.4% Widowed15.0% DivorcedWomen who gave birth in the past 12 months Now married:
11.1% (16)Unmarried:
88.9% (128)
Women who did not give birth in the past 12 months Now married:
20.3% (314)Unmarried:
79.7% (1,234)
Marital status - American Indian / Alaska Native population 15 years and over
Males 32.0% Never married68.0% Now married0.0% Separated0.0% Widowed0.0% DivorcedFemales 41.4% Never married53.8% Now married0.0% Separated0.0% Widowed4.8% DivorcedWomen who did not give birth in the past 12 months Now married:
42.0% (31)Unmarried:
58.0% (43)
Marital status - Asian population 15 years and over
Males 53.5% Never married44.0% Now married0.0% Separated0.9% Widowed1.6% DivorcedFemales 28.7% Never married65.8% Now married0.0% Separated5.5% Widowed0.0% DivorcedWomen who gave birth in the past 12 months Now married:
100.0% (76)Unmarried:
0.0% (0)
Women who did not give birth in the past 12 months Now married:
60.7% (127)Unmarried:
39.3% (82)
Marital status - Other race population 15 years and over
Males 54.6% Never married39.4% Now married3.2% Separated1.2% Widowed1.5% DivorcedFemales 40.5% Never married51.9% Now married4.3% Separated1.2% Widowed2.1% DivorcedWomen who gave birth in the past 12 months Now married:
0.0% (0)Unmarried:
100.0% (46)
Women who did not give birth in the past 12 months Now married:
57.9% (682)Unmarried:
42.1% (497)
Marital status - Two or more races population 15 years and over
Males 28.1% Never married42.0% Now married0.0% Separated0.0% Widowed29.9% DivorcedFemales 17.8% Never married74.3% Now married0.0% Separated0.0% Widowed7.8% DivorcedWomen who did not give birth in the past 12 months Now married:
69.5% (166)Unmarried:
30.5% (73)
Marital status - White alone, not Hispanic / Latino population 15 years and over
Males 45.3% Never married49.4% Now married1.1% Separated1.3% Widowed2.8% DivorcedFemales 21.7% Never married55.4% Now married1.8% Separated6.3% Widowed14.8% DivorcedWomen who gave birth in the past 12 months Now married:
93.6% (140)Unmarried:
6.4% (10)
Women who did not give birth in the past 12 months Now married:
54.6% (559)Unmarried:
45.4% (465)
Marital status - Hispanic or Latino population 15 years and over
Males 51.8% Never married38.2% Now married2.4% Separated0.9% Widowed6.7% DivorcedFemales 43.9% Never married48.2% Now married3.3% Separated0.9% Widowed3.6% DivorcedWomen who gave birth in the past 12 months Now married:
22.6% (12)Unmarried:
77.4% (42)
Women who did not give birth in the past 12 months Now married:
52.1% (739)Unmarried:
47.9% (680)
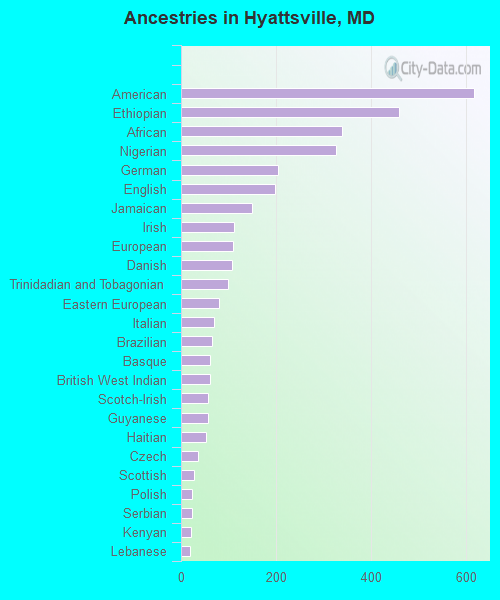
Ancestries in Hyattsville
617 4.5% American459 3.3% Ethiopian339 2.5% African327 2.4% Nigerian205 1.5% German198 1.4% English149 1.1% Jamaican112 0.8% Irish110 0.8% European108 0.8% Danish99 0.7% Trinidadian and Tobagonian80 0.6% Eastern European70 0.5% Italian66 0.5% Brazilian61 0.4% Basque60 0.4% British West Indian56 0.4% Scotch-Irish56 0.4% Guyanese52 0.4% Haitian35 0.3% Czech27 0.2% Scottish24 0.2% Polish23 0.2% Serbian22 0.2% Kenyan18 0.1% Lebanese18 0.1% Norwegian17 0.1% Russian17 0.1% Sierra Leonean17 0.1% Ukrainian16 0.1% Swiss15 0.1% Austrian15 0.1% British14 0.1% Barbadian12 0.09% Romanian11 0.08% Northern European10 0.07% Australian10 0.07% Hungarian6 0.04% Armenian6 0.04% Belgian6 0.04% Scandinavian
Geographical mobility in Hyattsville Same house 1 year ago 4,637 88.6% White (Caucasian)4,462 80.8% Black or African American406 98.9% American Indian / Alaska Native1,129 87.9% Asian62 100.0% Native Hawaiian / Pacific Islander5,408 90.5% Other race1,274 71.2% Two or more races4,427 88.4% White alone, not Hispanic / Latino6,743 88.7% Hispanic or LatinoMoved within same county 141 2.7% White / Caucasian471 8.5% Black or African American45 3.5% Asian324 5.4% Other race45 2.5% Two or more races148 3.0% White alone, not Hispanic / Latino387 5.1% Hispanic or LatinoMoved within same state 93 1.8% White / Caucasian333 6.0% Black or African American44 3.5% Asian336 18.8% Two or more races98 2.0% White alone, not Hispanic / LatinoMoved from different state 276 5.3% White / Caucasian152 2.8% Black or African American13 1.0% Asian91 1.5% Other race15 0.8% Two or more races265 5.3% White alone, not Hispanic / Latino137 1.8% Hispanic or LatinoMoved from abroad 48 0.9% White50 3.9% Asian58 1.0% Other race248 13.8% Two or more races48 1.0% White alone, not Hispanic / Latino338 4.4% Hispanic or Latino
Children Nativity (place of birth) in Hyattsville
Children under 6 years - Living with two parents Both parents native 646 100.0% NativeBoth parents foreign-born 323 77.6% Native93 22.4% Foreign-bornOne native, one foreign-born parent 99 100.0% NativeChildren under 6 years - Living with one parent Native parent 101 99.9% Native0 0.1% Foreign-bornForeign-born parent 174 82.7% Native36 17.3% Foreign-bornChildren 6 to 17 years - Living with two parents Both parents native 357 98.5% Native5 1.5% Foreign-bornBoth parents foreign-born 651 66.1% Native334 33.9% Foreign-bornOne native, one foreign-born parent 150 100.0% NativeChildren 6 to 17 years - Living with one parent Foreign-born parent 885 57.8% Native646 42.2% Foreign-born
Grandparents responsible for own grandchildren in Hyattsville
Grandparents (30 to 59 years) White / Caucasian 12 100.0% Not responsible for grandchildrenAsian 74 100.0% Responsible for grandchildrenOther race 44 50.8% Responsible for grandchildren43 49.2% Not responsible for grandchildrenHispanic or Latino 41 41.8% Responsible for grandchildren58 58.2% Not responsible for grandchildrenGrandparents (60 years and over) White / Caucasian 7 37.6% Responsible for grandchildren11 62.4% Not responsible for grandchildrenAsian 48 100.0% Responsible for grandchildrenOther race 38 46.4% Responsible for grandchildren44 53.6% Not responsible for grandchildrenHispanic or Latino 33 39.5% Responsible for grandchildren51 60.5% Not responsible for grandchildren