Races in La Porte, Texas (TX) Detailed Stats
Data:
Races - White alone (%)
Races - White alone (% change since 2000)
Races - Black alone (%)
Races - Black alone (% change since 2000)
Races - American Indian alone (%)
Races - American Indian alone (% change since 2000)
Races - Asian alone (%)
Races - Asian alone (% change since 2000)
Races - Hispanic (%)
Races - Hispanic (% change since 2000)
Races - Native Hawaiian and Other Pacific Islander alone (%)
Races - Native Hawaiian and Other Pacific Islander alone (% change since 2000)
Races - Two or more races(%)
Races - Two or more races(% change since 2000)
Races - Other race alone (%)
Races - Other race alone (% change since 2000)
Racial diversity
Place of birth - Born in state of residence (%)
Place of birth - Born in state of residence (%) - White
Place of birth - Born in state of residence (%) - Black or African American
Place of birth - Born in state of residence (%) - Asian
Place of birth - Born in state of residence (%) - Hispanic or Latino
Place of birth - Born in state of residence (%) - American Indian and Alaska Native
Place of birth - Born in state of residence (%) - Multirace
Place of birth - Born in state of residence (%) - Other Race
Place of birth - Born in other state (%)
Place of birth - Born in other state (%) - White
Place of birth - Born in other state (%) - Black or African American
Place of birth - Born in other state (%) - Asian
Place of birth - Born in other state (%) - Hispanic or Latino
Place of birth - Born in other state (%) - American Indian and Alaska Native
Place of birth - Born in other state (%) - Multirace
Place of birth - Born in other state (%) - Other Race
Place of birth - Native, outside of US (%)
Place of birth - Native, outside of US (%) - White
Place of birth - Native, outside of US (%) - Black or African American
Place of birth - Native, outside of US (%) - Asian
Place of birth - Native, outside of US (%) - Hispanic or Latino
Place of birth - Native, outside of US (%) - American Indian and Alaska Native
Place of birth - Native, outside of US (%) - Multirace
Place of birth - Native, outside of US (%) - Other Race
Place of birth - Foreign born (%)
Place of birth - Foreign born (%) - White
Place of birth - Foreign born (%) - Black or African American
Place of birth - Foreign born (%) - Asian
Place of birth - Foreign born (%) - Hispanic or Latino
Place of birth - Foreign born (%) - American Indian and Alaska Native
Place of birth - Foreign born (%) - Multirace
Place of birth - Foreign born (%) - Other Race
Residents speaking English at home (%)
Residents speaking English at home - Born in the United States (%)
Residents speaking English at home - Native, born elsewhere (%)
Residents speaking English at home - Foreign born (%)
Residents speaking Spanish at home (%)
Residents speaking Spanish at home - Born in the United States (%)
Residents speaking Spanish at home - Native, born elsewhere (%)
Residents speaking Spanish at home - Foreign born (%)
Residents speaking other language at home (%)
Residents speaking other language at home - Born in the United States (%)
Residents speaking other language at home - Native, born elsewhere (%)
Residents speaking other language at home - Foreign born (%)
Marital status - Never married (%)
Marital status - Now married (%)
Marital status - Separated (%)
Marital status - Widowed (%)
Marital status - Divorced (%)
Ancestries Reported - Arab (%)
Ancestries Reported - Czech (%)
Ancestries Reported - Danish (%)
Ancestries Reported - Dutch (%)
Ancestries Reported - English (%)
Ancestries Reported - French (%)
Ancestries Reported - French Canadian (%)
Ancestries Reported - German (%)
Ancestries Reported - Greek (%)
Ancestries Reported - Hungarian (%)
Ancestries Reported - Irish (%)
Ancestries Reported - Italian (%)
Ancestries Reported - Lithuanian (%)
Ancestries Reported - Norwegian (%)
Ancestries Reported - Polish (%)
Ancestries Reported - Portuguese (%)
Ancestries Reported - Russian (%)
Ancestries Reported - Scotch-Irish (%)
Ancestries Reported - Scottish (%)
Ancestries Reported - Slovak (%)
Ancestries Reported - Subsaharan African (%)
Ancestries Reported - Swedish (%)
Ancestries Reported - Swiss (%)
Ancestries Reported - Ukrainian (%)
Ancestries Reported - United States (%)
Ancestries Reported - Welsh (%)
Ancestries Reported - West Indian (%)
Ancestries Reported - Other (%)
Geographical mobility - Same house 1 year ago (%)
Geographical mobility - Same house 1 year ago (%) - White
Geographical mobility - Same house 1 year ago (%) - Black or African American
Geographical mobility - Same house 1 year ago (%) - Asian
Geographical mobility - Same house 1 year ago (%) - Hispanic or Latino
Geographical mobility - Same house 1 year ago (%) - American Indian and Alaska Native
Geographical mobility - Same house 1 year ago (%) - Multirace
Geographical mobility - Same house 1 year ago (%) - Other Race
Geographical mobility - Moved within same county (%)
Geographical mobility - Moved within same county (%) - White
Geographical mobility - Moved within same county (%) - Black or African American
Geographical mobility - Moved within same county (%) - Asian
Geographical mobility - Moved within same county (%) - Hispanic or Latino
Geographical mobility - Moved within same county (%) - American Indian and Alaska Native
Geographical mobility - Moved within same county (%) - Multirace
Geographical mobility - Moved within same county (%) - Other Race
Geographical mobility - Moved from different county within same state (%)
Geographical mobility - Moved from different county within same state (%) - White
Geographical mobility - Moved from different county within same state (%) - Black or African American
Geographical mobility - Moved from different county within same state (%) - Asian
Geographical mobility - Moved from different county within same state (%) - Hispanic or Latino
Geographical mobility - Moved from different county within same state (%) - American Indian and Alaska Native
Geographical mobility - Moved from different county within same state (%) - Multirace
Geographical mobility - Moved from different county within same state (%) - Other Race
Geographical mobility - Moved from different state (%)
Geographical mobility - Moved from different state (%) - White
Geographical mobility - Moved from different state (%) - Black or African American
Geographical mobility - Moved from different state (%) - Asian
Geographical mobility - Moved from different state (%) - Hispanic or Latino
Geographical mobility - Moved from different state (%) - American Indian and Alaska Native
Geographical mobility - Moved from different state (%) - Multirace
Geographical mobility - Moved from different state (%) - Other Race
Geographical mobility - Moved from abroad (%)
Geographical mobility - Moved from abroad (%) - White
Geographical mobility - Moved from abroad (%) - Black or African American
Geographical mobility - Moved from abroad (%) - Asian
Geographical mobility - Moved from abroad (%) - Hispanic or Latino
Geographical mobility - Moved from abroad (%) - American Indian and Alaska Native
Geographical mobility - Moved from abroad (%) - Multirace
Geographical mobility - Moved from abroad (%) - Other Race
Place of birth for the foreign-born population - Ireland (%)
Place of birth for the foreign-born population - Denmark (%)
Place of birth for the foreign-born population - Norway (%)
Place of birth for the foreign-born population - Sweden (%)
Place of birth for the foreign-born population - United Kingdom (%)
Place of birth for the foreign-born population - England (%)
Place of birth for the foreign-born population - Scotland (%)
Place of birth for the foreign-born population - Other Northern Europe (%)
Place of birth for the foreign-born population - Austria (%)
Place of birth for the foreign-born population - Belgium (%)
Place of birth for the foreign-born population - France (%)
Place of birth for the foreign-born population - Germany (%)
Place of birth for the foreign-born population - Netherlands (%)
Place of birth for the foreign-born population - Switzerland (%)
Place of birth for the foreign-born population - Other Western Europe (%)
Place of birth for the foreign-born population - Greece (%)
Place of birth for the foreign-born population - Italy (%)
Place of birth for the foreign-born population - Portugal (%)
Place of birth for the foreign-born population - Spain (%)
Place of birth for the foreign-born population - Other Southern Europe (%)
Place of birth for the foreign-born population - Albania (%)
Place of birth for the foreign-born population - Belarus (%)
Place of birth for the foreign-born population - Bosnia and Herzegovina (%)
Place of birth for the foreign-born population - Bulgaria (%)
Place of birth for the foreign-born population - Croatia (%)
Place of birth for the foreign-born population - Czechoslovakia (%)
Place of birth for the foreign-born population - Hungary (%)
Place of birth for the foreign-born population - Latvia (%)
Place of birth for the foreign-born population - Lithuania (%)
Place of birth for the foreign-born population - North Macedonia (Macedonia) (%)
Place of birth for the foreign-born population - Moldova (%)
Place of birth for the foreign-born population - Poland (%)
Place of birth for the foreign-born population - Romania (%)
Place of birth for the foreign-born population - Russia (%)
Place of birth for the foreign-born population - Serbia (%)
Place of birth for the foreign-born population - Ukraine (%)
Place of birth for the foreign-born population - Other Eastern Europe (%)
Place of birth for the foreign-born population - China (%)
Place of birth for the foreign-born population - Hong Kong (%)
Place of birth for the foreign-born population - Taiwan (%)
Place of birth for the foreign-born population - Japan (%)
Place of birth for the foreign-born population - Korea (%)
Place of birth for the foreign-born population - Other Eastern Asia (%)
Place of birth for the foreign-born population - Afghanistan (%)
Place of birth for the foreign-born population - Bangladesh (%)
Place of birth for the foreign-born population - India (%)
Place of birth for the foreign-born population - Iran (%)
Place of birth for the foreign-born population - Kazakhstan (%)
Place of birth for the foreign-born population - Nepal (%)
Place of birth for the foreign-born population - Pakistan (%)
Place of birth for the foreign-born population - Sri Lanka (%)
Place of birth for the foreign-born population - Uzbekistan (%)
Place of birth for the foreign-born population - Other South Central Asia (%)
Place of birth for the foreign-born population - Burma (%)
Place of birth for the foreign-born population - Cambodia (%)
Place of birth for the foreign-born population - Indonesia (%)
Place of birth for the foreign-born population - Laos (%)
Place of birth for the foreign-born population - Malaysia (%)
Place of birth for the foreign-born population - Philippines (%)
Place of birth for the foreign-born population - Singapore (%)
Place of birth for the foreign-born population - Thailand (%)
Place of birth for the foreign-born population - Vietnam (%)
Place of birth for the foreign-born population - Other South Eastern Asia (%)
Place of birth for the foreign-born population - Armenia (%)
Place of birth for the foreign-born population - Iraq (%)
Place of birth for the foreign-born population - Israel (%)
Place of birth for the foreign-born population - Jordan (%)
Place of birth for the foreign-born population - Kuwait (%)
Place of birth for the foreign-born population - Lebanon (%)
Place of birth for the foreign-born population - Saudi Arabia (%)
Place of birth for the foreign-born population - Syria (%)
Place of birth for the foreign-born population - Turkey (%)
Place of birth for the foreign-born population - Yemen (%)
Place of birth for the foreign-born population - Other Western Asia (%)
Place of birth for the foreign-born population - Eritrea (%)
Place of birth for the foreign-born population - Ethiopia (%)
Place of birth for the foreign-born population - Kenya (%)
Place of birth for the foreign-born population - Somalia (%)
Place of birth for the foreign-born population - Uganda (%)
Place of birth for the foreign-born population - Zimbabwe (%)
Place of birth for the foreign-born population - Other Eastern Africa (%)
Place of birth for the foreign-born population - Cameroon (%)
Place of birth for the foreign-born population - Congo (%)
Place of birth for the foreign-born population - Democratic Republic of Congo (Zaire) (%)
Place of birth for the foreign-born population - Other Middle Africa (%)
Place of birth for the foreign-born population - Egypt (%)
Place of birth for the foreign-born population - Morocco (%)
Place of birth for the foreign-born population - Sudan (%)
Place of birth for the foreign-born population - Other Northern Africa (%)
Place of birth for the foreign-born population - South Africa (%)
Place of birth for the foreign-born population - Other Southern Africa (%)
Place of birth for the foreign-born population - Cabo Verde (%)
Place of birth for the foreign-born population - Ghana (%)
Place of birth for the foreign-born population - Liberia (%)
Place of birth for the foreign-born population - Nigeria (%)
Place of birth for the foreign-born population - Senegal (%)
Place of birth for the foreign-born population - Sierra Leone (%)
Place of birth for the foreign-born population - Other Western Africa (%)
Place of birth for the foreign-born population - Australia (%)
Place of birth for the foreign-born population - New Zealand (%)
Place of birth for the foreign-born population - Fiji (%)
Place of birth for the foreign-born population - Micronesia (%)
Place of birth for the foreign-born population - Bahamas (%)
Place of birth for the foreign-born population - Barbados (%)
Place of birth for the foreign-born population - Cuba (%)
Place of birth for the foreign-born population - Dominica (%)
Place of birth for the foreign-born population - Dominican Republic (%)
Place of birth for the foreign-born population - Grenada (%)
Place of birth for the foreign-born population - Haiti (%)
Place of birth for the foreign-born population - Jamaica (%)
Place of birth for the foreign-born population - St. Vincent and the Grenadines (%)
Place of birth for the foreign-born population - Trinidad and Tobago (%)
Place of birth for the foreign-born population - West Indies (%)
Place of birth for the foreign-born population - Other Caribbean (%)
Place of birth for the foreign-born population - Belize (%)
Place of birth for the foreign-born population - Costa Rica (%)
Place of birth for the foreign-born population - El Salvador (%)
Place of birth for the foreign-born population - Guatemala (%)
Place of birth for the foreign-born population - Honduras (%)
Place of birth for the foreign-born population - Mexico (%)
Place of birth for the foreign-born population - Nicaragua (%)
Place of birth for the foreign-born population - Panama (%)
Place of birth for the foreign-born population - Other Central America (%)
Place of birth for the foreign-born population - Argentina (%)
Place of birth for the foreign-born population - Bolivia (%)
Place of birth for the foreign-born population - Brazil (%)
Place of birth for the foreign-born population - Chile (%)
Place of birth for the foreign-born population - Colombia (%)
Place of birth for the foreign-born population - Ecuador (%)
Place of birth for the foreign-born population - Guyana (%)
Place of birth for the foreign-born population - Peru (%)
Place of birth for the foreign-born population - Uruguay (%)
Place of birth for the foreign-born population - Venezuela (%)
Place of birth for the foreign-born population - Other South America (%)
Place of birth for the foreign-born population - Canada (%)
Place of birth for the foreign-born population - Other Northern America (%)
Place of birth for the foreign-born population - Other (%)
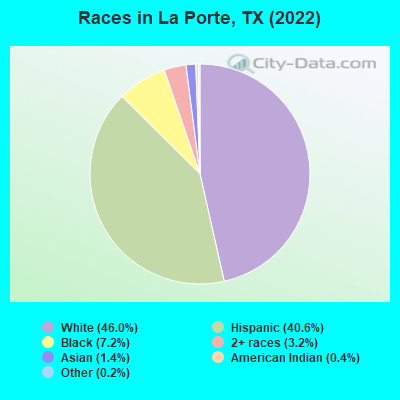
According to 2022 data, the most numerous races in La Porte, TX are Hispanic (14,680 residents), White alone (16,648 residents), and Black alone (2,593 residents). 75.9% of La Porte residents speak English at home. 9.7% of La Porte, TX residents are foreign-born (7.7% born in Latin America, 1.4% born in Asia), which is 75.3% less than the foreign-born rate of 17.0% across the entire state of Texas.
Race distribution in La Porte
2000 2022
10,933,313 52.4% White alone 6,669,666 32.0% Hispanic 2,364,255 11.3% Black alone 554,445 2.7% Asian alone 230,567 1.1% Two or more races 68,859 0.3% American Indian alone 19,958 0.10% Other race alone 10,757 0.05% Native Hawaiian and Other
12,070,642 40.2% Hispanic 11,683,430 38.9% White alone 3,508,706 11.7% Black alone 1,608,173 5.4% Asian alone 956,560 3.2% Two or more races 125,763 0.4% Other race alone 47,023 0.2% American Indian alone 29,275 0.10% Native Hawaiian and Other
Income and house value in La Porte Median household income in 2022 $77,958 White non-Hispanic householders$51,191 Black householders$89,884 American Indian and Alaska Native householders$50,266 Asian householders$84,333 Some other race householders$67,560 Two or more races householders$78,989 Hispanic or Latino race householdersMedian 2022 house value $226,492 White Non-Hispanic householders$210,334 Black or African American householders$198,557 American Indian or Alaska Native householders $215,537 Asian householders$219,919 Some other race householders$229,779 Two or more races householders$222,658 Hispanic or Latino householders
Median age by race in La Porte
45.0 Median age for White residents42.9 46.8 35.6 Median age for Black or African American residents28.7 49.3 29.1 Median age for American Indian / Alaska Native residents14.0 39.2 46.6 Median age for Asian residents46.3 47.2 -782,795,698.1 Median age for Native Hawaiian / Pacific Islander residents-633,771,929.2 -816,367,264.7 35.9 Median age for Other race residents36.0 33.5 21.2 Median age for Two or more races residents17.0 25.1 46.7 Median age for White alone residents43.9 49.5 28.1 Median age for Hispanic or Latino residents28.4 28.0
Owner/renter occupied households by race in La Porte
House owners and renters - White residents 5,696 73.5% Owner occupied2,056 26.5% Renter occupiedHouse owners and renters - Black or African American residents 481 53.1% Owner occupied425 46.9% Renter occupiedHouse owners and renters - American Indian / Alaska Native residents 361 79.8% Owner occupied91 20.2% Renter occupiedHouse owners and renters - Asian residents 95 42.1% Owner occupied131 57.9% Renter occupiedHouse owners and renters - Other race residents 775 78.2% Owner occupied216 21.8% Renter occupiedHouse owners and renters - Two or more races residents 1,809 79.0% Owner occupied480 21.0% Renter occupiedHouse owners and renters - White alone residents 5,269 71.0% Owner occupied2,150 29.0% Renter occupiedHouse owners and renters - Hispanic or Latino residents 3,171 76.0% Owner occupied1,001 24.0% Renter occupied
Language usage in La Porte
English speakers - Total 75.9% of residents of La Porte speak English at home.
20.9% of residents speak Spanish at home 5,493 77.9% Speak English very well1,562 22.1% Speak English less than very well2.4% of residents speak other language at home 470 57.8% Speak English very well343 42.2% Speak English less than very well
English speakers - Born in the United States 90.7% of residents of La Porte speak English at home.
7.6% of residents speak Spanish at home 530 93.1% Speak English very well39 6.9% Speak English less than very well1.3% of residents speak other language at home 100 100.0% Speak English very well
English speakers - Native, born elsewhere 32.5% of residents of La Porte speak English at home.
49.3% of residents speak Spanish at home 133 92.4% Speak English very well11 7.6% Speak English less than very well14.4% of residents speak other language at home 42 100.0% Speak English very well
English speakers - Foreign-born 12.8% of residents of La Porte speak English at home.
70.5% of residents speak Spanish at home 1,399 56.5% Speak English very well1,075 43.5% Speak English less than very well17.0% of residents speak other language at home 281 47.1% Speak English very well316 52.9% Speak English less than very well
White (Caucasian) - Speak only English Native:
97.9% (17,156)Foreign-born:
34.0% (214)
White (Caucasian) - Speak another language Native:
7.4% (1,290)Foreign-born:
70.2% (441)
Black or African American - Speak only English Native:
96.9% (2,149)Foreign-born:
41.5% (75)
Black or African American - Speak another language Native:
2.9% (64)Foreign-born:
56.9% (102)
American Indian / Alaska Native - Speak another language Native:
27.1% (262)Foreign-born:
98.9% (335)
Asian - Speak another language Native:
99.0% (19)Foreign-born:
96.5% (468)
Other race - Speak only English Native:
43.0% (857)Foreign-born:
12.3% (95)
Other race - Speak another language Native:
58.4% (1,163)Foreign-born:
87.0% (672)
Two or more races - Speak another language Native:
27.5% (1,750)Foreign-born:
100.0% (1,012)
White alone - Speak only English Native:
98.1% (15,739)Foreign-born:
78.2% (132)
White alone - Speak another language Native:
1.8% (283)Foreign-born:
24.3% (41)
Hispanic or Latino - Speak only English Native:
56.6% (5,860)Foreign-born:
8.4% (227)
Hispanic or Latino - Speak another language Native:
42.6% (4,410)Foreign-born:
91.7% (2,471)
Foreign-born residents in La Porte 3,510 residents are foreign born (7.7% Latin America , 1.4% Asia ).
This city:
9.7%Texas:
17.1%
Marital status for residents in La Porte Marital status - White (Caucasian) population 15 years and over
Males 27.9% Never married55.5% Now married2.9% Separated3.3% Widowed10.3% DivorcedFemales 21.7% Never married47.7% Now married2.8% Separated8.8% Widowed19.0% DivorcedWomen who gave birth in the past 12 months Now married:
56.4% (125)Unmarried:
43.6% (97)
Women who did not give birth in the past 12 months Now married:
44.1% (1,596)Unmarried:
55.9% (2,025)
Marital status - Black or African American population 15 years and over
Males 62.2% Never married28.9% Now married1.5% Separated0.0% Widowed7.4% DivorcedFemales 30.1% Never married25.6% Now married0.4% Separated18.9% Widowed25.0% DivorcedWomen who gave birth in the past 12 months Now married:
100.0% (14)Unmarried:
0.0% (0)
Women who did not give birth in the past 12 months Now married:
27.6% (168)Unmarried:
72.4% (442)
Marital status - American Indian / Alaska Native population 15 years and over
Males 69.5% Never married27.6% Now married0.0% Separated2.2% Widowed0.7% DivorcedFemales 43.1% Never married34.7% Now married19.1% Separated2.3% Widowed0.8% DivorcedWomen who gave birth in the past 12 months Now married:
100.0% (73)Unmarried:
0.0% (0)
Women who did not give birth in the past 12 months Now married:
0.0% (0)Unmarried:
100.0% (208)
Marital status - Asian population 15 years and over
Males 12.1% Never married87.9% Now married0.0% Separated0.0% Widowed0.0% DivorcedFemales 0.0% Never married85.4% Now married0.0% Separated6.7% Widowed7.9% DivorcedWomen who gave birth in the past 12 months Now married:
100.0% (14)Unmarried:
0.0% (0)
Women who did not give birth in the past 12 months Now married:
100.0% (122)Unmarried:
0.0% (0)
Marital status - Other race population 15 years and over
Males 29.0% Never married64.8% Now married0.0% Separated1.1% Widowed5.1% DivorcedFemales 36.4% Never married59.9% Now married2.4% Separated0.0% Widowed1.3% DivorcedWomen who gave birth in the past 12 months Now married:
94.7% (26)Unmarried:
5.3% (1)
Women who did not give birth in the past 12 months Now married:
50.4% (449)Unmarried:
49.6% (442)
Marital status - Two or more races population 15 years and over
Males 31.1% Never married61.2% Now married0.6% Separated1.0% Widowed6.1% DivorcedFemales 29.8% Never married46.5% Now married14.2% Separated5.8% Widowed3.7% DivorcedWomen who gave birth in the past 12 months Now married:
79.2% (84)Unmarried:
20.8% (22)
Women who did not give birth in the past 12 months Now married:
61.1% (1,264)Unmarried:
38.9% (804)
Marital status - White alone, not Hispanic / Latino population 15 years and over
Males 25.8% Never married56.2% Now married2.7% Separated3.7% Widowed11.5% DivorcedFemales 18.6% Never married46.6% Now married2.2% Separated11.0% Widowed21.5% DivorcedWomen who gave birth in the past 12 months Now married:
48.4% (74)Unmarried:
51.6% (79)
Women who did not give birth in the past 12 months Now married:
45.0% (1,502)Unmarried:
55.0% (1,838)
Marital status - Hispanic or Latino population 15 years and over
Males 34.1% Never married56.6% Now married2.0% Separated1.6% Widowed5.6% DivorcedFemales 33.2% Never married49.7% Now married8.4% Separated2.3% Widowed6.3% DivorcedWomen who gave birth in the past 12 months Now married:
75.8% (180)Unmarried:
24.2% (57)
Women who did not give birth in the past 12 months Now married:
48.4% (1,721)Unmarried:
51.6% (1,835)
Ancestries in La Porte
1,745 9.7% American1,121 6.2% English936 5.2% German642 3.6% Irish366 2.0% European139 0.8% French117 0.6% Scotch-Irish98 0.5% Italian76 0.4% British60 0.3% Czech56 0.3% Polish53 0.3% Norwegian48 0.3% Cajun35 0.2% Scottish31 0.2% Dutch29 0.2% British West Indian27 0.1% African21 0.1% French Canadian20 0.1% Russian16 0.09% Welsh15 0.08% Jordanian14 0.08% Iranian13 0.07% Romanian12 0.07% Slovak11 0.06% Eastern European10 0.06% Trinidadian and Tobagonian9 0.05% Nigerian7 0.04% Jamaican6 0.03% Scandinavian5 0.03% Czechoslovakian5 0.03% Greek
Geographical mobility in La Porte Same house 1 year ago 15,122 87.4% White (Caucasian)2,247 87.2% Black or African American1,447 94.8% American Indian / Alaska Native509 97.6% Asian2,580 88.2% Other race7,512 87.6% Two or more races14,331 86.5% White alone, not Hispanic / Latino12,709 88.9% Hispanic or LatinoMoved within same county 1,275 7.4% White / Caucasian205 7.9% Black or African American87 5.7% American Indian / Alaska Native149 5.1% Other race656 7.6% Two or more races1,330 8.0% White alone, not Hispanic / Latino1,025 7.2% Hispanic or LatinoMoved within same state 582 3.4% White / Caucasian104 3.6% Other race112 1.3% Two or more races548 3.3% White alone, not Hispanic / Latino222 1.6% Hispanic or LatinoMoved from different state 367 2.1% White / Caucasian179 7.0% Black or African American71 2.4% Other race265 3.1% Two or more races366 2.2% White alone, not Hispanic / Latino335 2.3% Hispanic or LatinoMoved from abroad 11 2.1% Asian
Children Nativity (place of birth) in La Porte
Children under 6 years - Living with two parents Both parents native 1,418 100.0% NativeBoth parents foreign-born 163 100.0% NativeOne native, one foreign-born parent 243 100.0% NativeChildren under 6 years - Living with one parent Native parent 1,082 100.0% NativeForeign-born parent 41 100.0% NativeChildren 6 to 17 years - Living with two parents Both parents native 2,007 99.9% Native3 0.1% Foreign-bornBoth parents foreign-born 547 88.4% Native72 11.6% Foreign-bornOne native, one foreign-born parent 544 100.0% NativeChildren 6 to 17 years - Living with one parent Native parent 1,850 100.0% NativeForeign-born parent 530 50.8% Native513 49.2% Foreign-born
Grandparents responsible for own grandchildren in La Porte
Grandparents (30 to 59 years) White / Caucasian 85 38.5% Responsible for grandchildren136 61.5% Not responsible for grandchildrenBlack or African American 59 86.4% Responsible for grandchildren9 13.6% Not responsible for grandchildrenTwo or more races 46 100.0% Not responsible for grandchildrenWhite alone, not Hispanic / Latino 98 35.1% Responsible for grandchildren182 64.9% Not responsible for grandchildrenHispanic or Latino 43 28.8% Responsible for grandchildren107 71.2% Not responsible for grandchildrenGrandparents (60 years and over) White / Caucasian 90 55.6% Responsible for grandchildren72 44.4% Not responsible for grandchildrenBlack or African American 9 100.0% Responsible for grandchildrenTwo or more races 13 9.5% Responsible for grandchildren120 90.5% Not responsible for grandchildrenWhite alone, not Hispanic / Latino 125 54.6% Responsible for grandchildren104 45.4% Not responsible for grandchildrenHispanic or Latino 102 100.0% Not responsible for grandchildren