Races in Las Vegas, New Mexico (NM) Detailed Stats
Data:
Races - White alone (%)
Races - White alone (% change since 2000)
Races - Black alone (%)
Races - Black alone (% change since 2000)
Races - American Indian alone (%)
Races - American Indian alone (% change since 2000)
Races - Asian alone (%)
Races - Asian alone (% change since 2000)
Races - Hispanic (%)
Races - Hispanic (% change since 2000)
Races - Native Hawaiian and Other Pacific Islander alone (%)
Races - Native Hawaiian and Other Pacific Islander alone (% change since 2000)
Races - Two or more races(%)
Races - Two or more races(% change since 2000)
Races - Other race alone (%)
Races - Other race alone (% change since 2000)
Racial diversity
Place of birth - Born in state of residence (%)
Place of birth - Born in state of residence (%) - White
Place of birth - Born in state of residence (%) - Black or African American
Place of birth - Born in state of residence (%) - Asian
Place of birth - Born in state of residence (%) - Hispanic or Latino
Place of birth - Born in state of residence (%) - American Indian and Alaska Native
Place of birth - Born in state of residence (%) - Multirace
Place of birth - Born in state of residence (%) - Other Race
Place of birth - Born in other state (%)
Place of birth - Born in other state (%) - White
Place of birth - Born in other state (%) - Black or African American
Place of birth - Born in other state (%) - Asian
Place of birth - Born in other state (%) - Hispanic or Latino
Place of birth - Born in other state (%) - American Indian and Alaska Native
Place of birth - Born in other state (%) - Multirace
Place of birth - Born in other state (%) - Other Race
Place of birth - Native, outside of US (%)
Place of birth - Native, outside of US (%) - White
Place of birth - Native, outside of US (%) - Black or African American
Place of birth - Native, outside of US (%) - Asian
Place of birth - Native, outside of US (%) - Hispanic or Latino
Place of birth - Native, outside of US (%) - American Indian and Alaska Native
Place of birth - Native, outside of US (%) - Multirace
Place of birth - Native, outside of US (%) - Other Race
Place of birth - Foreign born (%)
Place of birth - Foreign born (%) - White
Place of birth - Foreign born (%) - Black or African American
Place of birth - Foreign born (%) - Asian
Place of birth - Foreign born (%) - Hispanic or Latino
Place of birth - Foreign born (%) - American Indian and Alaska Native
Place of birth - Foreign born (%) - Multirace
Place of birth - Foreign born (%) - Other Race
Residents speaking English at home (%)
Residents speaking English at home - Born in the United States (%)
Residents speaking English at home - Native, born elsewhere (%)
Residents speaking English at home - Foreign born (%)
Residents speaking Spanish at home (%)
Residents speaking Spanish at home - Born in the United States (%)
Residents speaking Spanish at home - Native, born elsewhere (%)
Residents speaking Spanish at home - Foreign born (%)
Residents speaking other language at home (%)
Residents speaking other language at home - Born in the United States (%)
Residents speaking other language at home - Native, born elsewhere (%)
Residents speaking other language at home - Foreign born (%)
Marital status - Never married (%)
Marital status - Now married (%)
Marital status - Separated (%)
Marital status - Widowed (%)
Marital status - Divorced (%)
Ancestries Reported - Arab (%)
Ancestries Reported - Czech (%)
Ancestries Reported - Danish (%)
Ancestries Reported - Dutch (%)
Ancestries Reported - English (%)
Ancestries Reported - French (%)
Ancestries Reported - French Canadian (%)
Ancestries Reported - German (%)
Ancestries Reported - Greek (%)
Ancestries Reported - Hungarian (%)
Ancestries Reported - Irish (%)
Ancestries Reported - Italian (%)
Ancestries Reported - Lithuanian (%)
Ancestries Reported - Norwegian (%)
Ancestries Reported - Polish (%)
Ancestries Reported - Portuguese (%)
Ancestries Reported - Russian (%)
Ancestries Reported - Scotch-Irish (%)
Ancestries Reported - Scottish (%)
Ancestries Reported - Slovak (%)
Ancestries Reported - Subsaharan African (%)
Ancestries Reported - Swedish (%)
Ancestries Reported - Swiss (%)
Ancestries Reported - Ukrainian (%)
Ancestries Reported - United States (%)
Ancestries Reported - Welsh (%)
Ancestries Reported - West Indian (%)
Ancestries Reported - Other (%)
Geographical mobility - Same house 1 year ago (%)
Geographical mobility - Same house 1 year ago (%) - White
Geographical mobility - Same house 1 year ago (%) - Black or African American
Geographical mobility - Same house 1 year ago (%) - Asian
Geographical mobility - Same house 1 year ago (%) - Hispanic or Latino
Geographical mobility - Same house 1 year ago (%) - American Indian and Alaska Native
Geographical mobility - Same house 1 year ago (%) - Multirace
Geographical mobility - Same house 1 year ago (%) - Other Race
Geographical mobility - Moved within same county (%)
Geographical mobility - Moved within same county (%) - White
Geographical mobility - Moved within same county (%) - Black or African American
Geographical mobility - Moved within same county (%) - Asian
Geographical mobility - Moved within same county (%) - Hispanic or Latino
Geographical mobility - Moved within same county (%) - American Indian and Alaska Native
Geographical mobility - Moved within same county (%) - Multirace
Geographical mobility - Moved within same county (%) - Other Race
Geographical mobility - Moved from different county within same state (%)
Geographical mobility - Moved from different county within same state (%) - White
Geographical mobility - Moved from different county within same state (%) - Black or African American
Geographical mobility - Moved from different county within same state (%) - Asian
Geographical mobility - Moved from different county within same state (%) - Hispanic or Latino
Geographical mobility - Moved from different county within same state (%) - American Indian and Alaska Native
Geographical mobility - Moved from different county within same state (%) - Multirace
Geographical mobility - Moved from different county within same state (%) - Other Race
Geographical mobility - Moved from different state (%)
Geographical mobility - Moved from different state (%) - White
Geographical mobility - Moved from different state (%) - Black or African American
Geographical mobility - Moved from different state (%) - Asian
Geographical mobility - Moved from different state (%) - Hispanic or Latino
Geographical mobility - Moved from different state (%) - American Indian and Alaska Native
Geographical mobility - Moved from different state (%) - Multirace
Geographical mobility - Moved from different state (%) - Other Race
Geographical mobility - Moved from abroad (%)
Geographical mobility - Moved from abroad (%) - White
Geographical mobility - Moved from abroad (%) - Black or African American
Geographical mobility - Moved from abroad (%) - Asian
Geographical mobility - Moved from abroad (%) - Hispanic or Latino
Geographical mobility - Moved from abroad (%) - American Indian and Alaska Native
Geographical mobility - Moved from abroad (%) - Multirace
Geographical mobility - Moved from abroad (%) - Other Race
Place of birth for the foreign-born population - Ireland (%)
Place of birth for the foreign-born population - Denmark (%)
Place of birth for the foreign-born population - Norway (%)
Place of birth for the foreign-born population - Sweden (%)
Place of birth for the foreign-born population - United Kingdom (%)
Place of birth for the foreign-born population - England (%)
Place of birth for the foreign-born population - Scotland (%)
Place of birth for the foreign-born population - Other Northern Europe (%)
Place of birth for the foreign-born population - Austria (%)
Place of birth for the foreign-born population - Belgium (%)
Place of birth for the foreign-born population - France (%)
Place of birth for the foreign-born population - Germany (%)
Place of birth for the foreign-born population - Netherlands (%)
Place of birth for the foreign-born population - Switzerland (%)
Place of birth for the foreign-born population - Other Western Europe (%)
Place of birth for the foreign-born population - Greece (%)
Place of birth for the foreign-born population - Italy (%)
Place of birth for the foreign-born population - Portugal (%)
Place of birth for the foreign-born population - Spain (%)
Place of birth for the foreign-born population - Other Southern Europe (%)
Place of birth for the foreign-born population - Albania (%)
Place of birth for the foreign-born population - Belarus (%)
Place of birth for the foreign-born population - Bosnia and Herzegovina (%)
Place of birth for the foreign-born population - Bulgaria (%)
Place of birth for the foreign-born population - Croatia (%)
Place of birth for the foreign-born population - Czechoslovakia (%)
Place of birth for the foreign-born population - Hungary (%)
Place of birth for the foreign-born population - Latvia (%)
Place of birth for the foreign-born population - Lithuania (%)
Place of birth for the foreign-born population - North Macedonia (Macedonia) (%)
Place of birth for the foreign-born population - Moldova (%)
Place of birth for the foreign-born population - Poland (%)
Place of birth for the foreign-born population - Romania (%)
Place of birth for the foreign-born population - Russia (%)
Place of birth for the foreign-born population - Serbia (%)
Place of birth for the foreign-born population - Ukraine (%)
Place of birth for the foreign-born population - Other Eastern Europe (%)
Place of birth for the foreign-born population - China (%)
Place of birth for the foreign-born population - Hong Kong (%)
Place of birth for the foreign-born population - Taiwan (%)
Place of birth for the foreign-born population - Japan (%)
Place of birth for the foreign-born population - Korea (%)
Place of birth for the foreign-born population - Other Eastern Asia (%)
Place of birth for the foreign-born population - Afghanistan (%)
Place of birth for the foreign-born population - Bangladesh (%)
Place of birth for the foreign-born population - India (%)
Place of birth for the foreign-born population - Iran (%)
Place of birth for the foreign-born population - Kazakhstan (%)
Place of birth for the foreign-born population - Nepal (%)
Place of birth for the foreign-born population - Pakistan (%)
Place of birth for the foreign-born population - Sri Lanka (%)
Place of birth for the foreign-born population - Uzbekistan (%)
Place of birth for the foreign-born population - Other South Central Asia (%)
Place of birth for the foreign-born population - Burma (%)
Place of birth for the foreign-born population - Cambodia (%)
Place of birth for the foreign-born population - Indonesia (%)
Place of birth for the foreign-born population - Laos (%)
Place of birth for the foreign-born population - Malaysia (%)
Place of birth for the foreign-born population - Philippines (%)
Place of birth for the foreign-born population - Singapore (%)
Place of birth for the foreign-born population - Thailand (%)
Place of birth for the foreign-born population - Vietnam (%)
Place of birth for the foreign-born population - Other South Eastern Asia (%)
Place of birth for the foreign-born population - Armenia (%)
Place of birth for the foreign-born population - Iraq (%)
Place of birth for the foreign-born population - Israel (%)
Place of birth for the foreign-born population - Jordan (%)
Place of birth for the foreign-born population - Kuwait (%)
Place of birth for the foreign-born population - Lebanon (%)
Place of birth for the foreign-born population - Saudi Arabia (%)
Place of birth for the foreign-born population - Syria (%)
Place of birth for the foreign-born population - Turkey (%)
Place of birth for the foreign-born population - Yemen (%)
Place of birth for the foreign-born population - Other Western Asia (%)
Place of birth for the foreign-born population - Eritrea (%)
Place of birth for the foreign-born population - Ethiopia (%)
Place of birth for the foreign-born population - Kenya (%)
Place of birth for the foreign-born population - Somalia (%)
Place of birth for the foreign-born population - Uganda (%)
Place of birth for the foreign-born population - Zimbabwe (%)
Place of birth for the foreign-born population - Other Eastern Africa (%)
Place of birth for the foreign-born population - Cameroon (%)
Place of birth for the foreign-born population - Congo (%)
Place of birth for the foreign-born population - Democratic Republic of Congo (Zaire) (%)
Place of birth for the foreign-born population - Other Middle Africa (%)
Place of birth for the foreign-born population - Egypt (%)
Place of birth for the foreign-born population - Morocco (%)
Place of birth for the foreign-born population - Sudan (%)
Place of birth for the foreign-born population - Other Northern Africa (%)
Place of birth for the foreign-born population - South Africa (%)
Place of birth for the foreign-born population - Other Southern Africa (%)
Place of birth for the foreign-born population - Cabo Verde (%)
Place of birth for the foreign-born population - Ghana (%)
Place of birth for the foreign-born population - Liberia (%)
Place of birth for the foreign-born population - Nigeria (%)
Place of birth for the foreign-born population - Senegal (%)
Place of birth for the foreign-born population - Sierra Leone (%)
Place of birth for the foreign-born population - Other Western Africa (%)
Place of birth for the foreign-born population - Australia (%)
Place of birth for the foreign-born population - New Zealand (%)
Place of birth for the foreign-born population - Fiji (%)
Place of birth for the foreign-born population - Micronesia (%)
Place of birth for the foreign-born population - Bahamas (%)
Place of birth for the foreign-born population - Barbados (%)
Place of birth for the foreign-born population - Cuba (%)
Place of birth for the foreign-born population - Dominica (%)
Place of birth for the foreign-born population - Dominican Republic (%)
Place of birth for the foreign-born population - Grenada (%)
Place of birth for the foreign-born population - Haiti (%)
Place of birth for the foreign-born population - Jamaica (%)
Place of birth for the foreign-born population - St. Vincent and the Grenadines (%)
Place of birth for the foreign-born population - Trinidad and Tobago (%)
Place of birth for the foreign-born population - West Indies (%)
Place of birth for the foreign-born population - Other Caribbean (%)
Place of birth for the foreign-born population - Belize (%)
Place of birth for the foreign-born population - Costa Rica (%)
Place of birth for the foreign-born population - El Salvador (%)
Place of birth for the foreign-born population - Guatemala (%)
Place of birth for the foreign-born population - Honduras (%)
Place of birth for the foreign-born population - Mexico (%)
Place of birth for the foreign-born population - Nicaragua (%)
Place of birth for the foreign-born population - Panama (%)
Place of birth for the foreign-born population - Other Central America (%)
Place of birth for the foreign-born population - Argentina (%)
Place of birth for the foreign-born population - Bolivia (%)
Place of birth for the foreign-born population - Brazil (%)
Place of birth for the foreign-born population - Chile (%)
Place of birth for the foreign-born population - Colombia (%)
Place of birth for the foreign-born population - Ecuador (%)
Place of birth for the foreign-born population - Guyana (%)
Place of birth for the foreign-born population - Peru (%)
Place of birth for the foreign-born population - Uruguay (%)
Place of birth for the foreign-born population - Venezuela (%)
Place of birth for the foreign-born population - Other South America (%)
Place of birth for the foreign-born population - Canada (%)
Place of birth for the foreign-born population - Other Northern America (%)
Place of birth for the foreign-born population - Other (%)
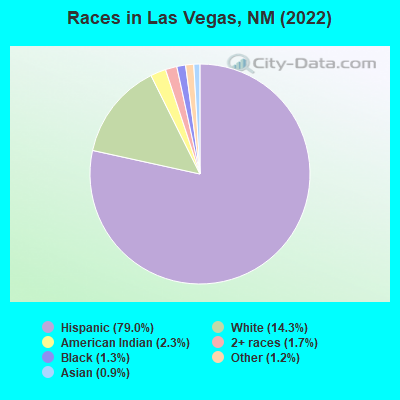
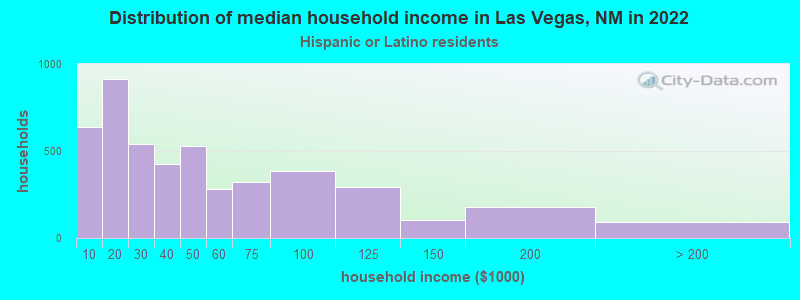
According to 2022 data, the most numerous races in Las Vegas, NM are Hispanic (10,421 residents), White alone (1,887 residents), and American Indian alone (301 residents). 55.2% of Las Vegas residents speak English at home. 3.0% of Las Vegas, NM residents are foreign-born (1.8% born in Latin America, 0.7% born in Asia, 0.4% born in Europe), which is 199.2% less than the foreign-born rate of 9.0% across the entire state of New Mexico.
Race distribution in Las Vegas
2000 2022
813,495 44.7% White alone 765,386 42.1% Hispanic 161,460 8.9% American Indian alone 30,654 1.7% Black alone 25,793 1.4% Two or more races 18,257 1.0% Asian alone 3,009 0.2% Other race alone 992 0.05% Native Hawaiian and Other
1,059,867 50.2% Hispanic 735,478 34.8% White alone 171,808 8.1% American Indian alone 65,084 3.1% Two or more races 36,870 1.7% Black alone 35,870 1.7% Asian alone 7,582 0.4% Other race alone 785 0.04% Native Hawaiian and Other
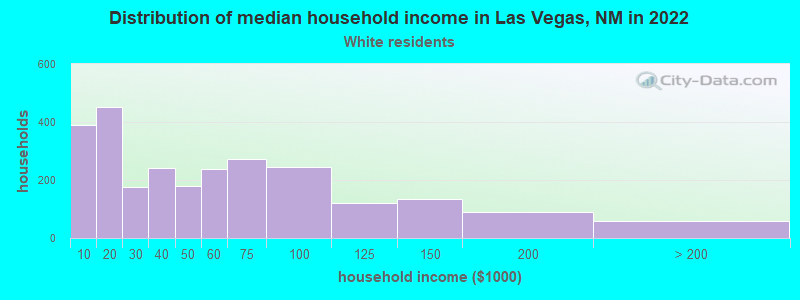
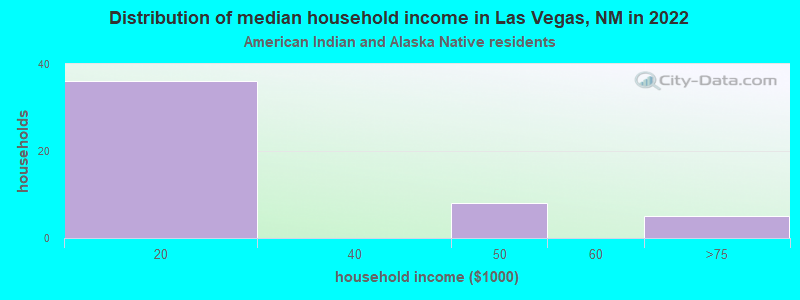
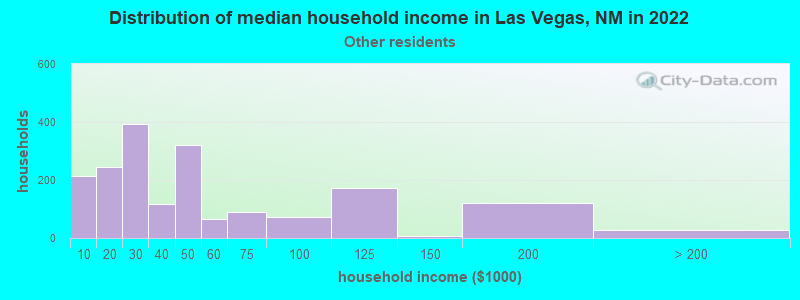
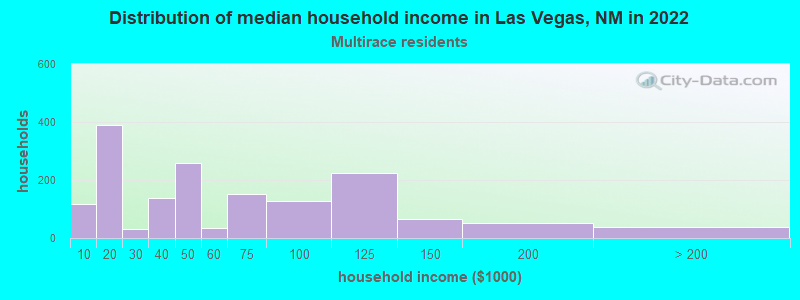
Income and house value in Las Vegas Median household income in 2022 $56,589 White non-Hispanic householders$35,283 Some other race householders$47,456 Two or more races householders$36,907 Hispanic or Latino race householdersMedian 2022 house value $174,104 White Non-Hispanic householders $137,886 Asian householders$161,235 Some other race householders$144,137 Two or more races householders$156,639 Hispanic or Latino householders
Median age by race in Las Vegas
40.5 Median age for White residents39.6 45.1 20.3 Median age for Black or African American residents19.5 20.7 26.2 Median age for American Indian / Alaska Native residents25.9 63.2 40.8 Median age for Asian residents18.2 40.5 -658,511,722.1 Median age for Native Hawaiian / Pacific Islander residents-685,897,435.2 -659,380,691.5 44.6 Median age for Other race residents40.4 48.2 43.0 Median age for Two or more races residents52.2 38.4 57.3 Median age for White alone residents59.9 55.7 40.4 Median age for Hispanic or Latino residents38.5 41.9
Owner/renter occupied households by race in Las Vegas
House owners and renters - White residents 1,531 58.5% Owner occupied1,084 41.5% Renter occupiedHouse owners and renters - Black or African American residents 16 100.0% Renter occupiedHouse owners and renters - American Indian / Alaska Native residents 25 43.8% Owner occupied32 56.2% Renter occupiedHouse owners and renters - Asian residents 38 100.0% Renter occupiedHouse owners and renters - Other race residents 1,236 64.6% Owner occupied677 35.4% Renter occupiedHouse owners and renters - Two or more races residents 1,175 69.8% Owner occupied508 30.2% Renter occupiedHouse owners and renters - White alone residents 545 59.9% Owner occupied364 40.1% Renter occupiedHouse owners and renters - Hispanic or Latino residents 2,999 63.1% Owner occupied1,755 36.9% Renter occupied
Language usage in Las Vegas
English speakers - Total 55.2% of residents of Las Vegas speak English at home.
40.2% of residents speak Spanish at home 4,263 84.5% Speak English very well783 15.5% Speak English less than very well3.2% of residents speak other language at home 319 78.2% Speak English very well89 21.8% Speak English less than very well
English speakers - Born in the United States 74.9% of residents of Las Vegas speak English at home.
21.9% of residents speak Spanish at home 554 89.1% Speak English very well68 10.9% Speak English less than very well2.5% of residents speak other language at home 56 78.9% Speak English very well15 21.1% Speak English less than very well
English speakers - Native, born elsewhere 0.0% of residents of Las Vegas speak English at home.
31.6% of residents speak Spanish at home 18 100.0% Speak English very well38.6% of residents speak other language at home 22 100.0% Speak English very well
English speakers - Foreign-born 14.5% of residents of Las Vegas speak English at home.
44.4% of residents speak Spanish at home 43 24.6% Speak English very well132 75.4% Speak English less than very well42.9% of residents speak other language at home 125 74.0% Speak English very well44 26.0% Speak English less than very well
White (Caucasian) - Speak only English Native:
71.7% (3,859)Foreign-born:
22.0% (10)
White (Caucasian) - Speak another language Native:
20.3% (1,094)Foreign-born:
100.0% (44)
Black or African American - Speak only English Native:
81.5% (146)Foreign-born:
8.0% (4)
Black or African American - Speak another language Native:
16.7% (30)Foreign-born:
73.0% (37)
American Indian / Alaska Native - Speak only English Native:
38.7% (149)Foreign-born:
54.1% (8)
American Indian / Alaska Native - Speak another language Native:
55.3% (212)Foreign-born:
20.7% (3)
Asian - Speak only English Native:
100.0% (52)Foreign-born:
43.8% (30)
Other race - Speak another language Native:
65.1% (2,229)Foreign-born:
98.8% (178)
Two or more races - Speak another language Native:
53.0% (1,929)Foreign-born:
98.0% (26)
White alone - Speak only English Native:
90.7% (1,636)Foreign-born:
19.7% (12)
White alone - Speak another language Native:
8.3% (151)Foreign-born:
77.0% (47)
Hispanic or Latino - Speak only English Native:
49.3% (4,759)Foreign-born:
6.1% (11)
Hispanic or Latino - Speak another language Native:
50.4% (4,868)Foreign-born:
92.7% (174)
Foreign-born residents in Las Vegas 397 residents are foreign born (1.8% Latin America , 0.7% Asia , 0.4% Europe ).
This city:
3.0%New Mexico:
9.2%
Marital status for residents in Las Vegas Marital status - White (Caucasian) population 15 years and over
Males 55.6% Never married24.2% Now married1.3% Separated3.5% Widowed15.4% DivorcedFemales 44.9% Never married24.1% Now married1.6% Separated6.1% Widowed23.3% DivorcedWomen who gave birth in the past 12 months Now married:
39.1% (14)Unmarried:
60.9% (21)
Women who did not give birth in the past 12 months Now married:
15.3% (196)Unmarried:
84.7% (1,089)
Marital status - Black or African American population 15 years and over
Males 89.5% Never married8.6% Now married0.0% Separated0.0% Widowed1.9% DivorcedFemales 99.1% Never married0.9% Now married0.0% Separated0.0% Widowed0.0% DivorcedWomen who did not give birth in the past 12 months Now married:
0.9% (1)Unmarried:
99.1% (108)
Marital status - American Indian / Alaska Native population 15 years and over
Males 91.1% Never married3.3% Now married0.0% Separated2.4% Widowed3.3% DivorcedFemales 39.1% Never married42.2% Now married0.0% Separated18.8% Widowed0.0% DivorcedWomen who did not give birth in the past 12 months Now married:
0.0% (0)Unmarried:
100.0% (25)
Marital status - Asian population 15 years and over
Males 100.0% Never married0.0% Now married0.0% Separated0.0% Widowed0.0% DivorcedFemales 0.0% Never married23.5% Now married0.0% Separated0.0% Widowed76.5% DivorcedWomen who did not give birth in the past 12 months Now married:
27.1% (19)Unmarried:
72.9% (51)
Marital status - Other race population 15 years and over
Males 57.1% Never married26.4% Now married0.0% Separated3.3% Widowed13.2% DivorcedFemales 46.2% Never married21.8% Now married0.0% Separated9.8% Widowed22.2% DivorcedWomen who gave birth in the past 12 months Now married:
5.1% (7)Unmarried:
94.9% (136)
Women who did not give birth in the past 12 months Now married:
10.5% (78)Unmarried:
89.5% (665)
Marital status - Two or more races population 15 years and over
Males 45.2% Never married32.3% Now married0.0% Separated6.2% Widowed16.2% DivorcedFemales 45.5% Never married37.7% Now married0.0% Separated4.6% Widowed12.3% DivorcedWomen who did not give birth in the past 12 months Now married:
23.7% (181)Unmarried:
76.3% (584)
Marital status - White alone, not Hispanic / Latino population 15 years and over
Males 52.1% Never married16.6% Now married2.2% Separated6.1% Widowed23.2% DivorcedFemales 39.6% Never married14.7% Now married1.4% Separated13.7% Widowed30.6% DivorcedWomen who gave birth in the past 12 months Now married:
100.0% (4)Unmarried:
0.0% (0)
Women who did not give birth in the past 12 months Now married:
2.8% (10)Unmarried:
97.2% (334)
Marital status - Hispanic or Latino population 15 years and over
Males 54.2% Never married28.2% Now married0.4% Separated3.9% Widowed13.2% DivorcedFemales 46.9% Never married27.9% Now married0.8% Separated5.3% Widowed19.0% DivorcedWomen who gave birth in the past 12 months Now married:
13.5% (19)Unmarried:
86.5% (123)
Women who did not give birth in the past 12 months Now married:
17.5% (414)Unmarried:
82.5% (1,950)
Ancestries in Las Vegas
461 5.6% American136 1.7% German112 1.4% English81 1.0% Irish52 0.6% Italian43 0.5% Jamaican41 0.5% Afghan36 0.4% Scottish32 0.4% Serbian31 0.4% European30 0.4% British25 0.3% French16 0.2% Northern European14 0.2% Polish8 0.10% Scotch-Irish8 0.10% African2 0.02% Sierra Leonean
Geographical mobility in Las Vegas Same house 1 year ago 4,273 77.6% White (Caucasian)172 72.6% Black or African American238 60.4% American Indian / Alaska Native80 66.5% Asian3,496 94.1% Other race3,043 76.1% Two or more races1,280 67.7% White alone, not Hispanic / Latino8,614 83.6% Hispanic or LatinoMoved within same county 719 13.1% White / Caucasian101 2.7% Other race79 2.0% Two or more races238 12.6% White alone, not Hispanic / Latino856 8.3% Hispanic or LatinoMoved within same state 150 2.7% White / Caucasian110 28.0% American Indian / Alaska Native66 1.8% Other race818 20.5% Two or more races120 6.4% White alone, not Hispanic / Latino559 5.4% Hispanic or LatinoMoved from different state 226 4.1% White / Caucasian22 9.4% Black or African American71 18.0% American Indian / Alaska Native11 0.3% Other race60 1.5% Two or more races159 8.4% White alone, not Hispanic / Latino141 1.4% Hispanic or LatinoMoved from abroad 25 0.4% White22 9.3% Black or African American37 31.3% Asian41 1.1% Other race35 1.8% White alone, not Hispanic / Latino48 0.5% Hispanic or Latino
Children Nativity (place of birth) in Las Vegas
Children under 6 years - Living with two parents Both parents native 330 100.0% NativeChildren under 6 years - Living with one parent Native parent 343 100.0% NativeChildren 6 to 17 years - Living with two parents Both parents native 387 100.0% NativeOne native, one foreign-born parent 11 100.0% NativeChildren 6 to 17 years - Living with one parent Native parent 951 100.0% NativeForeign-born parent 41 49.7% Native41 50.3% Foreign-born
Grandparents responsible for own grandchildren in Las Vegas
Grandparents (30 to 59 years) White / Caucasian 5 100.0% Responsible for grandchildrenOther race 141 100.0% Not responsible for grandchildrenHispanic or Latino 5 5.7% Responsible for grandchildren76 94.3% Not responsible for grandchildrenGrandparents (60 years and over) White / Caucasian 8 100.0% Not responsible for grandchildrenHispanic or Latino 50 66.6% Responsible for grandchildren25 33.4% Not responsible for grandchildren