Races in Lewisville, Texas (TX) Detailed Stats
Data:
Races - White alone (%)
Races - White alone (% change since 2000)
Races - Black alone (%)
Races - Black alone (% change since 2000)
Races - American Indian alone (%)
Races - American Indian alone (% change since 2000)
Races - Asian alone (%)
Races - Asian alone (% change since 2000)
Races - Hispanic (%)
Races - Hispanic (% change since 2000)
Races - Native Hawaiian and Other Pacific Islander alone (%)
Races - Native Hawaiian and Other Pacific Islander alone (% change since 2000)
Races - Two or more races(%)
Races - Two or more races(% change since 2000)
Races - Other race alone (%)
Races - Other race alone (% change since 2000)
Racial diversity
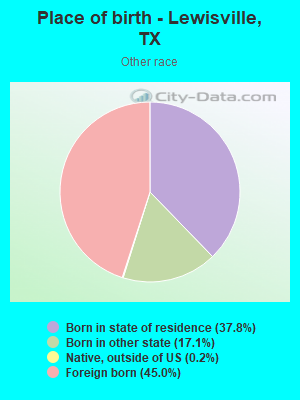
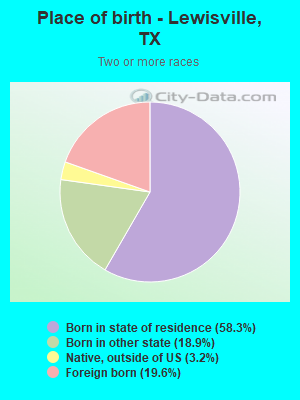
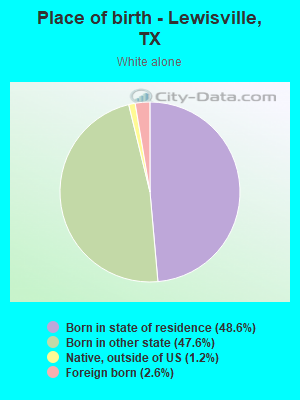
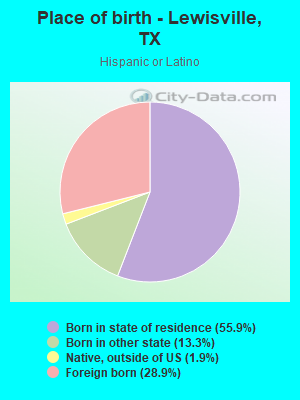
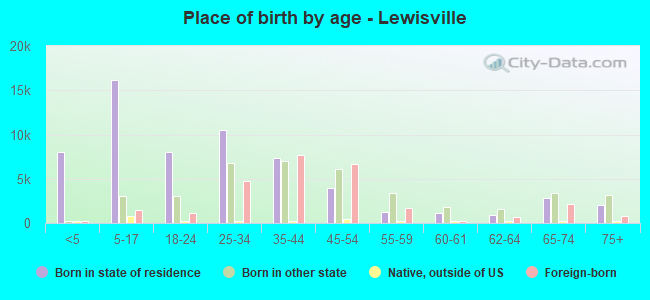
Place of birth - Born in state of residence (%)
Place of birth - Born in state of residence (%) - White
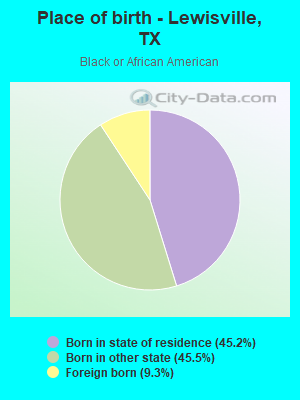
Place of birth - Born in state of residence (%) - Black or African American
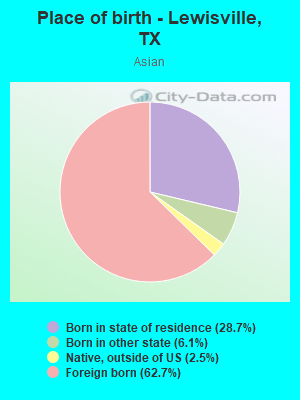
Place of birth - Born in state of residence (%) - Asian
Place of birth - Born in state of residence (%) - Hispanic or Latino
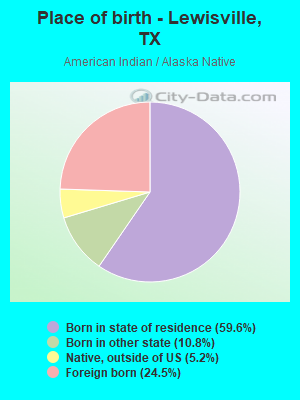
Place of birth - Born in state of residence (%) - American Indian and Alaska Native
Place of birth - Born in state of residence (%) - Multirace
Place of birth - Born in state of residence (%) - Other Race
Place of birth - Born in other state (%)
Place of birth - Born in other state (%) - White
Place of birth - Born in other state (%) - Black or African American
Place of birth - Born in other state (%) - Asian
Place of birth - Born in other state (%) - Hispanic or Latino
Place of birth - Born in other state (%) - American Indian and Alaska Native
Place of birth - Born in other state (%) - Multirace
Place of birth - Born in other state (%) - Other Race
Place of birth - Native, outside of US (%)
Place of birth - Native, outside of US (%) - White
Place of birth - Native, outside of US (%) - Black or African American
Place of birth - Native, outside of US (%) - Asian
Place of birth - Native, outside of US (%) - Hispanic or Latino
Place of birth - Native, outside of US (%) - American Indian and Alaska Native
Place of birth - Native, outside of US (%) - Multirace
Place of birth - Native, outside of US (%) - Other Race
Place of birth - Foreign born (%)
Place of birth - Foreign born (%) - White
Place of birth - Foreign born (%) - Black or African American
Place of birth - Foreign born (%) - Asian
Place of birth - Foreign born (%) - Hispanic or Latino
Place of birth - Foreign born (%) - American Indian and Alaska Native
Place of birth - Foreign born (%) - Multirace
Place of birth - Foreign born (%) - Other Race
Residents speaking English at home (%)
Residents speaking English at home - Born in the United States (%)
Residents speaking English at home - Native, born elsewhere (%)
Residents speaking English at home - Foreign born (%)
Residents speaking Spanish at home (%)
Residents speaking Spanish at home - Born in the United States (%)
Residents speaking Spanish at home - Native, born elsewhere (%)
Residents speaking Spanish at home - Foreign born (%)
Residents speaking other language at home (%)
Residents speaking other language at home - Born in the United States (%)
Residents speaking other language at home - Native, born elsewhere (%)
Residents speaking other language at home - Foreign born (%)
Marital status - Never married (%)
Marital status - Now married (%)
Marital status - Separated (%)
Marital status - Widowed (%)
Marital status - Divorced (%)
Ancestries Reported - Arab (%)
Ancestries Reported - Czech (%)
Ancestries Reported - Danish (%)
Ancestries Reported - Dutch (%)
Ancestries Reported - English (%)
Ancestries Reported - French (%)
Ancestries Reported - French Canadian (%)
Ancestries Reported - German (%)
Ancestries Reported - Greek (%)
Ancestries Reported - Hungarian (%)
Ancestries Reported - Irish (%)
Ancestries Reported - Italian (%)
Ancestries Reported - Lithuanian (%)
Ancestries Reported - Norwegian (%)
Ancestries Reported - Polish (%)
Ancestries Reported - Portuguese (%)
Ancestries Reported - Russian (%)
Ancestries Reported - Scotch-Irish (%)
Ancestries Reported - Scottish (%)
Ancestries Reported - Slovak (%)
Ancestries Reported - Subsaharan African (%)
Ancestries Reported - Swedish (%)
Ancestries Reported - Swiss (%)
Ancestries Reported - Ukrainian (%)
Ancestries Reported - United States (%)
Ancestries Reported - Welsh (%)
Ancestries Reported - West Indian (%)
Ancestries Reported - Other (%)
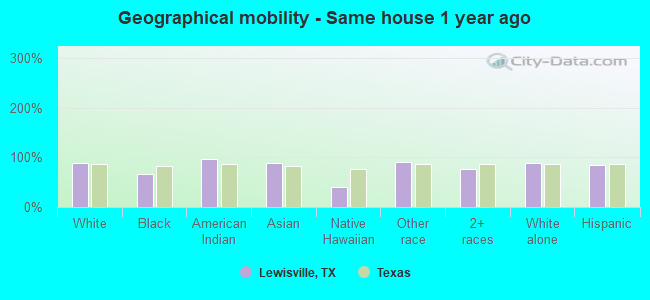
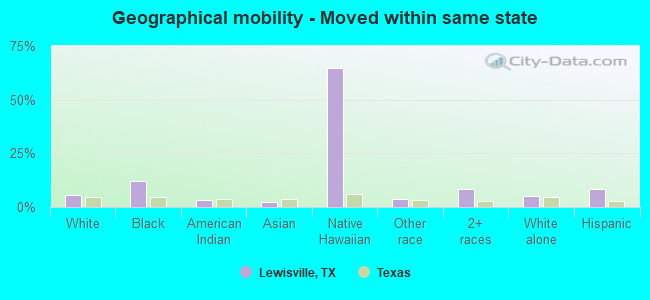
Geographical mobility - Same house 1 year ago (%)
Geographical mobility - Same house 1 year ago (%) - White
Geographical mobility - Same house 1 year ago (%) - Black or African American
Geographical mobility - Same house 1 year ago (%) - Asian
Geographical mobility - Same house 1 year ago (%) - Hispanic or Latino
Geographical mobility - Same house 1 year ago (%) - American Indian and Alaska Native
Geographical mobility - Same house 1 year ago (%) - Multirace
Geographical mobility - Same house 1 year ago (%) - Other Race
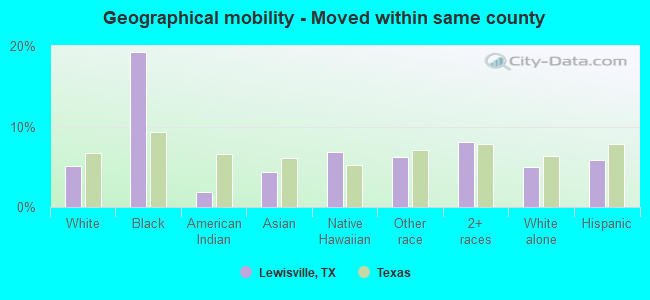
Geographical mobility - Moved within same county (%)
Geographical mobility - Moved within same county (%) - White
Geographical mobility - Moved within same county (%) - Black or African American
Geographical mobility - Moved within same county (%) - Asian
Geographical mobility - Moved within same county (%) - Hispanic or Latino
Geographical mobility - Moved within same county (%) - American Indian and Alaska Native
Geographical mobility - Moved within same county (%) - Multirace
Geographical mobility - Moved within same county (%) - Other Race
Geographical mobility - Moved from different county within same state (%)
Geographical mobility - Moved from different county within same state (%) - White
Geographical mobility - Moved from different county within same state (%) - Black or African American
Geographical mobility - Moved from different county within same state (%) - Asian
Geographical mobility - Moved from different county within same state (%) - Hispanic or Latino
Geographical mobility - Moved from different county within same state (%) - American Indian and Alaska Native
Geographical mobility - Moved from different county within same state (%) - Multirace
Geographical mobility - Moved from different county within same state (%) - Other Race
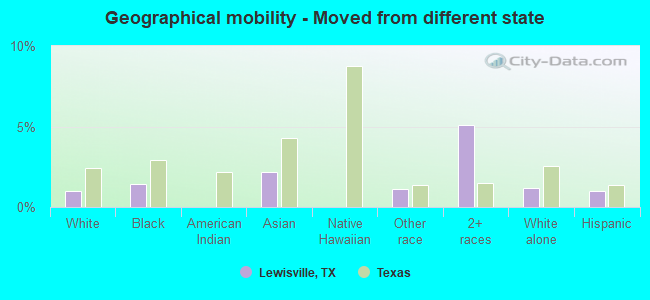
Geographical mobility - Moved from different state (%)
Geographical mobility - Moved from different state (%) - White
Geographical mobility - Moved from different state (%) - Black or African American
Geographical mobility - Moved from different state (%) - Asian
Geographical mobility - Moved from different state (%) - Hispanic or Latino
Geographical mobility - Moved from different state (%) - American Indian and Alaska Native
Geographical mobility - Moved from different state (%) - Multirace
Geographical mobility - Moved from different state (%) - Other Race
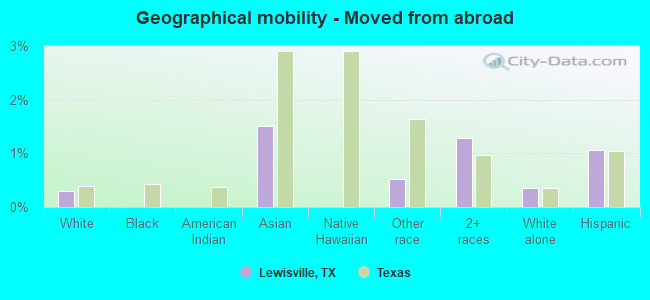
Geographical mobility - Moved from abroad (%)
Geographical mobility - Moved from abroad (%) - White
Geographical mobility - Moved from abroad (%) - Black or African American
Geographical mobility - Moved from abroad (%) - Asian
Geographical mobility - Moved from abroad (%) - Hispanic or Latino
Geographical mobility - Moved from abroad (%) - American Indian and Alaska Native
Geographical mobility - Moved from abroad (%) - Multirace
Geographical mobility - Moved from abroad (%) - Other Race
Place of birth for the foreign-born population - Ireland (%)
Place of birth for the foreign-born population - Denmark (%)
Place of birth for the foreign-born population - Norway (%)
Place of birth for the foreign-born population - Sweden (%)
Place of birth for the foreign-born population - United Kingdom (%)
Place of birth for the foreign-born population - England (%)
Place of birth for the foreign-born population - Scotland (%)
Place of birth for the foreign-born population - Other Northern Europe (%)
Place of birth for the foreign-born population - Austria (%)
Place of birth for the foreign-born population - Belgium (%)
Place of birth for the foreign-born population - France (%)
Place of birth for the foreign-born population - Germany (%)
Place of birth for the foreign-born population - Netherlands (%)
Place of birth for the foreign-born population - Switzerland (%)
Place of birth for the foreign-born population - Other Western Europe (%)
Place of birth for the foreign-born population - Greece (%)
Place of birth for the foreign-born population - Italy (%)
Place of birth for the foreign-born population - Portugal (%)
Place of birth for the foreign-born population - Spain (%)
Place of birth for the foreign-born population - Other Southern Europe (%)
Place of birth for the foreign-born population - Albania (%)
Place of birth for the foreign-born population - Belarus (%)
Place of birth for the foreign-born population - Bosnia and Herzegovina (%)
Place of birth for the foreign-born population - Bulgaria (%)
Place of birth for the foreign-born population - Croatia (%)
Place of birth for the foreign-born population - Czechoslovakia (%)
Place of birth for the foreign-born population - Hungary (%)
Place of birth for the foreign-born population - Latvia (%)
Place of birth for the foreign-born population - Lithuania (%)
Place of birth for the foreign-born population - North Macedonia (Macedonia) (%)
Place of birth for the foreign-born population - Moldova (%)
Place of birth for the foreign-born population - Poland (%)
Place of birth for the foreign-born population - Romania (%)
Place of birth for the foreign-born population - Russia (%)
Place of birth for the foreign-born population - Serbia (%)
Place of birth for the foreign-born population - Ukraine (%)
Place of birth for the foreign-born population - Other Eastern Europe (%)
Place of birth for the foreign-born population - China (%)
Place of birth for the foreign-born population - Hong Kong (%)
Place of birth for the foreign-born population - Taiwan (%)
Place of birth for the foreign-born population - Japan (%)
Place of birth for the foreign-born population - Korea (%)
Place of birth for the foreign-born population - Other Eastern Asia (%)
Place of birth for the foreign-born population - Afghanistan (%)
Place of birth for the foreign-born population - Bangladesh (%)
Place of birth for the foreign-born population - India (%)
Place of birth for the foreign-born population - Iran (%)
Place of birth for the foreign-born population - Kazakhstan (%)
Place of birth for the foreign-born population - Nepal (%)
Place of birth for the foreign-born population - Pakistan (%)
Place of birth for the foreign-born population - Sri Lanka (%)
Place of birth for the foreign-born population - Uzbekistan (%)
Place of birth for the foreign-born population - Other South Central Asia (%)
Place of birth for the foreign-born population - Burma (%)
Place of birth for the foreign-born population - Cambodia (%)
Place of birth for the foreign-born population - Indonesia (%)
Place of birth for the foreign-born population - Laos (%)
Place of birth for the foreign-born population - Malaysia (%)
Place of birth for the foreign-born population - Philippines (%)
Place of birth for the foreign-born population - Singapore (%)
Place of birth for the foreign-born population - Thailand (%)
Place of birth for the foreign-born population - Vietnam (%)
Place of birth for the foreign-born population - Other South Eastern Asia (%)
Place of birth for the foreign-born population - Armenia (%)
Place of birth for the foreign-born population - Iraq (%)
Place of birth for the foreign-born population - Israel (%)
Place of birth for the foreign-born population - Jordan (%)
Place of birth for the foreign-born population - Kuwait (%)
Place of birth for the foreign-born population - Lebanon (%)
Place of birth for the foreign-born population - Saudi Arabia (%)
Place of birth for the foreign-born population - Syria (%)
Place of birth for the foreign-born population - Turkey (%)
Place of birth for the foreign-born population - Yemen (%)
Place of birth for the foreign-born population - Other Western Asia (%)
Place of birth for the foreign-born population - Eritrea (%)
Place of birth for the foreign-born population - Ethiopia (%)
Place of birth for the foreign-born population - Kenya (%)
Place of birth for the foreign-born population - Somalia (%)
Place of birth for the foreign-born population - Uganda (%)
Place of birth for the foreign-born population - Zimbabwe (%)
Place of birth for the foreign-born population - Other Eastern Africa (%)
Place of birth for the foreign-born population - Cameroon (%)
Place of birth for the foreign-born population - Congo (%)
Place of birth for the foreign-born population - Democratic Republic of Congo (Zaire) (%)
Place of birth for the foreign-born population - Other Middle Africa (%)
Place of birth for the foreign-born population - Egypt (%)
Place of birth for the foreign-born population - Morocco (%)
Place of birth for the foreign-born population - Sudan (%)
Place of birth for the foreign-born population - Other Northern Africa (%)
Place of birth for the foreign-born population - South Africa (%)
Place of birth for the foreign-born population - Other Southern Africa (%)
Place of birth for the foreign-born population - Cabo Verde (%)
Place of birth for the foreign-born population - Ghana (%)
Place of birth for the foreign-born population - Liberia (%)
Place of birth for the foreign-born population - Nigeria (%)
Place of birth for the foreign-born population - Senegal (%)
Place of birth for the foreign-born population - Sierra Leone (%)
Place of birth for the foreign-born population - Other Western Africa (%)
Place of birth for the foreign-born population - Australia (%)
Place of birth for the foreign-born population - New Zealand (%)
Place of birth for the foreign-born population - Fiji (%)
Place of birth for the foreign-born population - Micronesia (%)
Place of birth for the foreign-born population - Bahamas (%)
Place of birth for the foreign-born population - Barbados (%)
Place of birth for the foreign-born population - Cuba (%)
Place of birth for the foreign-born population - Dominica (%)
Place of birth for the foreign-born population - Dominican Republic (%)
Place of birth for the foreign-born population - Grenada (%)
Place of birth for the foreign-born population - Haiti (%)
Place of birth for the foreign-born population - Jamaica (%)
Place of birth for the foreign-born population - St. Vincent and the Grenadines (%)
Place of birth for the foreign-born population - Trinidad and Tobago (%)
Place of birth for the foreign-born population - West Indies (%)
Place of birth for the foreign-born population - Other Caribbean (%)
Place of birth for the foreign-born population - Belize (%)
Place of birth for the foreign-born population - Costa Rica (%)
Place of birth for the foreign-born population - El Salvador (%)
Place of birth for the foreign-born population - Guatemala (%)
Place of birth for the foreign-born population - Honduras (%)
Place of birth for the foreign-born population - Mexico (%)
Place of birth for the foreign-born population - Nicaragua (%)
Place of birth for the foreign-born population - Panama (%)
Place of birth for the foreign-born population - Other Central America (%)
Place of birth for the foreign-born population - Argentina (%)
Place of birth for the foreign-born population - Bolivia (%)
Place of birth for the foreign-born population - Brazil (%)
Place of birth for the foreign-born population - Chile (%)
Place of birth for the foreign-born population - Colombia (%)
Place of birth for the foreign-born population - Ecuador (%)
Place of birth for the foreign-born population - Guyana (%)
Place of birth for the foreign-born population - Peru (%)
Place of birth for the foreign-born population - Uruguay (%)
Place of birth for the foreign-born population - Venezuela (%)
Place of birth for the foreign-born population - Other South America (%)
Place of birth for the foreign-born population - Canada (%)
Place of birth for the foreign-born population - Other Northern America (%)
Place of birth for the foreign-born population - Other (%)
Latest news about races in Lewisville, TX collected exclusively by city-data.com from local newspapers, TV, and radio stations
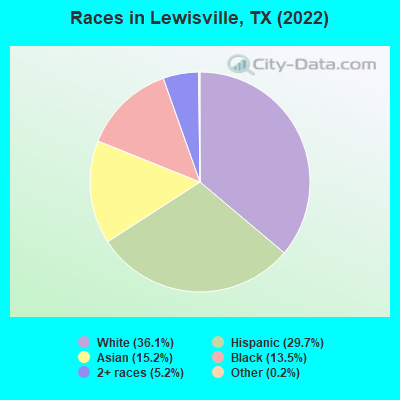
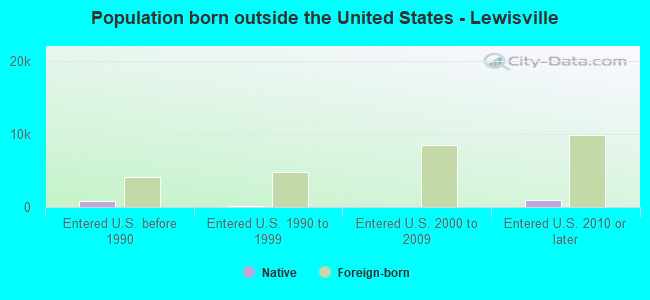
According to 2022 data, the most numerous races in Lewisville, TX are Hispanic (38,823 residents), White alone (47,319 residents), and Black alone (17,617 residents). 64.0% of Lewisville residents speak English at home. 20.4% of Lewisville, TX residents are foreign-born (10.1% born in Asia, 9.0% born in Latin America), which is 16.6% greater than the foreign-born rate of 17.0% across the entire state of Texas.
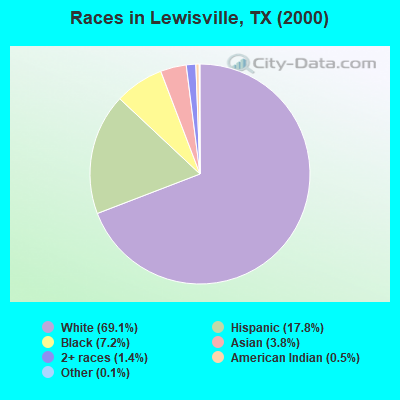
Race distribution in Lewisville
2000 2022
53,706 69.1% White alone 13,799 17.8% Hispanic 5,628 7.2% Black alone 2,990 3.8% Asian alone 1,104 1.4% Two or more races 399 0.5% American Indian alone 89 0.1% Other race alone 22 0.03% Native Hawaiian and Other
47,319 36.1% White alone 38,823 29.7% Hispanic 19,891 15.2% Asian alone 17,617 13.5% Black alone 6,800 5.2% Two or more races 313 0.2% Other race alone 113 0.09% American Indian alone 57 0.04% Native Hawaiian and Other
2000 2022
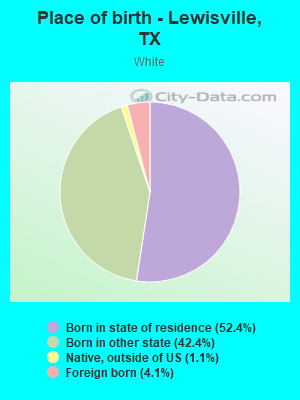
10,933,313 52.4% White alone 6,669,666 32.0% Hispanic 2,364,255 11.3% Black alone 554,445 2.7% Asian alone 230,567 1.1% Two or more races 68,859 0.3% American Indian alone 19,958 0.10% Other race alone 10,757 0.05% Native Hawaiian and Other
12,070,642 40.2% Hispanic 11,683,430 38.9% White alone 3,508,706 11.7% Black alone 1,608,173 5.4% Asian alone 956,560 3.2% Two or more races 125,763 0.4% Other race alone 47,023 0.2% American Indian alone 29,275 0.10% Native Hawaiian and Other
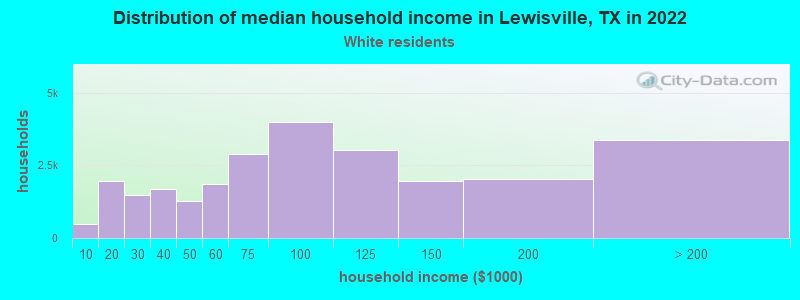
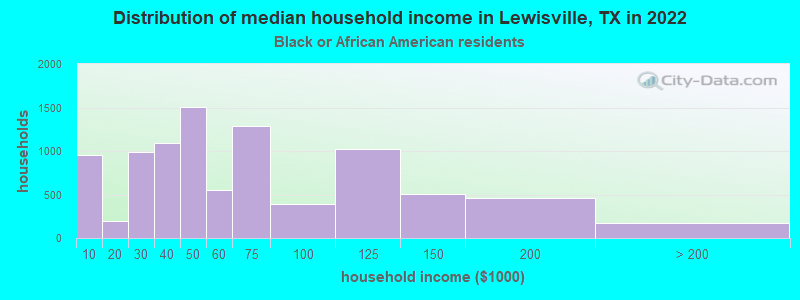
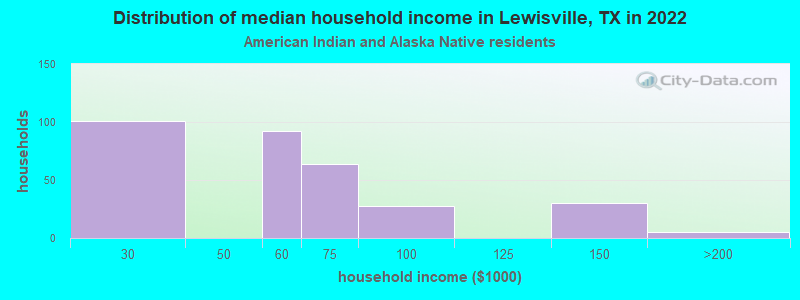
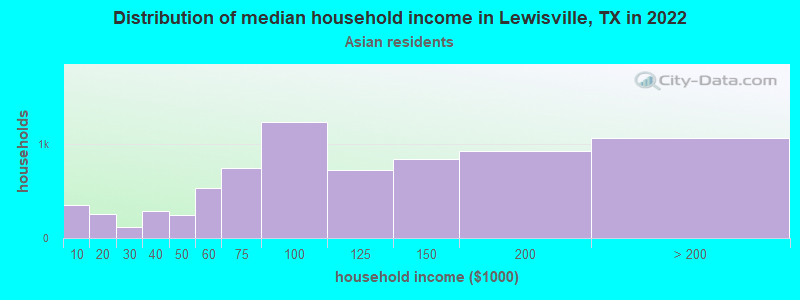
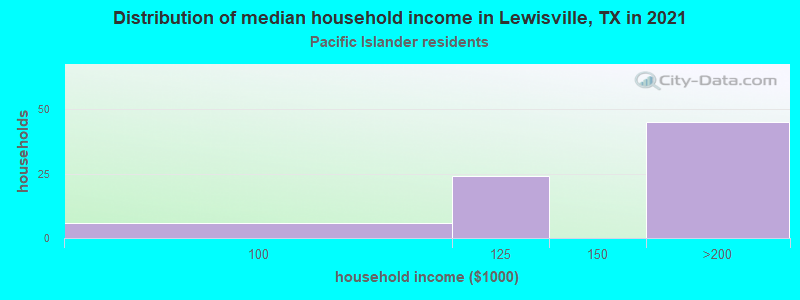
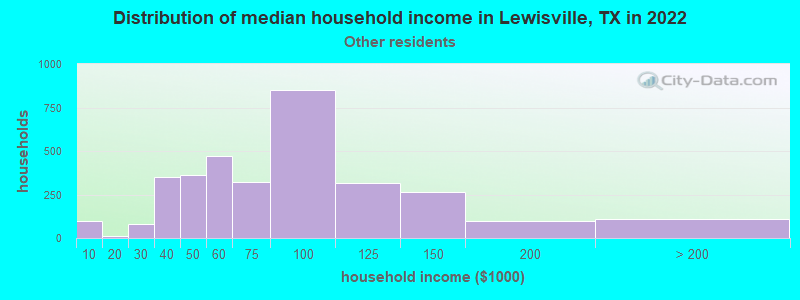
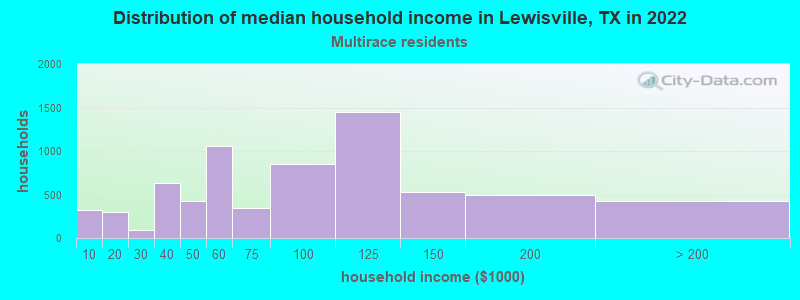
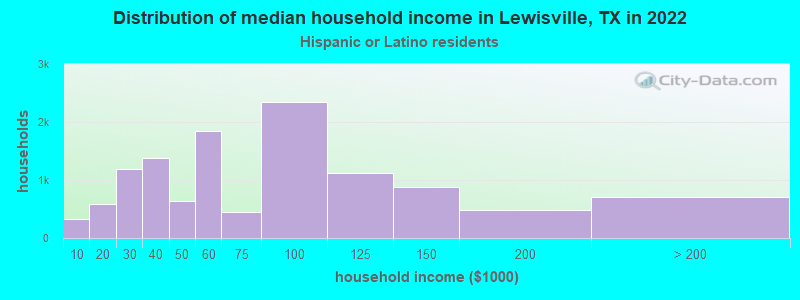
Income and house value in Lewisville Median household income in 2022 $85,827 White non-Hispanic householders$46,004 Black householders$46,548 American Indian and Alaska Native householders$95,596 Asian householders$87,576 Some other race householders$67,466 Two or more races householders$60,283 Hispanic or Latino race householdersMedian 2022 house value $373,124 White Non-Hispanic householders$414,476 Black or African American householders$284,331 American Indian or Alaska Native householders $401,654 Asian householders$440,761 Native Hawaiian and other Pacific Islander householders$324,080 Some other race householders$351,968 Two or more races householders$336,902 Hispanic or Latino householders
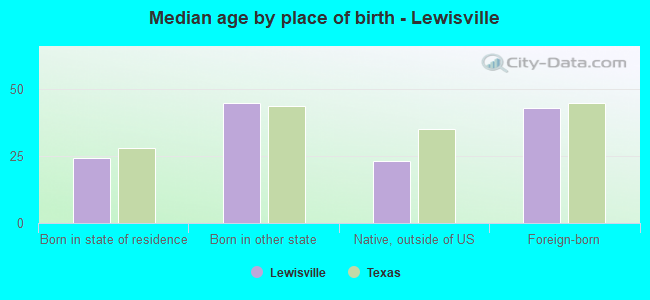
Median age by race in Lewisville
40.1 Median age for White residents39.2 40.7 34.9 Median age for Black or African American residents33.8 39.1 26.5 Median age for American Indian / Alaska Native residents43.3 19.2 37.6 Median age for Asian residents38.6 37.3 -666,666,666.0 Median age for Native Hawaiian / Pacific Islander residents-666,666,666.0 -666,666,666.0 33.8 Median age for Other race residents32.3 38.1 24.7 Median age for Two or more races residents24.9 24.4 42.5 Median age for White alone residents41.6 42.9 28.3 Median age for Hispanic or Latino residents29.5 27.5
Owner/renter occupied households by race in Lewisville
House owners and renters - White residents 13,108 50.3% Owner occupied12,934 49.7% Renter occupiedHouse owners and renters - Black or African American residents 1,745 19.1% Owner occupied7,380 80.9% Renter occupiedHouse owners and renters - American Indian / Alaska Native residents 275 84.7% Owner occupied50 15.3% Renter occupiedHouse owners and renters - Asian residents 4,254 58.6% Owner occupied3,005 41.4% Renter occupiedHouse owners and renters - Native Hawaiian / Pacific Islander residents 76 100.0% Owner occupiedHouse owners and renters - Other race residents 1,092 31.0% Owner occupied2,429 69.0% Renter occupiedHouse owners and renters - Two or more races residents 3,348 44.7% Owner occupied4,146 55.3% Renter occupiedHouse owners and renters - White alone residents 12,073 53.0% Owner occupied10,687 47.0% Renter occupiedHouse owners and renters - Hispanic or Latino residents 4,293 36.0% Owner occupied7,640 64.0% Renter occupied
Language usage in Lewisville
English speakers - Total 64.0% of residents of Lewisville speak English at home.
21.6% of residents speak Spanish at home 15,713 59.5% Speak English very well10,701 40.5% Speak English less than very well14.4% of residents speak other language at home 11,172 63.1% Speak English very well6,530 36.9% Speak English less than very well
English speakers - Born in the United States 90.2% of residents of Lewisville speak English at home.
7.0% of residents speak Spanish at home 2,223 80.9% Speak English very well524 19.1% Speak English less than very well2.9% of residents speak other language at home 910 81.0% Speak English very well213 19.0% Speak English less than very well
English speakers - Native, born elsewhere 39.5% of residents of Lewisville speak English at home.
33.4% of residents speak Spanish at home 413 67.5% Speak English very well199 32.5% Speak English less than very well27.2% of residents speak other language at home 498 100.0% Speak English very well
English speakers - Foreign-born 10.4% of residents of Lewisville speak English at home.
40.6% of residents speak Spanish at home 3,094 28.2% Speak English very well7,887 71.8% Speak English less than very well49.1% of residents speak other language at home 7,530 56.7% Speak English very well5,755 43.3% Speak English less than very well
White (Caucasian) - Speak only English Native:
92.5% (45,951)Foreign-born:
41.8% (935)
White (Caucasian) - Speak another language Native:
7.5% (3,714)Foreign-born:
58.2% (1,303)
Black or African American - Speak only English Native:
99.7% (15,095)Foreign-born:
42.8% (712)
Black or African American - Speak another language Native:
0.3% (45)Foreign-born:
57.2% (951)
American Indian / Alaska Native - Speak another language Native:
60.0% (513)Foreign-born:
98.9% (201)
Asian - Speak only English Native:
45.3% (2,703)Foreign-born:
6.7% (840)
Asian - Speak another language Native:
54.7% (3,263)Foreign-born:
93.3% (11,626)
Native Hawaiian / Pacific Islander - Speak only English Native:
98.9% (63)Foreign-born:
51.5% (13)
Other race - Speak only English Native:
27.7% (1,836)Foreign-born:
2.1% (120)
Other race - Speak another language Native:
72.3% (4,781)Foreign-born:
97.9% (5,560)
Two or more races - Speak only English Native:
54.8% (9,497)Foreign-born:
3.5% (164)
Two or more races - Speak another language Native:
45.2% (7,839)Foreign-born:
96.5% (4,542)
White alone - Speak only English Native:
97.1% (42,508)Foreign-born:
75.2% (935)
White alone - Speak another language Native:
2.9% (1,252)Foreign-born:
24.8% (309)
Hispanic or Latino - Speak only English Native:
40.6% (10,146)Foreign-born:
2.5% (284)
Hispanic or Latino - Speak another language Native:
59.4% (14,843)Foreign-born:
97.5% (10,875)
Foreign-born residents in Lewisville 27,214 residents are foreign born (10.1% Asia , 9.0% Latin America ).
This city:
20.4%Texas:
17.1%
Marital status for residents in Lewisville Marital status - White (Caucasian) population 15 years and over
Males 32.6% Never married51.8% Now married1.9% Separated1.6% Widowed12.1% DivorcedFemales 30.0% Never married41.7% Now married2.7% Separated10.0% Widowed15.6% DivorcedWomen who gave birth in the past 12 months Now married:
58.2% (935)Unmarried:
41.8% (671)
Women who did not give birth in the past 12 months Now married:
39.2% (4,526)Unmarried:
60.8% (7,015)
Marital status - Black or African American population 15 years and over
Males 53.4% Never married30.8% Now married0.0% Separated1.0% Widowed14.8% DivorcedFemales 51.1% Never married17.2% Now married3.5% Separated3.2% Widowed25.0% DivorcedWomen who gave birth in the past 12 months Now married:
72.1% (256)Unmarried:
27.9% (99)
Women who did not give birth in the past 12 months Now married:
25.1% (1,429)Unmarried:
74.9% (4,253)
Marital status - American Indian / Alaska Native population 15 years and over
Males 11.4% Never married59.7% Now married12.9% Separated0.0% Widowed15.9% DivorcedFemales 47.1% Never married31.9% Now married12.3% Separated0.0% Widowed8.7% DivorcedWomen who did not give birth in the past 12 months Now married:
43.8% (196)Unmarried:
56.2% (252)
Marital status - Asian population 15 years and over
Males 19.5% Never married72.4% Now married0.0% Separated3.9% Widowed4.2% DivorcedFemales 24.7% Never married59.6% Now married3.2% Separated3.4% Widowed9.0% DivorcedWomen who gave birth in the past 12 months Now married:
57.7% (71)Unmarried:
42.3% (52)
Women who did not give birth in the past 12 months Now married:
60.7% (3,309)Unmarried:
39.3% (2,140)
Marital status - Native Hawaiian / Pacific Islander population 15 years and over
Males 0.0% Never married100.0% Now married0.0% Separated0.0% Widowed0.0% DivorcedFemales 57.1% Never married42.9% Now married0.0% Separated0.0% Widowed0.0% DivorcedWomen who did not give birth in the past 12 months Now married:
0.0% (0)Unmarried:
100.0% (10)
Marital status - Other race population 15 years and over
Males 41.0% Never married46.0% Now married3.5% Separated1.5% Widowed8.0% DivorcedFemales 36.1% Never married52.2% Now married3.5% Separated1.9% Widowed6.3% DivorcedWomen who gave birth in the past 12 months Now married:
34.7% (183)Unmarried:
65.3% (344)
Women who did not give birth in the past 12 months Now married:
56.0% (1,621)Unmarried:
44.0% (1,272)
Marital status - Two or more races population 15 years and over
Males 52.9% Never married42.6% Now married1.7% Separated0.0% Widowed2.8% DivorcedFemales 49.1% Never married38.8% Now married3.0% Separated2.4% Widowed6.6% DivorcedWomen who gave birth in the past 12 months Now married:
62.3% (75)Unmarried:
37.7% (45)
Women who did not give birth in the past 12 months Now married:
48.0% (2,743)Unmarried:
52.0% (2,973)
Marital status - White alone, not Hispanic / Latino population 15 years and over
Males 33.4% Never married51.8% Now married2.1% Separated1.8% Widowed10.9% DivorcedFemales 27.8% Never married41.0% Now married3.1% Separated11.0% Widowed17.1% DivorcedWomen who gave birth in the past 12 months Now married:
64.5% (881)Unmarried:
35.5% (484)
Women who did not give birth in the past 12 months Now married:
38.9% (3,686)Unmarried:
61.1% (5,790)
Marital status - Hispanic or Latino population 15 years and over
Males 46.5% Never married42.6% Now married4.4% Separated1.5% Widowed5.0% DivorcedFemales 44.3% Never married44.2% Now married4.7% Separated2.6% Widowed4.2% DivorcedWomen who gave birth in the past 12 months Now married:
33.8% (304)Unmarried:
66.2% (596)
Women who did not give birth in the past 12 months Now married:
43.1% (4,773)Unmarried:
56.9% (6,312)
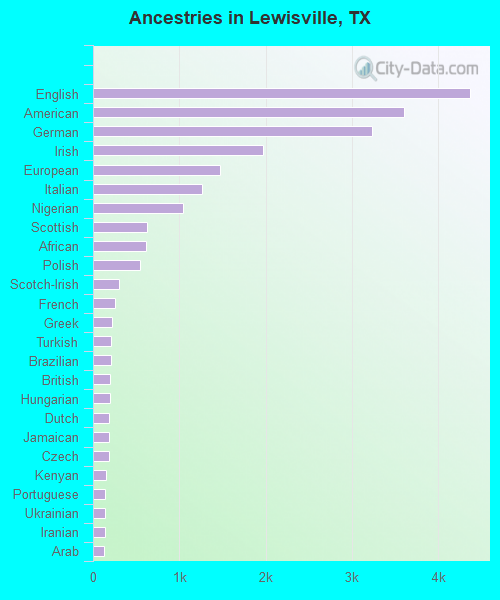
Ancestries in Lewisville
4,371 6.6% English3,608 5.4% American3,230 4.8% German1,971 3.0% Irish1,468 2.2% European1,266 1.9% Italian1,038 1.6% Nigerian622 0.9% Scottish614 0.9% African547 0.8% Polish307 0.5% Scotch-Irish260 0.4% French222 0.3% Greek204 0.3% Turkish203 0.3% Brazilian198 0.3% British192 0.3% Hungarian190 0.3% Dutch190 0.3% Jamaican185 0.3% Czech155 0.2% Kenyan140 0.2% Portuguese140 0.2% Ukrainian139 0.2% Iranian131 0.2% Arab125 0.2% Swedish111 0.2% Norwegian109 0.2% Northern European107 0.2% South African80 0.1% French Canadian77 0.1% Sudanese75 0.1% Canadian70 0.1% Welsh68 0.1% Danish68 0.1% Eastern European67 0.1% Scandinavian63 0.09% Lebanese56 0.08% Czechoslovakian52 0.08% Ghanaian47 0.07% West Indian27 0.04% Zimbabwean21 0.03% Armenian21 0.03% Russian21 0.03% Haitian15 0.02% Croatian14 0.02% Cajun14 0.02% Yugoslavian13 0.02% Romanian10 0.02% Pennsylvania German10 0.02% Trinidadian and Tobagonian9 0.01% Ethiopian8 0.01% Slovak8 0.01% Iraqi7 0.01% Belgian7 0.01% Barbadian7 0.01% Swiss7 0.01% Finnish4 0.01% Dutch West Indian
Geographical mobility in Lewisville Same house 1 year ago 47,704 88.2% White (Caucasian)12,060 67.1% Black or African American1,163 96.3% American Indian / Alaska Native17,733 89.5% Asian44 40.9% Native Hawaiian / Pacific Islander10,363 89.8% Other race18,368 77.3% Two or more races41,164 88.6% White alone, not Hispanic / Latino32,083 83.9% Hispanic or LatinoMoved within same county 2,724 5.0% White / Caucasian3,463 19.3% Black or African American23 1.9% American Indian / Alaska Native860 4.3% Asian7 6.9% Native Hawaiian / Pacific Islander715 6.2% Other race1,932 8.1% Two or more races2,289 4.9% White alone, not Hispanic / Latino2,252 5.9% Hispanic or LatinoMoved within same state 2,956 5.5% White / Caucasian2,186 12.2% Black or African American41 3.4% American Indian / Alaska Native491 2.5% Asian69 64.5% Native Hawaiian / Pacific Islander409 3.5% Other race1,942 8.2% Two or more races2,316 5.0% White alone, not Hispanic / Latino3,125 8.2% Hispanic or LatinoMoved from different state 537 1.0% White / Caucasian259 1.4% Black or African American436 2.2% Asian127 1.1% Other race1,204 5.1% Two or more races537 1.2% White alone, not Hispanic / Latino383 1.0% Hispanic or LatinoMoved from abroad 164 0.3% White299 1.5% Asian60 0.5% Other race306 1.3% Two or more races164 0.4% White alone, not Hispanic / Latino406 1.1% Hispanic or Latino
Children Nativity (place of birth) in Lewisville
Children under 6 years - Living with two parents Both parents native 2,285 100.0% NativeBoth parents foreign-born 1,212 100.0% NativeOne native, one foreign-born parent 907 100.0% NativeChildren under 6 years - Living with one parent Native parent 3,506 100.0% NativeForeign-born parent 1,608 100.0% NativeChildren 6 to 17 years - Living with two parents Both parents native 4,015 98.9% Native43 1.1% Foreign-bornBoth parents foreign-born 3,485 80.0% Native872 20.0% Foreign-bornOne native, one foreign-born parent 2,783 96.8% Native92 3.2% Foreign-bornChildren 6 to 17 years - Living with one parent Native parent 5,300 100.0% NativeForeign-born parent 2,521 54.5% Native2,106 45.5% Foreign-born
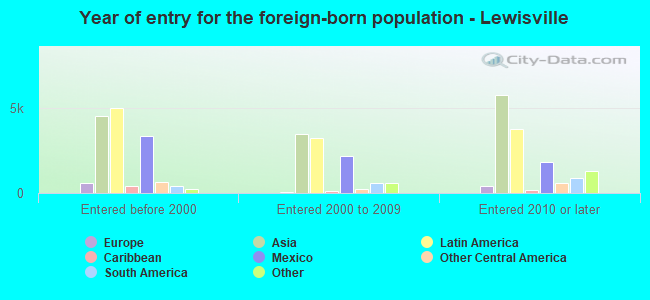
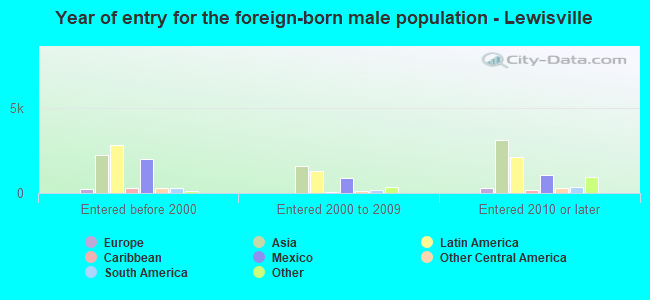
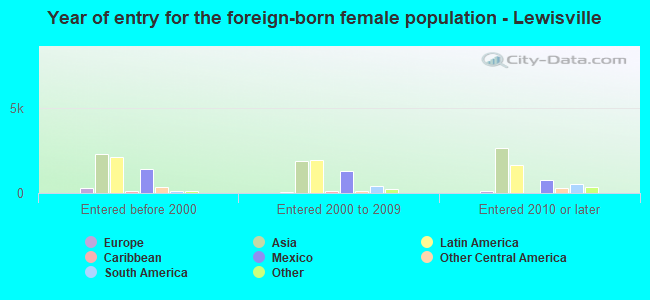
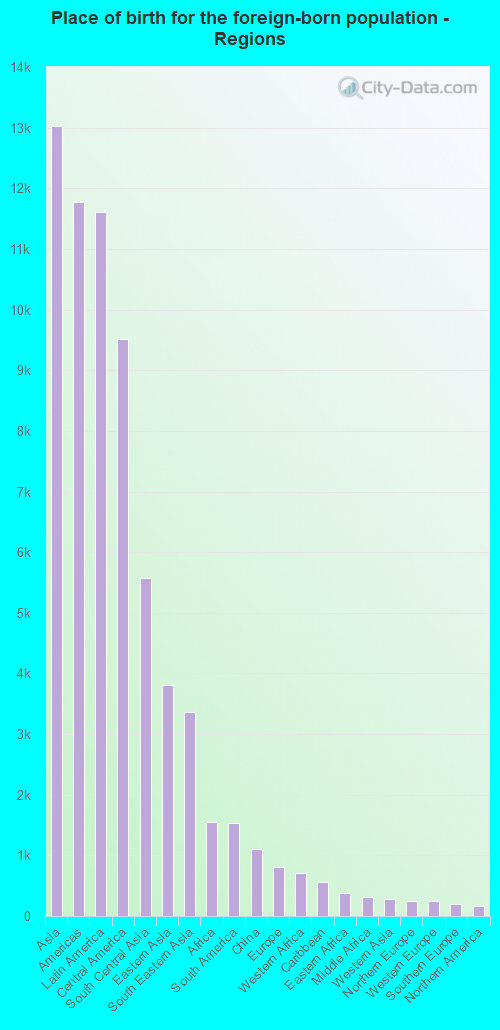
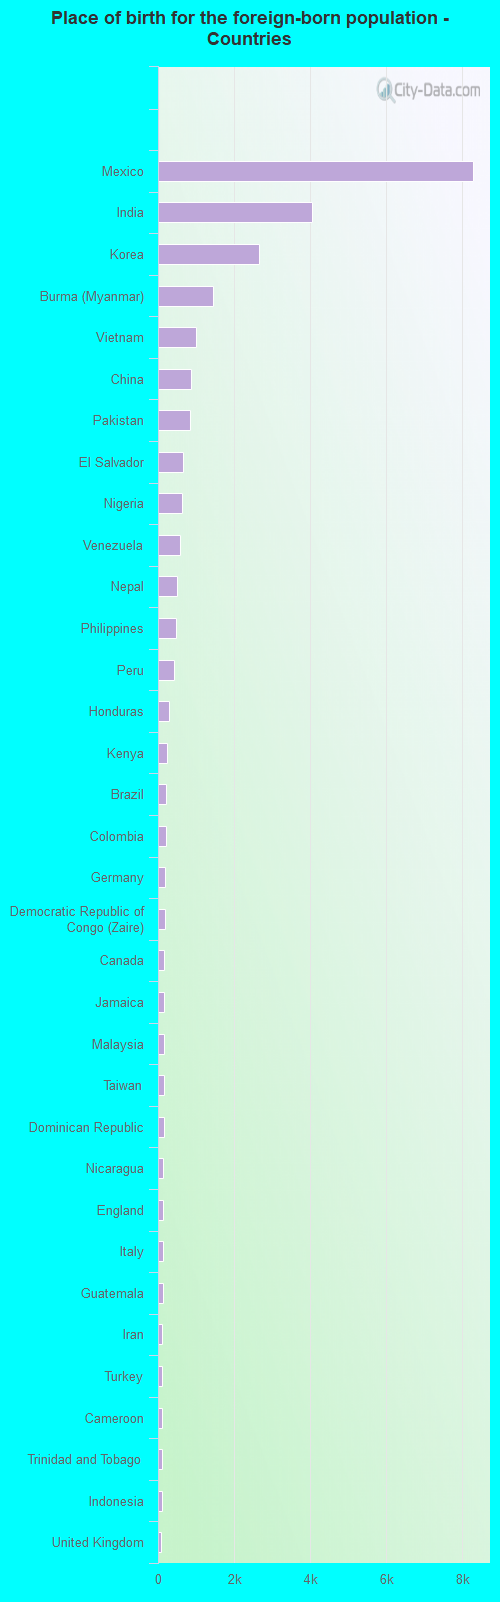
Place of birth for residents in Lewisville 13,023 Asia11,775 Americas11,605 Latin America9,512 Central America5,573 South Central Asia3,807 Eastern Asia3,362 South Eastern Asia1,555 Africa1,538 South America1,097 China816 Europe704 Western Africa554 Caribbean374 Eastern Africa306 Middle Africa279 Western Asia251 Northern Europe246 Western Europe192 Southern Europe169 Northern America117 Eastern Europe91 Northern Africa69 Southern Africa42 Oceania19 Australia and New Zealand Subregion8,284 Mexico4,036 India2,647 Korea1,450 Burma (Myanmar)1,005 Vietnam874 China853 Pakistan648 El Salvador628 Nigeria568 Venezuela487 Nepal482 Philippines422 Peru279 Honduras247 Kenya218 Brazil217 Colombia178 Germany175 Democratic Republic of Congo (Zaire)169 Canada165 Jamaica164 Malaysia160 Taiwan152 Dominican Republic132 Nicaragua130 England128 Italy122 Guatemala113 Iran111 Turkey104 Cameroon95 Trinidad and Tobago94 Indonesia79 United Kingdom69 Singapore69 South Africa68 France67 Sudan66 Thailand62 Japan62 Hong Kong58 Zimbabwe51 United Arab Emirates47 Guyana44 Ukraine43 Sri Lanka40 Panama38 Cuba38 Bangladesh37 Kuwait37 Greece36 Lebanon30 West Indies29 Cambodia26 Congo23 Iraq22 Spain20 Scotland20 Denmark19 New Zealand19 Moldova18 Bosnia and Herzegovina17 Tanzania16 Marshall Islands16 Ghana16 Haiti14 Argentina14 Hungary12 Grenada9 Ecuador8 Poland7 Barbados7 Russia5 Egypt4 Portugal4 Costa Rica
Grandparents responsible for own grandchildren in Lewisville
Grandparents (30 to 59 years) White / Caucasian 55 19.6% Responsible for grandchildren225 80.4% Not responsible for grandchildrenBlack or African American 24 34.4% Responsible for grandchildren46 65.6% Not responsible for grandchildrenAmerican Indian / Alaska Native 42 100.0% Not responsible for grandchildrenAsian 16 58.0% Responsible for grandchildren11 42.0% Not responsible for grandchildrenOther race 120 100.0% Not responsible for grandchildrenTwo or more races 71 63.4% Responsible for grandchildren41 36.6% Not responsible for grandchildrenWhite alone, not Hispanic / Latino 59 42.6% Responsible for grandchildren79 57.4% Not responsible for grandchildrenHispanic or Latino 72 22.0% Responsible for grandchildren255 78.0% Not responsible for grandchildrenGrandparents (60 years and over) White / Caucasian 109 25.4% Responsible for grandchildren320 74.6% Not responsible for grandchildrenBlack or African American 39 55.1% Responsible for grandchildren32 44.9% Not responsible for grandchildrenAmerican Indian / Alaska Native 16 72.2% Responsible for grandchildren6 27.8% Not responsible for grandchildrenAsian 143 100.0% Not responsible for grandchildrenOther race 8 8.2% Responsible for grandchildren92 91.8% Not responsible for grandchildrenTwo or more races 630 100.0% Not responsible for grandchildrenWhite alone, not Hispanic / Latino 113 34.8% Responsible for grandchildren212 65.2% Not responsible for grandchildrenHispanic or Latino 25 3.3% Responsible for grandchildren740 96.7% Not responsible for grandchildren