Races in Pasadena, Texas (TX) Detailed Stats
Data:
Races - White alone (%)
Races - White alone (% change since 2000)
Races - Black alone (%)
Races - Black alone (% change since 2000)
Races - American Indian alone (%)
Races - American Indian alone (% change since 2000)
Races - Asian alone (%)
Races - Asian alone (% change since 2000)
Races - Hispanic (%)
Races - Hispanic (% change since 2000)
Races - Native Hawaiian and Other Pacific Islander alone (%)
Races - Native Hawaiian and Other Pacific Islander alone (% change since 2000)
Races - Two or more races(%)
Races - Two or more races(% change since 2000)
Races - Other race alone (%)
Races - Other race alone (% change since 2000)
Racial diversity
Place of birth - Born in state of residence (%)
Place of birth - Born in state of residence (%) - White
Place of birth - Born in state of residence (%) - Black or African American
Place of birth - Born in state of residence (%) - Asian
Place of birth - Born in state of residence (%) - Hispanic or Latino
Place of birth - Born in state of residence (%) - American Indian and Alaska Native
Place of birth - Born in state of residence (%) - Multirace
Place of birth - Born in state of residence (%) - Other Race
Place of birth - Born in other state (%)
Place of birth - Born in other state (%) - White
Place of birth - Born in other state (%) - Black or African American
Place of birth - Born in other state (%) - Asian
Place of birth - Born in other state (%) - Hispanic or Latino
Place of birth - Born in other state (%) - American Indian and Alaska Native
Place of birth - Born in other state (%) - Multirace
Place of birth - Born in other state (%) - Other Race
Place of birth - Native, outside of US (%)
Place of birth - Native, outside of US (%) - White
Place of birth - Native, outside of US (%) - Black or African American
Place of birth - Native, outside of US (%) - Asian
Place of birth - Native, outside of US (%) - Hispanic or Latino
Place of birth - Native, outside of US (%) - American Indian and Alaska Native
Place of birth - Native, outside of US (%) - Multirace
Place of birth - Native, outside of US (%) - Other Race
Place of birth - Foreign born (%)
Place of birth - Foreign born (%) - White
Place of birth - Foreign born (%) - Black or African American
Place of birth - Foreign born (%) - Asian
Place of birth - Foreign born (%) - Hispanic or Latino
Place of birth - Foreign born (%) - American Indian and Alaska Native
Place of birth - Foreign born (%) - Multirace
Place of birth - Foreign born (%) - Other Race
Residents speaking English at home (%)
Residents speaking English at home - Born in the United States (%)
Residents speaking English at home - Native, born elsewhere (%)
Residents speaking English at home - Foreign born (%)
Residents speaking Spanish at home (%)
Residents speaking Spanish at home - Born in the United States (%)
Residents speaking Spanish at home - Native, born elsewhere (%)
Residents speaking Spanish at home - Foreign born (%)
Residents speaking other language at home (%)
Residents speaking other language at home - Born in the United States (%)
Residents speaking other language at home - Native, born elsewhere (%)
Residents speaking other language at home - Foreign born (%)
Marital status - Never married (%)
Marital status - Now married (%)
Marital status - Separated (%)
Marital status - Widowed (%)
Marital status - Divorced (%)
Ancestries Reported - Arab (%)
Ancestries Reported - Czech (%)
Ancestries Reported - Danish (%)
Ancestries Reported - Dutch (%)
Ancestries Reported - English (%)
Ancestries Reported - French (%)
Ancestries Reported - French Canadian (%)
Ancestries Reported - German (%)
Ancestries Reported - Greek (%)
Ancestries Reported - Hungarian (%)
Ancestries Reported - Irish (%)
Ancestries Reported - Italian (%)
Ancestries Reported - Lithuanian (%)
Ancestries Reported - Norwegian (%)
Ancestries Reported - Polish (%)
Ancestries Reported - Portuguese (%)
Ancestries Reported - Russian (%)
Ancestries Reported - Scotch-Irish (%)
Ancestries Reported - Scottish (%)
Ancestries Reported - Slovak (%)
Ancestries Reported - Subsaharan African (%)
Ancestries Reported - Swedish (%)
Ancestries Reported - Swiss (%)
Ancestries Reported - Ukrainian (%)
Ancestries Reported - United States (%)
Ancestries Reported - Welsh (%)
Ancestries Reported - West Indian (%)
Ancestries Reported - Other (%)
Geographical mobility - Same house 1 year ago (%)
Geographical mobility - Same house 1 year ago (%) - White
Geographical mobility - Same house 1 year ago (%) - Black or African American
Geographical mobility - Same house 1 year ago (%) - Asian
Geographical mobility - Same house 1 year ago (%) - Hispanic or Latino
Geographical mobility - Same house 1 year ago (%) - American Indian and Alaska Native
Geographical mobility - Same house 1 year ago (%) - Multirace
Geographical mobility - Same house 1 year ago (%) - Other Race
Geographical mobility - Moved within same county (%)
Geographical mobility - Moved within same county (%) - White
Geographical mobility - Moved within same county (%) - Black or African American
Geographical mobility - Moved within same county (%) - Asian
Geographical mobility - Moved within same county (%) - Hispanic or Latino
Geographical mobility - Moved within same county (%) - American Indian and Alaska Native
Geographical mobility - Moved within same county (%) - Multirace
Geographical mobility - Moved within same county (%) - Other Race
Geographical mobility - Moved from different county within same state (%)
Geographical mobility - Moved from different county within same state (%) - White
Geographical mobility - Moved from different county within same state (%) - Black or African American
Geographical mobility - Moved from different county within same state (%) - Asian
Geographical mobility - Moved from different county within same state (%) - Hispanic or Latino
Geographical mobility - Moved from different county within same state (%) - American Indian and Alaska Native
Geographical mobility - Moved from different county within same state (%) - Multirace
Geographical mobility - Moved from different county within same state (%) - Other Race
Geographical mobility - Moved from different state (%)
Geographical mobility - Moved from different state (%) - White
Geographical mobility - Moved from different state (%) - Black or African American
Geographical mobility - Moved from different state (%) - Asian
Geographical mobility - Moved from different state (%) - Hispanic or Latino
Geographical mobility - Moved from different state (%) - American Indian and Alaska Native
Geographical mobility - Moved from different state (%) - Multirace
Geographical mobility - Moved from different state (%) - Other Race
Geographical mobility - Moved from abroad (%)
Geographical mobility - Moved from abroad (%) - White
Geographical mobility - Moved from abroad (%) - Black or African American
Geographical mobility - Moved from abroad (%) - Asian
Geographical mobility - Moved from abroad (%) - Hispanic or Latino
Geographical mobility - Moved from abroad (%) - American Indian and Alaska Native
Geographical mobility - Moved from abroad (%) - Multirace
Geographical mobility - Moved from abroad (%) - Other Race
Place of birth for the foreign-born population - Ireland (%)
Place of birth for the foreign-born population - Denmark (%)
Place of birth for the foreign-born population - Norway (%)
Place of birth for the foreign-born population - Sweden (%)
Place of birth for the foreign-born population - United Kingdom (%)
Place of birth for the foreign-born population - England (%)
Place of birth for the foreign-born population - Scotland (%)
Place of birth for the foreign-born population - Other Northern Europe (%)
Place of birth for the foreign-born population - Austria (%)
Place of birth for the foreign-born population - Belgium (%)
Place of birth for the foreign-born population - France (%)
Place of birth for the foreign-born population - Germany (%)
Place of birth for the foreign-born population - Netherlands (%)
Place of birth for the foreign-born population - Switzerland (%)
Place of birth for the foreign-born population - Other Western Europe (%)
Place of birth for the foreign-born population - Greece (%)
Place of birth for the foreign-born population - Italy (%)
Place of birth for the foreign-born population - Portugal (%)
Place of birth for the foreign-born population - Spain (%)
Place of birth for the foreign-born population - Other Southern Europe (%)
Place of birth for the foreign-born population - Albania (%)
Place of birth for the foreign-born population - Belarus (%)
Place of birth for the foreign-born population - Bosnia and Herzegovina (%)
Place of birth for the foreign-born population - Bulgaria (%)
Place of birth for the foreign-born population - Croatia (%)
Place of birth for the foreign-born population - Czechoslovakia (%)
Place of birth for the foreign-born population - Hungary (%)
Place of birth for the foreign-born population - Latvia (%)
Place of birth for the foreign-born population - Lithuania (%)
Place of birth for the foreign-born population - North Macedonia (Macedonia) (%)
Place of birth for the foreign-born population - Moldova (%)
Place of birth for the foreign-born population - Poland (%)
Place of birth for the foreign-born population - Romania (%)
Place of birth for the foreign-born population - Russia (%)
Place of birth for the foreign-born population - Serbia (%)
Place of birth for the foreign-born population - Ukraine (%)
Place of birth for the foreign-born population - Other Eastern Europe (%)
Place of birth for the foreign-born population - China (%)
Place of birth for the foreign-born population - Hong Kong (%)
Place of birth for the foreign-born population - Taiwan (%)
Place of birth for the foreign-born population - Japan (%)
Place of birth for the foreign-born population - Korea (%)
Place of birth for the foreign-born population - Other Eastern Asia (%)
Place of birth for the foreign-born population - Afghanistan (%)
Place of birth for the foreign-born population - Bangladesh (%)
Place of birth for the foreign-born population - India (%)
Place of birth for the foreign-born population - Iran (%)
Place of birth for the foreign-born population - Kazakhstan (%)
Place of birth for the foreign-born population - Nepal (%)
Place of birth for the foreign-born population - Pakistan (%)
Place of birth for the foreign-born population - Sri Lanka (%)
Place of birth for the foreign-born population - Uzbekistan (%)
Place of birth for the foreign-born population - Other South Central Asia (%)
Place of birth for the foreign-born population - Burma (%)
Place of birth for the foreign-born population - Cambodia (%)
Place of birth for the foreign-born population - Indonesia (%)
Place of birth for the foreign-born population - Laos (%)
Place of birth for the foreign-born population - Malaysia (%)
Place of birth for the foreign-born population - Philippines (%)
Place of birth for the foreign-born population - Singapore (%)
Place of birth for the foreign-born population - Thailand (%)
Place of birth for the foreign-born population - Vietnam (%)
Place of birth for the foreign-born population - Other South Eastern Asia (%)
Place of birth for the foreign-born population - Armenia (%)
Place of birth for the foreign-born population - Iraq (%)
Place of birth for the foreign-born population - Israel (%)
Place of birth for the foreign-born population - Jordan (%)
Place of birth for the foreign-born population - Kuwait (%)
Place of birth for the foreign-born population - Lebanon (%)
Place of birth for the foreign-born population - Saudi Arabia (%)
Place of birth for the foreign-born population - Syria (%)
Place of birth for the foreign-born population - Turkey (%)
Place of birth for the foreign-born population - Yemen (%)
Place of birth for the foreign-born population - Other Western Asia (%)
Place of birth for the foreign-born population - Eritrea (%)
Place of birth for the foreign-born population - Ethiopia (%)
Place of birth for the foreign-born population - Kenya (%)
Place of birth for the foreign-born population - Somalia (%)
Place of birth for the foreign-born population - Uganda (%)
Place of birth for the foreign-born population - Zimbabwe (%)
Place of birth for the foreign-born population - Other Eastern Africa (%)
Place of birth for the foreign-born population - Cameroon (%)
Place of birth for the foreign-born population - Congo (%)
Place of birth for the foreign-born population - Democratic Republic of Congo (Zaire) (%)
Place of birth for the foreign-born population - Other Middle Africa (%)
Place of birth for the foreign-born population - Egypt (%)
Place of birth for the foreign-born population - Morocco (%)
Place of birth for the foreign-born population - Sudan (%)
Place of birth for the foreign-born population - Other Northern Africa (%)
Place of birth for the foreign-born population - South Africa (%)
Place of birth for the foreign-born population - Other Southern Africa (%)
Place of birth for the foreign-born population - Cabo Verde (%)
Place of birth for the foreign-born population - Ghana (%)
Place of birth for the foreign-born population - Liberia (%)
Place of birth for the foreign-born population - Nigeria (%)
Place of birth for the foreign-born population - Senegal (%)
Place of birth for the foreign-born population - Sierra Leone (%)
Place of birth for the foreign-born population - Other Western Africa (%)
Place of birth for the foreign-born population - Australia (%)
Place of birth for the foreign-born population - New Zealand (%)
Place of birth for the foreign-born population - Fiji (%)
Place of birth for the foreign-born population - Micronesia (%)
Place of birth for the foreign-born population - Bahamas (%)
Place of birth for the foreign-born population - Barbados (%)
Place of birth for the foreign-born population - Cuba (%)
Place of birth for the foreign-born population - Dominica (%)
Place of birth for the foreign-born population - Dominican Republic (%)
Place of birth for the foreign-born population - Grenada (%)
Place of birth for the foreign-born population - Haiti (%)
Place of birth for the foreign-born population - Jamaica (%)
Place of birth for the foreign-born population - St. Vincent and the Grenadines (%)
Place of birth for the foreign-born population - Trinidad and Tobago (%)
Place of birth for the foreign-born population - West Indies (%)
Place of birth for the foreign-born population - Other Caribbean (%)
Place of birth for the foreign-born population - Belize (%)
Place of birth for the foreign-born population - Costa Rica (%)
Place of birth for the foreign-born population - El Salvador (%)
Place of birth for the foreign-born population - Guatemala (%)
Place of birth for the foreign-born population - Honduras (%)
Place of birth for the foreign-born population - Mexico (%)
Place of birth for the foreign-born population - Nicaragua (%)
Place of birth for the foreign-born population - Panama (%)
Place of birth for the foreign-born population - Other Central America (%)
Place of birth for the foreign-born population - Argentina (%)
Place of birth for the foreign-born population - Bolivia (%)
Place of birth for the foreign-born population - Brazil (%)
Place of birth for the foreign-born population - Chile (%)
Place of birth for the foreign-born population - Colombia (%)
Place of birth for the foreign-born population - Ecuador (%)
Place of birth for the foreign-born population - Guyana (%)
Place of birth for the foreign-born population - Peru (%)
Place of birth for the foreign-born population - Uruguay (%)
Place of birth for the foreign-born population - Venezuela (%)
Place of birth for the foreign-born population - Other South America (%)
Place of birth for the foreign-born population - Canada (%)
Place of birth for the foreign-born population - Other Northern America (%)
Place of birth for the foreign-born population - Other (%)
Latest news about races in Pasadena, TX collected exclusively by city-data.com from local newspapers, TV, and radio stations
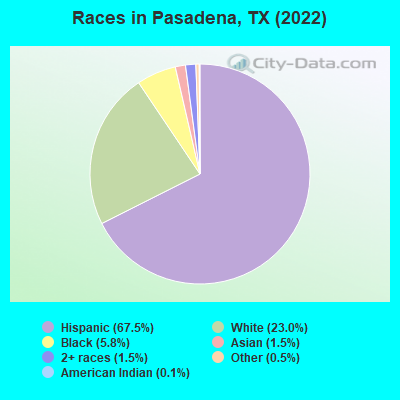
According to 2022 data, the most numerous races in Pasadena, TX are Hispanic (99,611 residents), White alone (33,999 residents), and Black alone (8,603 residents). 46.1% of Pasadena residents speak English at home. 26.5% of Pasadena, TX residents are foreign-born (24.2% born in Latin America), which is 36.0% greater than the foreign-born rate of 17.0% across the entire state of Texas.
Race distribution in Pasadena
2000 2022
68,348 48.2% Hispanic 66,923 47.2% White alone 2,531 1.8% Asian alone 2,068 1.5% Black alone 1,265 0.9% Two or more races 409 0.3% American Indian alone 99 0.07% Other race alone 31 0.02% Native Hawaiian and Other
99,611 67.5% Hispanic 33,999 23.0% White alone 8,603 5.8% Black alone 2,276 1.5% Asian alone 2,253 1.5% Two or more races 774 0.5% Other race alone 149 0.1% American Indian alone
2000 2022
10,933,313 52.4% White alone 6,669,666 32.0% Hispanic 2,364,255 11.3% Black alone 554,445 2.7% Asian alone 230,567 1.1% Two or more races 68,859 0.3% American Indian alone 19,958 0.10% Other race alone 10,757 0.05% Native Hawaiian and Other
12,070,642 40.2% Hispanic 11,683,430 38.9% White alone 3,508,706 11.7% Black alone 1,608,173 5.4% Asian alone 956,560 3.2% Two or more races 125,763 0.4% Other race alone 47,023 0.2% American Indian alone 29,275 0.10% Native Hawaiian and Other
Income and house value in Pasadena Median household income in 2022 $61,442 White non-Hispanic householders$32,018 Black householders$20,828 American Indian and Alaska Native householders$100,966 Asian householders$59,227 Some other race householders$59,082 Two or more races householders$56,529 Hispanic or Latino race householdersMedian 2022 house value $226,627 White Non-Hispanic householders$397,633 Black or African American householders$162,130 American Indian or Alaska Native householders $338,165 Asian householders$221,893 Native Hawaiian and other Pacific Islander householders$163,313 Some other race householders$191,420 Two or more races householders$170,118 Hispanic or Latino householders
Median age by race in Pasadena
36.1 Median age for White residents35.6 36.2 29.3 Median age for Black or African American residents32.4 27.6 32.6 Median age for American Indian / Alaska Native residents32.5 48.6 54.4 Median age for Asian residents45.5 54.9 -666,666,666.0 Median age for Native Hawaiian / Pacific Islander residents-666,666,666.0 -666,666,666.0 27.8 Median age for Other race residents28.7 24.9 30.4 Median age for Two or more races residents28.6 31.7 49.8 Median age for White alone residents48.1 52.1 27.4 Median age for Hispanic or Latino residents28.1 27.2
Owner/renter occupied households by race in Pasadena
House owners and renters - White residents 11,775 56.7% Owner occupied8,995 43.3% Renter occupiedHouse owners and renters - Black or African American residents 608 20.9% Owner occupied2,299 79.1% Renter occupiedHouse owners and renters - American Indian / Alaska Native residents 478 50.0% Owner occupied478 50.0% Renter occupiedHouse owners and renters - Asian residents 516 60.2% Owner occupied341 39.8% Renter occupiedHouse owners and renters - Other race residents 4,451 56.3% Owner occupied3,451 43.7% Renter occupiedHouse owners and renters - Two or more races residents 8,766 55.2% Owner occupied7,116 44.8% Renter occupiedHouse owners and renters - White alone residents 9,449 63.0% Owner occupied5,557 37.0% Renter occupiedHouse owners and renters - Hispanic or Latino residents 15,797 54.2% Owner occupied13,360 45.8% Renter occupied
Language usage in Pasadena
English speakers - Total 46.1% of residents of Pasadena speak English at home.
51.6% of residents speak Spanish at home 39,858 56.5% Speak English very well30,709 43.5% Speak English less than very well2.2% of residents speak other language at home 1,867 61.3% Speak English very well1,181 38.7% Speak English less than very well
English speakers - Born in the United States 80.8% of residents of Pasadena speak English at home.
17.9% of residents speak Spanish at home 3,060 90.6% Speak English very well319 9.4% Speak English less than very well1.3% of residents speak other language at home 204 81.0% Speak English very well48 19.0% Speak English less than very well
English speakers - Native, born elsewhere 36.9% of residents of Pasadena speak English at home.
48.8% of residents speak Spanish at home 505 88.8% Speak English very well64 11.2% Speak English less than very well14.2% of residents speak other language at home 166 100.0% Speak English less than very well
English speakers - Foreign-born 5.6% of residents of Pasadena speak English at home.
88.0% of residents speak Spanish at home 10,596 31.2% Speak English very well23,335 68.8% Speak English less than very well6.4% of residents speak other language at home 1,514 61.0% Speak English very well967 39.0% Speak English less than very well
White (Caucasian) - Speak only English Native:
80.1% (38,118)Foreign-born:
3.5% (136)
White (Caucasian) - Speak another language Native:
19.9% (9,476)Foreign-born:
96.5% (3,727)
Black or African American - Speak only English Native:
95.8% (3,766)Foreign-born:
60.6% (77)
Black or African American - Speak another language Native:
4.2% (164)Foreign-born:
33.3% (42)
American Indian / Alaska Native - Speak another language Native:
39.6% (833)Foreign-born:
98.9% (574)
Asian - Speak only English Native:
41.2% (206)Foreign-born:
20.3% (436)
Asian - Speak another language Native:
58.7% (293)Foreign-born:
79.7% (1,713)
Other race - Speak only English Native:
35.7% (5,234)Foreign-born:
5.6% (710)
Other race - Speak another language Native:
64.3% (9,432)Foreign-born:
94.4% (11,990)
Two or more races - Speak only English Native:
37.6% (10,181)Foreign-born:
5.3% (1,023)
Two or more races - Speak another language Native:
62.4% (16,915)Foreign-born:
94.7% (18,401)
White alone - Speak only English Native:
97.5% (31,052)Foreign-born:
9.7% (82)
White alone - Speak another language Native:
2.5% (797)Foreign-born:
90.3% (767)
Hispanic or Latino - Speak only English Native:
36.6% (20,492)Foreign-born:
5.0% (1,787)
Hispanic or Latino - Speak another language Native:
63.4% (35,478)Foreign-born:
95.0% (33,819)
Foreign-born residents in Pasadena 40,443 residents are foreign born (24.2% Latin America ).
This city:
26.5%Texas:
17.1%
Marital status for residents in Pasadena Marital status - White (Caucasian) population 15 years and over
Males 34.1% Never married48.1% Now married2.0% Separated2.2% Widowed13.5% DivorcedFemales 27.6% Never married46.7% Now married2.3% Separated11.2% Widowed12.2% DivorcedWomen who gave birth in the past 12 months Now married:
74.0% (653)Unmarried:
26.0% (229)
Women who did not give birth in the past 12 months Now married:
49.9% (6,154)Unmarried:
50.1% (6,170)
Marital status - Black or African American population 15 years and over
Males 59.2% Never married25.3% Now married4.4% Separated1.1% Widowed10.0% DivorcedFemales 45.9% Never married26.5% Now married4.4% Separated9.1% Widowed14.1% DivorcedWomen who gave birth in the past 12 months Now married:
38.5% (35)Unmarried:
61.5% (56)
Women who did not give birth in the past 12 months Now married:
33.9% (414)Unmarried:
66.1% (807)
Marital status - American Indian / Alaska Native population 15 years and over
Males 33.0% Never married49.4% Now married0.0% Separated0.0% Widowed17.7% DivorcedFemales 56.0% Never married27.0% Now married3.0% Separated5.4% Widowed8.6% DivorcedWomen who gave birth in the past 12 months Now married:
100.0% (39)Unmarried:
0.0% (0)
Women who did not give birth in the past 12 months Now married:
26.2% (281)Unmarried:
73.8% (790)
Marital status - Asian population 15 years and over
Males 27.6% Never married64.7% Now married0.0% Separated2.8% Widowed4.9% DivorcedFemales 18.4% Never married53.0% Now married1.3% Separated15.5% Widowed11.8% DivorcedWomen who gave birth in the past 12 months Now married:
100.0% (57)Unmarried:
0.0% (0)
Women who did not give birth in the past 12 months Now married:
60.0% (268)Unmarried:
40.0% (179)
Marital status - Other race population 15 years and over
Males 33.4% Never married59.9% Now married0.8% Separated0.3% Widowed5.6% DivorcedFemales 30.2% Never married47.3% Now married3.6% Separated9.9% Widowed9.1% DivorcedWomen who gave birth in the past 12 months Now married:
100.0% (485)Unmarried:
0.0% (0)
Women who did not give birth in the past 12 months Now married:
47.0% (2,906)Unmarried:
53.0% (3,275)
Marital status - Two or more races population 15 years and over
Males 45.7% Never married44.8% Now married2.4% Separated3.2% Widowed4.1% DivorcedFemales 38.0% Never married44.1% Now married8.4% Separated3.7% Widowed5.8% DivorcedWomen who gave birth in the past 12 months Now married:
93.2% (879)Unmarried:
6.8% (64)
Women who did not give birth in the past 12 months Now married:
38.0% (4,547)Unmarried:
62.0% (7,408)
Marital status - White alone, not Hispanic / Latino population 15 years and over
Males 26.9% Never married49.5% Now married3.0% Separated3.4% Widowed17.2% DivorcedFemales 18.5% Never married47.9% Now married1.5% Separated16.1% Widowed16.0% DivorcedWomen who gave birth in the past 12 months Now married:
45.2% (68)Unmarried:
54.8% (83)
Women who did not give birth in the past 12 months Now married:
47.6% (2,672)Unmarried:
52.4% (2,942)
Marital status - Hispanic or Latino population 15 years and over
Males 42.2% Never married48.8% Now married1.5% Separated1.8% Widowed5.7% DivorcedFemales 38.4% Never married46.1% Now married4.2% Separated4.6% Widowed6.6% DivorcedWomen who gave birth in the past 12 months Now married:
91.9% (2,074)Unmarried:
8.1% (184)
Women who did not give birth in the past 12 months Now married:
40.2% (9,484)Unmarried:
59.8% (14,134)
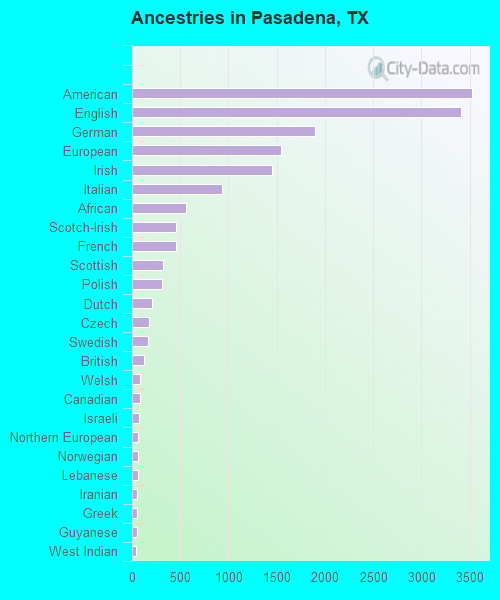
Ancestries in Pasadena
3,524 3.4% American3,412 3.3% English1,895 1.8% German1,542 1.5% European1,447 1.4% Irish932 0.9% Italian564 0.5% African453 0.4% Scotch-Irish451 0.4% French317 0.3% Scottish306 0.3% Polish212 0.2% Dutch178 0.2% Czech166 0.2% Swedish120 0.1% British88 0.08% Welsh78 0.07% Canadian71 0.07% Israeli66 0.06% Northern European65 0.06% Norwegian64 0.06% Lebanese53 0.05% Iranian53 0.05% Greek47 0.04% Guyanese46 0.04% West Indian38 0.04% French Canadian32 0.03% Eastern European32 0.03% Danish31 0.03% Russian30 0.03% British West Indian26 0.02% Cajun25 0.02% Egyptian20 0.02% Romanian20 0.02% Hungarian17 0.02% Brazilian15 0.01% Swiss14 0.01% Trinidadian and Tobagonian13 0.01% Nigerian12 0.01% Czechoslovakian12 0.01% Jamaican8 0.01% Lithuanian7 0.01% Syrian7 0.01% Iraqi7 0.01% Ukrainian6 0.01% Bulgarian
Geographical mobility in Pasadena Same house 1 year ago 47,837 87.6% White (Caucasian)2,690 61.2% Black or African American2,897 86.9% American Indian / Alaska Native2,267 84.2% Asian20 98.2% Native Hawaiian / Pacific Islander26,273 88.5% Other race41,646 82.3% Two or more races29,787 88.4% White alone, not Hispanic / Latino83,312 84.8% Hispanic or LatinoMoved within same county 5,469 10.0% White / Caucasian1,238 28.2% Black or African American352 10.6% American Indian / Alaska Native150 5.6% Asian2,815 9.5% Other race7,231 14.3% Two or more races2,648 7.9% White alone, not Hispanic / Latino14,177 14.4% Hispanic or LatinoMoved within same state 878 1.6% White / Caucasian211 4.8% Black or African American26 0.8% American Indian / Alaska Native108 4.0% Asian92 0.3% Other race353 0.7% Two or more races853 2.5% White alone, not Hispanic / Latino339 0.3% Hispanic or LatinoMoved from different state 184 0.3% White / Caucasian90 2.0% Black or African American16 0.5% American Indian / Alaska Native80 3.0% Asian8 0.0% Other race399 0.8% Two or more races184 0.5% White alone, not Hispanic / Latino372 0.4% Hispanic or LatinoMoved from abroad 217 0.4% White14 0.3% Black or African American87 3.2% Asian510 1.7% Other race290 0.6% Two or more races217 0.6% White alone, not Hispanic / Latino40 0.0% Hispanic or Latino
Children Nativity (place of birth) in Pasadena
Children under 6 years - Living with two parents Both parents native 4,343 100.0% NativeBoth parents foreign-born 1,156 79.3% Native301 20.7% Foreign-bornOne native, one foreign-born parent 2,363 100.0% NativeChildren under 6 years - Living with one parent Native parent 3,814 100.0% NativeForeign-born parent 481 74.0% Native169 26.0% Foreign-bornChildren 6 to 17 years - Living with two parents Both parents native 5,836 100.0% NativeBoth parents foreign-born 6,228 74.0% Native2,191 26.0% Foreign-bornOne native, one foreign-born parent 2,811 100.0% NativeChildren 6 to 17 years - Living with one parent Native parent 7,823 100.0% NativeForeign-born parent 5,287 54.1% Native4,484 45.9% Foreign-born
Grandparents responsible for own grandchildren in Pasadena
Grandparents (30 to 59 years) White / Caucasian 281 36.0% Responsible for grandchildren500 64.0% Not responsible for grandchildrenBlack or African American 4 100.0% Not responsible for grandchildrenOther race 37 58.5% Responsible for grandchildren26 41.5% Not responsible for grandchildrenTwo or more races 466 32.7% Responsible for grandchildren958 67.3% Not responsible for grandchildrenWhite alone, not Hispanic / Latino 56 28.2% Responsible for grandchildren144 71.8% Not responsible for grandchildrenHispanic or Latino 735 34.4% Responsible for grandchildren1,403 65.6% Not responsible for grandchildrenGrandparents (60 years and over) White / Caucasian 80 14.1% Responsible for grandchildren486 85.9% Not responsible for grandchildrenBlack or African American 11 59.3% Responsible for grandchildren8 40.7% Not responsible for grandchildrenOther race 62 11.3% Responsible for grandchildren492 88.7% Not responsible for grandchildrenTwo or more races 28 5.0% Responsible for grandchildren538 95.0% Not responsible for grandchildrenWhite alone, not Hispanic / Latino 28 11.0% Responsible for grandchildren226 89.0% Not responsible for grandchildrenHispanic or Latino 149 12.9% Responsible for grandchildren1,009 87.1% Not responsible for grandchildren