Races in Pikesville, Maryland (MD) Detailed Stats
Data:
Races - White alone (%)
Races - White alone (% change since 2000)
Races - Black alone (%)
Races - Black alone (% change since 2000)
Races - American Indian alone (%)
Races - American Indian alone (% change since 2000)
Races - Asian alone (%)
Races - Asian alone (% change since 2000)
Races - Hispanic (%)
Races - Hispanic (% change since 2000)
Races - Native Hawaiian and Other Pacific Islander alone (%)
Races - Native Hawaiian and Other Pacific Islander alone (% change since 2000)
Races - Two or more races(%)
Races - Two or more races(% change since 2000)
Races - Other race alone (%)
Races - Other race alone (% change since 2000)
Racial diversity
Place of birth - Born in state of residence (%)
Place of birth - Born in state of residence (%) - White
Place of birth - Born in state of residence (%) - Black or African American
Place of birth - Born in state of residence (%) - Asian
Place of birth - Born in state of residence (%) - Hispanic or Latino
Place of birth - Born in state of residence (%) - American Indian and Alaska Native
Place of birth - Born in state of residence (%) - Multirace
Place of birth - Born in state of residence (%) - Other Race
Place of birth - Born in other state (%)
Place of birth - Born in other state (%) - White
Place of birth - Born in other state (%) - Black or African American
Place of birth - Born in other state (%) - Asian
Place of birth - Born in other state (%) - Hispanic or Latino
Place of birth - Born in other state (%) - American Indian and Alaska Native
Place of birth - Born in other state (%) - Multirace
Place of birth - Born in other state (%) - Other Race
Place of birth - Native, outside of US (%)
Place of birth - Native, outside of US (%) - White
Place of birth - Native, outside of US (%) - Black or African American
Place of birth - Native, outside of US (%) - Asian
Place of birth - Native, outside of US (%) - Hispanic or Latino
Place of birth - Native, outside of US (%) - American Indian and Alaska Native
Place of birth - Native, outside of US (%) - Multirace
Place of birth - Native, outside of US (%) - Other Race
Place of birth - Foreign born (%)
Place of birth - Foreign born (%) - White
Place of birth - Foreign born (%) - Black or African American
Place of birth - Foreign born (%) - Asian
Place of birth - Foreign born (%) - Hispanic or Latino
Place of birth - Foreign born (%) - American Indian and Alaska Native
Place of birth - Foreign born (%) - Multirace
Place of birth - Foreign born (%) - Other Race
Residents speaking English at home (%)
Residents speaking English at home - Born in the United States (%)
Residents speaking English at home - Native, born elsewhere (%)
Residents speaking English at home - Foreign born (%)
Residents speaking Spanish at home (%)
Residents speaking Spanish at home - Born in the United States (%)
Residents speaking Spanish at home - Native, born elsewhere (%)
Residents speaking Spanish at home - Foreign born (%)
Residents speaking other language at home (%)
Residents speaking other language at home - Born in the United States (%)
Residents speaking other language at home - Native, born elsewhere (%)
Residents speaking other language at home - Foreign born (%)
Marital status - Never married (%)
Marital status - Now married (%)
Marital status - Separated (%)
Marital status - Widowed (%)
Marital status - Divorced (%)
Ancestries Reported - Arab (%)
Ancestries Reported - Czech (%)
Ancestries Reported - Danish (%)
Ancestries Reported - Dutch (%)
Ancestries Reported - English (%)
Ancestries Reported - French (%)
Ancestries Reported - French Canadian (%)
Ancestries Reported - German (%)
Ancestries Reported - Greek (%)
Ancestries Reported - Hungarian (%)
Ancestries Reported - Irish (%)
Ancestries Reported - Italian (%)
Ancestries Reported - Lithuanian (%)
Ancestries Reported - Norwegian (%)
Ancestries Reported - Polish (%)
Ancestries Reported - Portuguese (%)
Ancestries Reported - Russian (%)
Ancestries Reported - Scotch-Irish (%)
Ancestries Reported - Scottish (%)
Ancestries Reported - Slovak (%)
Ancestries Reported - Subsaharan African (%)
Ancestries Reported - Swedish (%)
Ancestries Reported - Swiss (%)
Ancestries Reported - Ukrainian (%)
Ancestries Reported - United States (%)
Ancestries Reported - Welsh (%)
Ancestries Reported - West Indian (%)
Ancestries Reported - Other (%)
Geographical mobility - Same house 1 year ago (%)
Geographical mobility - Same house 1 year ago (%) - White
Geographical mobility - Same house 1 year ago (%) - Black or African American
Geographical mobility - Same house 1 year ago (%) - Asian
Geographical mobility - Same house 1 year ago (%) - Hispanic or Latino
Geographical mobility - Same house 1 year ago (%) - American Indian and Alaska Native
Geographical mobility - Same house 1 year ago (%) - Multirace
Geographical mobility - Same house 1 year ago (%) - Other Race
Geographical mobility - Moved within same county (%)
Geographical mobility - Moved within same county (%) - White
Geographical mobility - Moved within same county (%) - Black or African American
Geographical mobility - Moved within same county (%) - Asian
Geographical mobility - Moved within same county (%) - Hispanic or Latino
Geographical mobility - Moved within same county (%) - American Indian and Alaska Native
Geographical mobility - Moved within same county (%) - Multirace
Geographical mobility - Moved within same county (%) - Other Race
Geographical mobility - Moved from different county within same state (%)
Geographical mobility - Moved from different county within same state (%) - White
Geographical mobility - Moved from different county within same state (%) - Black or African American
Geographical mobility - Moved from different county within same state (%) - Asian
Geographical mobility - Moved from different county within same state (%) - Hispanic or Latino
Geographical mobility - Moved from different county within same state (%) - American Indian and Alaska Native
Geographical mobility - Moved from different county within same state (%) - Multirace
Geographical mobility - Moved from different county within same state (%) - Other Race
Geographical mobility - Moved from different state (%)
Geographical mobility - Moved from different state (%) - White
Geographical mobility - Moved from different state (%) - Black or African American
Geographical mobility - Moved from different state (%) - Asian
Geographical mobility - Moved from different state (%) - Hispanic or Latino
Geographical mobility - Moved from different state (%) - American Indian and Alaska Native
Geographical mobility - Moved from different state (%) - Multirace
Geographical mobility - Moved from different state (%) - Other Race
Geographical mobility - Moved from abroad (%)
Geographical mobility - Moved from abroad (%) - White
Geographical mobility - Moved from abroad (%) - Black or African American
Geographical mobility - Moved from abroad (%) - Asian
Geographical mobility - Moved from abroad (%) - Hispanic or Latino
Geographical mobility - Moved from abroad (%) - American Indian and Alaska Native
Geographical mobility - Moved from abroad (%) - Multirace
Geographical mobility - Moved from abroad (%) - Other Race
Place of birth for the foreign-born population - Ireland (%)
Place of birth for the foreign-born population - Denmark (%)
Place of birth for the foreign-born population - Norway (%)
Place of birth for the foreign-born population - Sweden (%)
Place of birth for the foreign-born population - United Kingdom (%)
Place of birth for the foreign-born population - England (%)
Place of birth for the foreign-born population - Scotland (%)
Place of birth for the foreign-born population - Other Northern Europe (%)
Place of birth for the foreign-born population - Austria (%)
Place of birth for the foreign-born population - Belgium (%)
Place of birth for the foreign-born population - France (%)
Place of birth for the foreign-born population - Germany (%)
Place of birth for the foreign-born population - Netherlands (%)
Place of birth for the foreign-born population - Switzerland (%)
Place of birth for the foreign-born population - Other Western Europe (%)
Place of birth for the foreign-born population - Greece (%)
Place of birth for the foreign-born population - Italy (%)
Place of birth for the foreign-born population - Portugal (%)
Place of birth for the foreign-born population - Spain (%)
Place of birth for the foreign-born population - Other Southern Europe (%)
Place of birth for the foreign-born population - Albania (%)
Place of birth for the foreign-born population - Belarus (%)
Place of birth for the foreign-born population - Bosnia and Herzegovina (%)
Place of birth for the foreign-born population - Bulgaria (%)
Place of birth for the foreign-born population - Croatia (%)
Place of birth for the foreign-born population - Czechoslovakia (%)
Place of birth for the foreign-born population - Hungary (%)
Place of birth for the foreign-born population - Latvia (%)
Place of birth for the foreign-born population - Lithuania (%)
Place of birth for the foreign-born population - North Macedonia (Macedonia) (%)
Place of birth for the foreign-born population - Moldova (%)
Place of birth for the foreign-born population - Poland (%)
Place of birth for the foreign-born population - Romania (%)
Place of birth for the foreign-born population - Russia (%)
Place of birth for the foreign-born population - Serbia (%)
Place of birth for the foreign-born population - Ukraine (%)
Place of birth for the foreign-born population - Other Eastern Europe (%)
Place of birth for the foreign-born population - China (%)
Place of birth for the foreign-born population - Hong Kong (%)
Place of birth for the foreign-born population - Taiwan (%)
Place of birth for the foreign-born population - Japan (%)
Place of birth for the foreign-born population - Korea (%)
Place of birth for the foreign-born population - Other Eastern Asia (%)
Place of birth for the foreign-born population - Afghanistan (%)
Place of birth for the foreign-born population - Bangladesh (%)
Place of birth for the foreign-born population - India (%)
Place of birth for the foreign-born population - Iran (%)
Place of birth for the foreign-born population - Kazakhstan (%)
Place of birth for the foreign-born population - Nepal (%)
Place of birth for the foreign-born population - Pakistan (%)
Place of birth for the foreign-born population - Sri Lanka (%)
Place of birth for the foreign-born population - Uzbekistan (%)
Place of birth for the foreign-born population - Other South Central Asia (%)
Place of birth for the foreign-born population - Burma (%)
Place of birth for the foreign-born population - Cambodia (%)
Place of birth for the foreign-born population - Indonesia (%)
Place of birth for the foreign-born population - Laos (%)
Place of birth for the foreign-born population - Malaysia (%)
Place of birth for the foreign-born population - Philippines (%)
Place of birth for the foreign-born population - Singapore (%)
Place of birth for the foreign-born population - Thailand (%)
Place of birth for the foreign-born population - Vietnam (%)
Place of birth for the foreign-born population - Other South Eastern Asia (%)
Place of birth for the foreign-born population - Armenia (%)
Place of birth for the foreign-born population - Iraq (%)
Place of birth for the foreign-born population - Israel (%)
Place of birth for the foreign-born population - Jordan (%)
Place of birth for the foreign-born population - Kuwait (%)
Place of birth for the foreign-born population - Lebanon (%)
Place of birth for the foreign-born population - Saudi Arabia (%)
Place of birth for the foreign-born population - Syria (%)
Place of birth for the foreign-born population - Turkey (%)
Place of birth for the foreign-born population - Yemen (%)
Place of birth for the foreign-born population - Other Western Asia (%)
Place of birth for the foreign-born population - Eritrea (%)
Place of birth for the foreign-born population - Ethiopia (%)
Place of birth for the foreign-born population - Kenya (%)
Place of birth for the foreign-born population - Somalia (%)
Place of birth for the foreign-born population - Uganda (%)
Place of birth for the foreign-born population - Zimbabwe (%)
Place of birth for the foreign-born population - Other Eastern Africa (%)
Place of birth for the foreign-born population - Cameroon (%)
Place of birth for the foreign-born population - Congo (%)
Place of birth for the foreign-born population - Democratic Republic of Congo (Zaire) (%)
Place of birth for the foreign-born population - Other Middle Africa (%)
Place of birth for the foreign-born population - Egypt (%)
Place of birth for the foreign-born population - Morocco (%)
Place of birth for the foreign-born population - Sudan (%)
Place of birth for the foreign-born population - Other Northern Africa (%)
Place of birth for the foreign-born population - South Africa (%)
Place of birth for the foreign-born population - Other Southern Africa (%)
Place of birth for the foreign-born population - Cabo Verde (%)
Place of birth for the foreign-born population - Ghana (%)
Place of birth for the foreign-born population - Liberia (%)
Place of birth for the foreign-born population - Nigeria (%)
Place of birth for the foreign-born population - Senegal (%)
Place of birth for the foreign-born population - Sierra Leone (%)
Place of birth for the foreign-born population - Other Western Africa (%)
Place of birth for the foreign-born population - Australia (%)
Place of birth for the foreign-born population - New Zealand (%)
Place of birth for the foreign-born population - Fiji (%)
Place of birth for the foreign-born population - Micronesia (%)
Place of birth for the foreign-born population - Bahamas (%)
Place of birth for the foreign-born population - Barbados (%)
Place of birth for the foreign-born population - Cuba (%)
Place of birth for the foreign-born population - Dominica (%)
Place of birth for the foreign-born population - Dominican Republic (%)
Place of birth for the foreign-born population - Grenada (%)
Place of birth for the foreign-born population - Haiti (%)
Place of birth for the foreign-born population - Jamaica (%)
Place of birth for the foreign-born population - St. Vincent and the Grenadines (%)
Place of birth for the foreign-born population - Trinidad and Tobago (%)
Place of birth for the foreign-born population - West Indies (%)
Place of birth for the foreign-born population - Other Caribbean (%)
Place of birth for the foreign-born population - Belize (%)
Place of birth for the foreign-born population - Costa Rica (%)
Place of birth for the foreign-born population - El Salvador (%)
Place of birth for the foreign-born population - Guatemala (%)
Place of birth for the foreign-born population - Honduras (%)
Place of birth for the foreign-born population - Mexico (%)
Place of birth for the foreign-born population - Nicaragua (%)
Place of birth for the foreign-born population - Panama (%)
Place of birth for the foreign-born population - Other Central America (%)
Place of birth for the foreign-born population - Argentina (%)
Place of birth for the foreign-born population - Bolivia (%)
Place of birth for the foreign-born population - Brazil (%)
Place of birth for the foreign-born population - Chile (%)
Place of birth for the foreign-born population - Colombia (%)
Place of birth for the foreign-born population - Ecuador (%)
Place of birth for the foreign-born population - Guyana (%)
Place of birth for the foreign-born population - Peru (%)
Place of birth for the foreign-born population - Uruguay (%)
Place of birth for the foreign-born population - Venezuela (%)
Place of birth for the foreign-born population - Other South America (%)
Place of birth for the foreign-born population - Canada (%)
Place of birth for the foreign-born population - Other Northern America (%)
Place of birth for the foreign-born population - Other (%)
Latest news about races in Pikesville, MD collected exclusively by city-data.com from local newspapers, TV, and radio stations
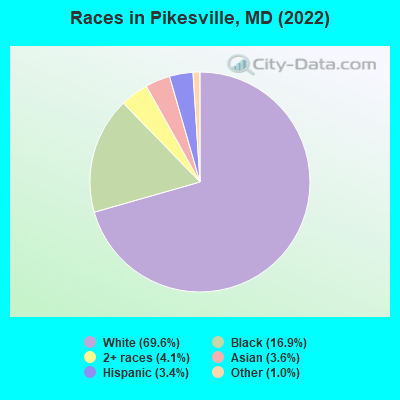
According to 2022 data, the most numerous races in Pikesville, MD are White alone (23,590 residents), Black alone (5,727 residents), and Hispanic (1,169 residents). 81.5% of Pikesville residents speak English at home. 14.7% of Pikesville, MD residents are foreign-born (5.1% born in Asia, 4.9% born in Europe, 2.2% born in Latin America), which is 9.1% less than the foreign-born rate of 16.0% across the entire state of Maryland.
Race distribution in Pikesville
2000 2022
3,286,547 62.1% White alone 1,464,735 27.7% Black alone 227,916 4.3% Hispanic 209,738 4.0% Asian alone 82,946 1.6% Two or more races 13,312 0.3% American Indian alone 9,379 0.2% Other race alone 1,913 0.04% Native Hawaiian and Other
2,906,492 47.1% White alone 1,800,914 29.2% Black alone 705,842 11.4% Hispanic 401,818 6.5% Asian alone 291,317 4.7% Two or more races 46,930 0.8% Other race alone 8,930 0.1% American Indian alone 2,417 0.04% Native Hawaiian and Other
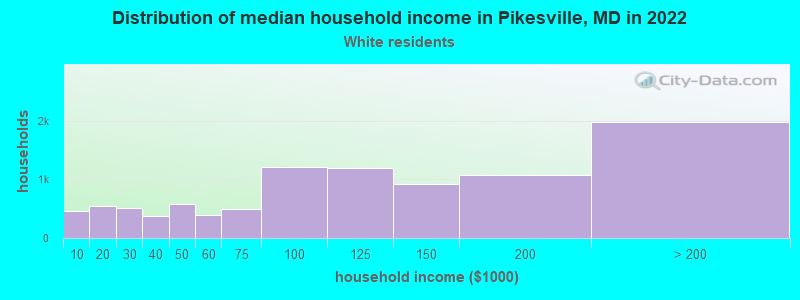
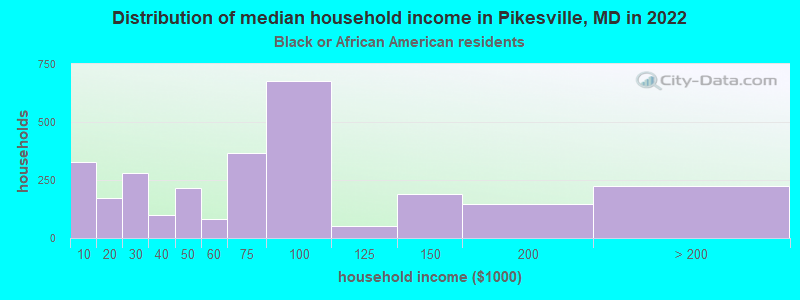
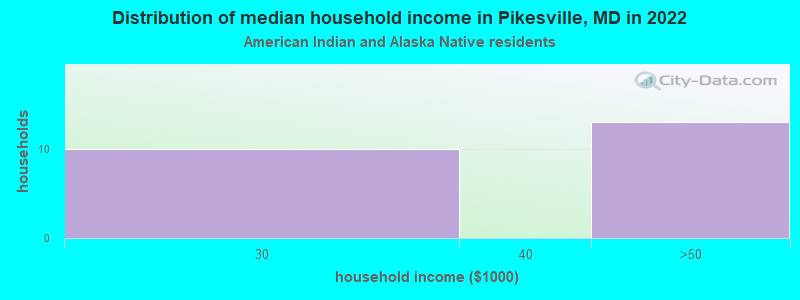
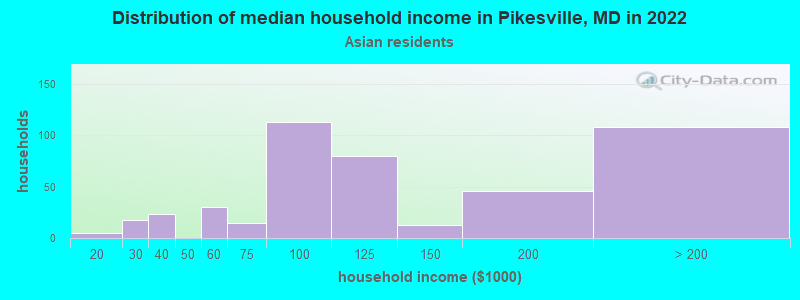
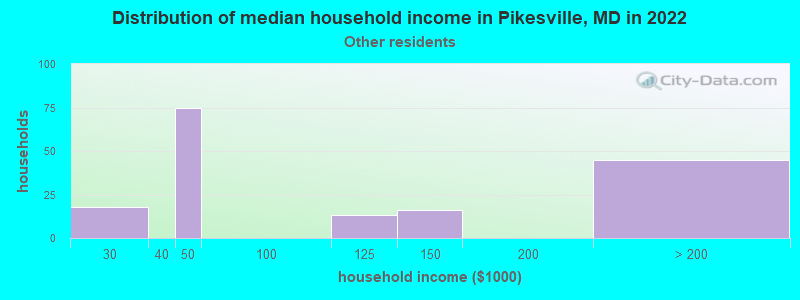
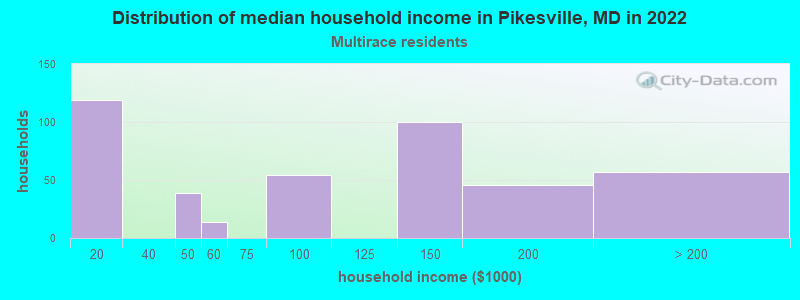
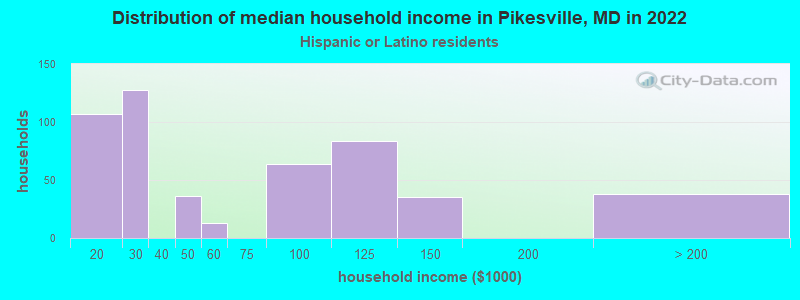
Income and house value in Pikesville Median household income in 2022 $108,369 White non-Hispanic householders$68,869 Black householders$104,272 Asian householders$94,794 Two or more races householdersMedian 2022 house value $480,140 White Non-Hispanic householders$284,927 Black or African American householders$449,958 American Indian or Alaska Native householders $449,958 Asian householders$623,019 Native Hawaiian and other Pacific Islander householders$553,795 Some other race householders$929,545 Two or more races householders$581,485 Hispanic or Latino householders
Median age by race in Pikesville
46.0 Median age for White residents45.0 46.9 39.2 Median age for Black or African American residents34.7 41.0 63.7 Median age for American Indian / Alaska Native residents-867,632,849.4 56.2 34.0 Median age for Asian residents36.7 32.6 -1,541,125,539.6 Median age for Native Hawaiian / Pacific Islander residents-790,901,136.6 -760,942,760.2 27.7 Median age for Other race residents29.9 28.3 26.6 Median age for Two or more races residents27.1 40.8 46.0 Median age for White alone residents44.7 47.1 32.0 Median age for Hispanic or Latino residents32.2 27.9
Owner/renter occupied households by race in Pikesville
House owners and renters - White residents 7,614 77.9% Owner occupied2,166 22.1% Renter occupiedHouse owners and renters - Black or African American residents 1,220 43.9% Owner occupied1,559 56.1% Renter occupiedHouse owners and renters - American Indian / Alaska Native residents 36 100.0% Owner occupiedHouse owners and renters - Asian residents 206 43.2% Owner occupied271 56.8% Renter occupiedHouse owners and renters - Native Hawaiian / Pacific Islander residents 8 100.0% Owner occupiedHouse owners and renters - Other race residents 194 91.2% Owner occupied19 8.8% Renter occupiedHouse owners and renters - Two or more races residents 284 56.3% Owner occupied220 43.7% Renter occupiedHouse owners and renters - White alone residents 7,561 78.3% Owner occupied2,099 21.7% Renter occupiedHouse owners and renters - Hispanic or Latino residents 257 51.5% Owner occupied242 48.5% Renter occupied
Language usage in Pikesville
English speakers - Total 81.5% of residents of Pikesville speak English at home.
2.5% of residents speak Spanish at home 490 60.7% Speak English very well317 39.3% Speak English less than very well15.8% of residents speak other language at home 3,271 64.6% Speak English very well1,790 35.4% Speak English less than very well
English speakers - Born in the United States 92.6% of residents of Pikesville speak English at home.
0.4% of residents speak Spanish at home 26 63.4% Speak English very well15 36.6% Speak English less than very well6.5% of residents speak other language at home 480 80.1% Speak English very well119 19.9% Speak English less than very well
English speakers - Native, born elsewhere 40.4% of residents of Pikesville speak English at home.
34.1% of residents speak other language at home 215 83.3% Speak English very well43 16.7% Speak English less than very well
English speakers - Foreign-born 24.6% of residents of Pikesville speak English at home.
11.9% of residents speak Spanish at home 353 59.9% Speak English very well236 40.1% Speak English less than very well62.7% of residents speak other language at home 1,730 55.9% Speak English very well1,366 44.1% Speak English less than very well
White (Caucasian) - Speak only English Native:
91.0% (17,971)Foreign-born:
22.2% (597)
White (Caucasian) - Speak another language Native:
7.3% (1,436)Foreign-born:
77.4% (2,085)
Black or African American - Speak only English Native:
99.2% (5,170)Foreign-born:
41.2% (142)
Black or African American - Speak another language Native:
1.2% (63)Foreign-born:
57.2% (197)
Asian - Speak only English Native:
56.1% (140)Foreign-born:
11.4% (100)
Asian - Speak another language Native:
44.0% (110)Foreign-born:
88.3% (775)
Native Hawaiian / Pacific Islander - Speak another language Native:
95.6% (5)Foreign-born:
100.0% (7)
Other race - Speak only English Native:
69.9% (290)Foreign-born:
8.7% (26)
Other race - Speak another language Native:
30.7% (127)Foreign-born:
91.6% (280)
Two or more races - Speak only English Native:
92.3% (1,026)Foreign-born:
81.6% (269)
Two or more races - Speak another language Native:
7.9% (88)Foreign-born:
35.9% (119)
White alone - Speak only English Native:
90.9% (17,949)Foreign-born:
22.0% (592)
White alone - Speak another language Native:
7.8% (1,537)Foreign-born:
78.4% (2,109)
Hispanic or Latino - Speak only English Native:
60.0% (278)Foreign-born:
2.5% (16)
Hispanic or Latino - Speak another language Native:
40.6% (189)Foreign-born:
97.5% (625)
Foreign-born residents in Pikesville 4,973 residents are foreign born (5.1% Asia , 4.9% Europe , 2.2% Latin America ).
This city:
14.7%Maryland:
15.7%
Marital status for residents in Pikesville Marital status - White (Caucasian) population 15 years and over
Males 27.9% Never married59.9% Now married1.1% Separated2.8% Widowed8.2% DivorcedFemales 23.3% Never married51.1% Now married1.6% Separated15.3% Widowed8.6% DivorcedWomen who gave birth in the past 12 months Now married:
100.0% (217)Unmarried:
0.0% (0)
Women who did not give birth in the past 12 months Now married:
55.0% (2,180)Unmarried:
45.0% (1,781)
Marital status - Black or African American population 15 years and over
Males 41.5% Never married32.0% Now married6.1% Separated6.4% Widowed13.9% DivorcedFemales 55.1% Never married17.4% Now married5.9% Separated12.1% Widowed9.5% DivorcedWomen who gave birth in the past 12 months Now married:
100.0% (58)Unmarried:
0.0% (0)
Women who did not give birth in the past 12 months Now married:
18.7% (322)Unmarried:
81.3% (1,396)
Marital status - Asian population 15 years and over
Males 18.7% Never married81.3% Now married0.0% Separated0.0% Widowed0.0% DivorcedFemales 42.6% Never married42.6% Now married14.8% Separated0.0% Widowed0.0% DivorcedWomen who gave birth in the past 12 months Now married:
100.0% (12)Unmarried:
0.0% (0)
Women who did not give birth in the past 12 months Now married:
42.2% (180)Unmarried:
57.8% (247)
Marital status - Other race population 15 years and over
Males 30.0% Never married56.4% Now married0.0% Separated0.0% Widowed13.6% DivorcedFemales 35.2% Never married46.4% Now married0.0% Separated0.0% Widowed18.4% DivorcedWomen who did not give birth in the past 12 months Now married:
50.0% (110)Unmarried:
50.0% (110)
Marital status - Two or more races population 15 years and over
Males 42.6% Never married51.1% Now married0.0% Separated0.0% Widowed6.3% DivorcedFemales 27.5% Never married51.3% Now married8.1% Separated5.9% Widowed7.2% DivorcedWomen who gave birth in the past 12 months Now married:
100.0% (36)Unmarried:
0.0% (0)
Women who did not give birth in the past 12 months Now married:
37.3% (95)Unmarried:
62.7% (160)
Marital status - White alone, not Hispanic / Latino population 15 years and over
Males 27.8% Never married60.3% Now married1.2% Separated2.9% Widowed7.9% DivorcedFemales 23.4% Never married50.7% Now married1.6% Separated15.5% Widowed8.7% DivorcedWomen who gave birth in the past 12 months Now married:
100.0% (198)Unmarried:
0.0% (0)
Women who did not give birth in the past 12 months Now married:
54.8% (2,156)Unmarried:
45.2% (1,775)
Marital status - Hispanic or Latino population 15 years and over
Males 45.2% Never married39.7% Now married0.0% Separated0.0% Widowed15.1% DivorcedFemales 14.3% Never married68.4% Now married2.6% Separated10.2% Widowed4.5% DivorcedWomen who gave birth in the past 12 months Now married:
100.0% (24)Unmarried:
0.0% (0)
Women who did not give birth in the past 12 months Now married:
62.1% (88)Unmarried:
37.9% (54)
Ancestries in Pikesville
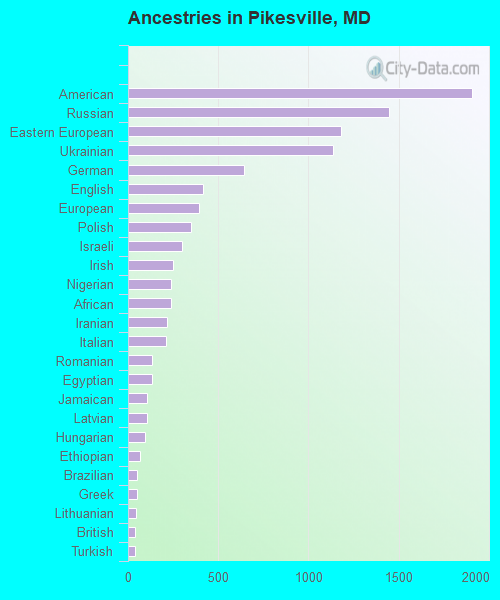
1,905 9.6% American1,444 7.3% Russian1,179 5.9% Eastern European1,135 5.7% Ukrainian641 3.2% German416 2.1% English392 2.0% European349 1.8% Polish300 1.5% Israeli247 1.2% Irish239 1.2% Nigerian238 1.2% African217 1.1% Iranian210 1.1% Italian132 0.7% Romanian131 0.7% Egyptian106 0.5% Jamaican105 0.5% Latvian94 0.5% Hungarian68 0.3% Ethiopian51 0.3% Brazilian49 0.2% Greek43 0.2% Lithuanian38 0.2% British37 0.2% Turkish30 0.2% Danish30 0.2% Soviet Union22 0.1% Austrian19 0.10% Northern European18 0.09% Lebanese18 0.09% Armenian17 0.09% Canadian14 0.07% Norwegian14 0.07% Scotch-Irish12 0.06% French9 0.05% Scottish7 0.04% Croatian7 0.04% Dutch7 0.04% Scandinavian4 0.02% Czechoslovakian
Geographical mobility in Pikesville Same house 1 year ago 21,179 90.2% White (Caucasian)5,320 91.4% Black or African American49 98.9% American Indian / Alaska Native1,027 84.6% Asian14 100.0% Native Hawaiian / Pacific Islander532 84.8% Other race1,137 72.1% Two or more races21,066 90.1% White alone, not Hispanic / Latino1,029 93.2% Hispanic or LatinoMoved within same county 993 4.2% White / Caucasian273 4.7% Black or African American100 8.3% Asian121 7.7% Two or more races1,045 4.5% White alone, not Hispanic / Latino1 0.1% Hispanic or LatinoMoved within same state 886 3.8% White / Caucasian246 4.2% Black or African American13 1.1% Asian113 18.1% Other race251 16.0% Two or more races849 3.6% White alone, not Hispanic / Latino118 10.7% Hispanic or LatinoMoved from different state 311 1.3% White / Caucasian6 0.1% Black or African American41 3.4% Asian31 2.0% Two or more races312 1.3% White alone, not Hispanic / LatinoMoved from abroad 84 0.4% White12 1.0% Asian83 0.4% White alone, not Hispanic / Latino
Children Nativity (place of birth) in Pikesville
Children under 6 years - Living with two parents Both parents native 1,578 100.0% NativeBoth parents foreign-born 268 100.0% NativeOne native, one foreign-born parent 185 100.0% NativeChildren under 6 years - Living with one parent Native parent 182 100.0% NativeForeign-born parent 34 100.0% NativeChildren 6 to 17 years - Living with two parents Both parents native 3,598 100.0% NativeBoth parents foreign-born 340 75.1% Native113 24.9% Foreign-bornOne native, one foreign-born parent 542 100.0% NativeChildren 6 to 17 years - Living with one parent Native parent 965 100.0% NativeForeign-born parent 386 51.8% Native360 48.2% Foreign-born
Grandparents responsible for own grandchildren in Pikesville
Grandparents (30 to 59 years) White / Caucasian 5 53.3% Responsible for grandchildren4 46.7% Not responsible for grandchildrenBlack or African American 28 100.0% Not responsible for grandchildrenWhite alone, not Hispanic / Latino 5 54.1% Responsible for grandchildren4 45.9% Not responsible for grandchildrenGrandparents (60 years and over) White / Caucasian 10 11.1% Responsible for grandchildren82 88.9% Not responsible for grandchildrenBlack or African American 6 42.2% Responsible for grandchildren8 57.8% Not responsible for grandchildrenWhite alone, not Hispanic / Latino 10 10.8% Responsible for grandchildren86 89.2% Not responsible for grandchildren