Races in South Dona Ana, New Mexico (NM) Detailed Stats
Ancestries, Foreign-born residents, place of birth
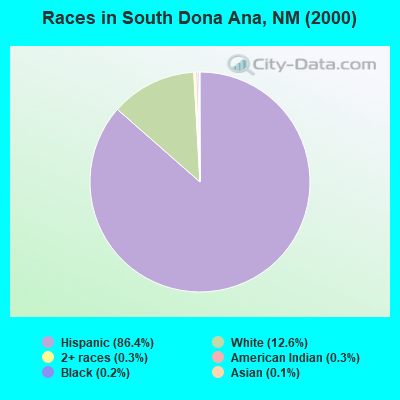
Race distribution in South Dona Ana

- 20,17786.4%Hispanic
- 2,94012.6%White alone
- 660.3%American Indian alone
- 750.3%Two or more races
- 560.2%Black alone
- 270.1%Asian alone
- 150.06%Other race alone
- 60.03%Native Hawaiian and Other
Pacific Islander alone
2000
2022
-
- 813,49544.7%White alone
- 765,38642.1%Hispanic
- 161,4608.9%American Indian alone
- 30,6541.7%Black alone
- 25,7931.4%Two or more races
- 18,2571.0%Asian alone
- 3,0090.2%Other race alone
- 9920.05%Native Hawaiian and Other
Pacific Islander alone

-
- 1,059,86750.2%Hispanic
- 735,47834.8%White alone
- 171,8088.1%American Indian alone
- 65,0843.1%Two or more races
- 36,8701.7%Black alone
- 35,8701.7%Asian alone
- 7,5820.4%Other race alone
- 7850.04%Native Hawaiian and Other
Pacific Islander alone

Income and house value in South Dona Ana
- Median household income in 2022
- $91,842White non-Hispanic householders
- $122,111Black householders
- $105,917American Indian and Alaska Native householders
- $35,297Some other race householders
- $76,097Two or more races householders
- $42,164Hispanic or Latino race householders
- Median 2022 house value
- $398,510White Non-Hispanic householders
- over $1,000,000Black or African American householders
- $439,992American Indian or Alaska Native householders
- $187,955Some other race householders
- $246,887Two or more races householders
- $183,664Hispanic or Latino householders
Household income for White non-Hispanic householders

Household income for Black householders

Household income for American Indian and Alaska Native householders

Household income for Two or more races householders

Household income for Hispanic or Latino race householders

Zip code: 88021