Races in South Valley, New Mexico (NM) Detailed Stats
Data:
Races - White alone (%)
Races - White alone (% change since 2000)
Races - Black alone (%)
Races - Black alone (% change since 2000)
Races - American Indian alone (%)
Races - American Indian alone (% change since 2000)
Races - Asian alone (%)
Races - Asian alone (% change since 2000)
Races - Hispanic (%)
Races - Hispanic (% change since 2000)
Races - Native Hawaiian and Other Pacific Islander alone (%)
Races - Native Hawaiian and Other Pacific Islander alone (% change since 2000)
Races - Two or more races(%)
Races - Two or more races(% change since 2000)
Races - Other race alone (%)
Races - Other race alone (% change since 2000)
Racial diversity
Place of birth - Born in state of residence (%)
Place of birth - Born in state of residence (%) - White
Place of birth - Born in state of residence (%) - Black or African American
Place of birth - Born in state of residence (%) - Asian
Place of birth - Born in state of residence (%) - Hispanic or Latino
Place of birth - Born in state of residence (%) - American Indian and Alaska Native
Place of birth - Born in state of residence (%) - Multirace
Place of birth - Born in state of residence (%) - Other Race
Place of birth - Born in other state (%)
Place of birth - Born in other state (%) - White
Place of birth - Born in other state (%) - Black or African American
Place of birth - Born in other state (%) - Asian
Place of birth - Born in other state (%) - Hispanic or Latino
Place of birth - Born in other state (%) - American Indian and Alaska Native
Place of birth - Born in other state (%) - Multirace
Place of birth - Born in other state (%) - Other Race
Place of birth - Native, outside of US (%)
Place of birth - Native, outside of US (%) - White
Place of birth - Native, outside of US (%) - Black or African American
Place of birth - Native, outside of US (%) - Asian
Place of birth - Native, outside of US (%) - Hispanic or Latino
Place of birth - Native, outside of US (%) - American Indian and Alaska Native
Place of birth - Native, outside of US (%) - Multirace
Place of birth - Native, outside of US (%) - Other Race
Place of birth - Foreign born (%)
Place of birth - Foreign born (%) - White
Place of birth - Foreign born (%) - Black or African American
Place of birth - Foreign born (%) - Asian
Place of birth - Foreign born (%) - Hispanic or Latino
Place of birth - Foreign born (%) - American Indian and Alaska Native
Place of birth - Foreign born (%) - Multirace
Place of birth - Foreign born (%) - Other Race
Residents speaking English at home (%)
Residents speaking English at home - Born in the United States (%)
Residents speaking English at home - Native, born elsewhere (%)
Residents speaking English at home - Foreign born (%)
Residents speaking Spanish at home (%)
Residents speaking Spanish at home - Born in the United States (%)
Residents speaking Spanish at home - Native, born elsewhere (%)
Residents speaking Spanish at home - Foreign born (%)
Residents speaking other language at home (%)
Residents speaking other language at home - Born in the United States (%)
Residents speaking other language at home - Native, born elsewhere (%)
Residents speaking other language at home - Foreign born (%)
Marital status - Never married (%)
Marital status - Now married (%)
Marital status - Separated (%)
Marital status - Widowed (%)
Marital status - Divorced (%)
Ancestries Reported - Arab (%)
Ancestries Reported - Czech (%)
Ancestries Reported - Danish (%)
Ancestries Reported - Dutch (%)
Ancestries Reported - English (%)
Ancestries Reported - French (%)
Ancestries Reported - French Canadian (%)
Ancestries Reported - German (%)
Ancestries Reported - Greek (%)
Ancestries Reported - Hungarian (%)
Ancestries Reported - Irish (%)
Ancestries Reported - Italian (%)
Ancestries Reported - Lithuanian (%)
Ancestries Reported - Norwegian (%)
Ancestries Reported - Polish (%)
Ancestries Reported - Portuguese (%)
Ancestries Reported - Russian (%)
Ancestries Reported - Scotch-Irish (%)
Ancestries Reported - Scottish (%)
Ancestries Reported - Slovak (%)
Ancestries Reported - Subsaharan African (%)
Ancestries Reported - Swedish (%)
Ancestries Reported - Swiss (%)
Ancestries Reported - Ukrainian (%)
Ancestries Reported - United States (%)
Ancestries Reported - Welsh (%)
Ancestries Reported - West Indian (%)
Ancestries Reported - Other (%)
Geographical mobility - Same house 1 year ago (%)
Geographical mobility - Same house 1 year ago (%) - White
Geographical mobility - Same house 1 year ago (%) - Black or African American
Geographical mobility - Same house 1 year ago (%) - Asian
Geographical mobility - Same house 1 year ago (%) - Hispanic or Latino
Geographical mobility - Same house 1 year ago (%) - American Indian and Alaska Native
Geographical mobility - Same house 1 year ago (%) - Multirace
Geographical mobility - Same house 1 year ago (%) - Other Race
Geographical mobility - Moved within same county (%)
Geographical mobility - Moved within same county (%) - White
Geographical mobility - Moved within same county (%) - Black or African American
Geographical mobility - Moved within same county (%) - Asian
Geographical mobility - Moved within same county (%) - Hispanic or Latino
Geographical mobility - Moved within same county (%) - American Indian and Alaska Native
Geographical mobility - Moved within same county (%) - Multirace
Geographical mobility - Moved within same county (%) - Other Race
Geographical mobility - Moved from different county within same state (%)
Geographical mobility - Moved from different county within same state (%) - White
Geographical mobility - Moved from different county within same state (%) - Black or African American
Geographical mobility - Moved from different county within same state (%) - Asian
Geographical mobility - Moved from different county within same state (%) - Hispanic or Latino
Geographical mobility - Moved from different county within same state (%) - American Indian and Alaska Native
Geographical mobility - Moved from different county within same state (%) - Multirace
Geographical mobility - Moved from different county within same state (%) - Other Race
Geographical mobility - Moved from different state (%)
Geographical mobility - Moved from different state (%) - White
Geographical mobility - Moved from different state (%) - Black or African American
Geographical mobility - Moved from different state (%) - Asian
Geographical mobility - Moved from different state (%) - Hispanic or Latino
Geographical mobility - Moved from different state (%) - American Indian and Alaska Native
Geographical mobility - Moved from different state (%) - Multirace
Geographical mobility - Moved from different state (%) - Other Race
Geographical mobility - Moved from abroad (%)
Geographical mobility - Moved from abroad (%) - White
Geographical mobility - Moved from abroad (%) - Black or African American
Geographical mobility - Moved from abroad (%) - Asian
Geographical mobility - Moved from abroad (%) - Hispanic or Latino
Geographical mobility - Moved from abroad (%) - American Indian and Alaska Native
Geographical mobility - Moved from abroad (%) - Multirace
Geographical mobility - Moved from abroad (%) - Other Race
Place of birth for the foreign-born population - Ireland (%)
Place of birth for the foreign-born population - Denmark (%)
Place of birth for the foreign-born population - Norway (%)
Place of birth for the foreign-born population - Sweden (%)
Place of birth for the foreign-born population - United Kingdom (%)
Place of birth for the foreign-born population - England (%)
Place of birth for the foreign-born population - Scotland (%)
Place of birth for the foreign-born population - Other Northern Europe (%)
Place of birth for the foreign-born population - Austria (%)
Place of birth for the foreign-born population - Belgium (%)
Place of birth for the foreign-born population - France (%)
Place of birth for the foreign-born population - Germany (%)
Place of birth for the foreign-born population - Netherlands (%)
Place of birth for the foreign-born population - Switzerland (%)
Place of birth for the foreign-born population - Other Western Europe (%)
Place of birth for the foreign-born population - Greece (%)
Place of birth for the foreign-born population - Italy (%)
Place of birth for the foreign-born population - Portugal (%)
Place of birth for the foreign-born population - Spain (%)
Place of birth for the foreign-born population - Other Southern Europe (%)
Place of birth for the foreign-born population - Albania (%)
Place of birth for the foreign-born population - Belarus (%)
Place of birth for the foreign-born population - Bosnia and Herzegovina (%)
Place of birth for the foreign-born population - Bulgaria (%)
Place of birth for the foreign-born population - Croatia (%)
Place of birth for the foreign-born population - Czechoslovakia (%)
Place of birth for the foreign-born population - Hungary (%)
Place of birth for the foreign-born population - Latvia (%)
Place of birth for the foreign-born population - Lithuania (%)
Place of birth for the foreign-born population - North Macedonia (Macedonia) (%)
Place of birth for the foreign-born population - Moldova (%)
Place of birth for the foreign-born population - Poland (%)
Place of birth for the foreign-born population - Romania (%)
Place of birth for the foreign-born population - Russia (%)
Place of birth for the foreign-born population - Serbia (%)
Place of birth for the foreign-born population - Ukraine (%)
Place of birth for the foreign-born population - Other Eastern Europe (%)
Place of birth for the foreign-born population - China (%)
Place of birth for the foreign-born population - Hong Kong (%)
Place of birth for the foreign-born population - Taiwan (%)
Place of birth for the foreign-born population - Japan (%)
Place of birth for the foreign-born population - Korea (%)
Place of birth for the foreign-born population - Other Eastern Asia (%)
Place of birth for the foreign-born population - Afghanistan (%)
Place of birth for the foreign-born population - Bangladesh (%)
Place of birth for the foreign-born population - India (%)
Place of birth for the foreign-born population - Iran (%)
Place of birth for the foreign-born population - Kazakhstan (%)
Place of birth for the foreign-born population - Nepal (%)
Place of birth for the foreign-born population - Pakistan (%)
Place of birth for the foreign-born population - Sri Lanka (%)
Place of birth for the foreign-born population - Uzbekistan (%)
Place of birth for the foreign-born population - Other South Central Asia (%)
Place of birth for the foreign-born population - Burma (%)
Place of birth for the foreign-born population - Cambodia (%)
Place of birth for the foreign-born population - Indonesia (%)
Place of birth for the foreign-born population - Laos (%)
Place of birth for the foreign-born population - Malaysia (%)
Place of birth for the foreign-born population - Philippines (%)
Place of birth for the foreign-born population - Singapore (%)
Place of birth for the foreign-born population - Thailand (%)
Place of birth for the foreign-born population - Vietnam (%)
Place of birth for the foreign-born population - Other South Eastern Asia (%)
Place of birth for the foreign-born population - Armenia (%)
Place of birth for the foreign-born population - Iraq (%)
Place of birth for the foreign-born population - Israel (%)
Place of birth for the foreign-born population - Jordan (%)
Place of birth for the foreign-born population - Kuwait (%)
Place of birth for the foreign-born population - Lebanon (%)
Place of birth for the foreign-born population - Saudi Arabia (%)
Place of birth for the foreign-born population - Syria (%)
Place of birth for the foreign-born population - Turkey (%)
Place of birth for the foreign-born population - Yemen (%)
Place of birth for the foreign-born population - Other Western Asia (%)
Place of birth for the foreign-born population - Eritrea (%)
Place of birth for the foreign-born population - Ethiopia (%)
Place of birth for the foreign-born population - Kenya (%)
Place of birth for the foreign-born population - Somalia (%)
Place of birth for the foreign-born population - Uganda (%)
Place of birth for the foreign-born population - Zimbabwe (%)
Place of birth for the foreign-born population - Other Eastern Africa (%)
Place of birth for the foreign-born population - Cameroon (%)
Place of birth for the foreign-born population - Congo (%)
Place of birth for the foreign-born population - Democratic Republic of Congo (Zaire) (%)
Place of birth for the foreign-born population - Other Middle Africa (%)
Place of birth for the foreign-born population - Egypt (%)
Place of birth for the foreign-born population - Morocco (%)
Place of birth for the foreign-born population - Sudan (%)
Place of birth for the foreign-born population - Other Northern Africa (%)
Place of birth for the foreign-born population - South Africa (%)
Place of birth for the foreign-born population - Other Southern Africa (%)
Place of birth for the foreign-born population - Cabo Verde (%)
Place of birth for the foreign-born population - Ghana (%)
Place of birth for the foreign-born population - Liberia (%)
Place of birth for the foreign-born population - Nigeria (%)
Place of birth for the foreign-born population - Senegal (%)
Place of birth for the foreign-born population - Sierra Leone (%)
Place of birth for the foreign-born population - Other Western Africa (%)
Place of birth for the foreign-born population - Australia (%)
Place of birth for the foreign-born population - New Zealand (%)
Place of birth for the foreign-born population - Fiji (%)
Place of birth for the foreign-born population - Micronesia (%)
Place of birth for the foreign-born population - Bahamas (%)
Place of birth for the foreign-born population - Barbados (%)
Place of birth for the foreign-born population - Cuba (%)
Place of birth for the foreign-born population - Dominica (%)
Place of birth for the foreign-born population - Dominican Republic (%)
Place of birth for the foreign-born population - Grenada (%)
Place of birth for the foreign-born population - Haiti (%)
Place of birth for the foreign-born population - Jamaica (%)
Place of birth for the foreign-born population - St. Vincent and the Grenadines (%)
Place of birth for the foreign-born population - Trinidad and Tobago (%)
Place of birth for the foreign-born population - West Indies (%)
Place of birth for the foreign-born population - Other Caribbean (%)
Place of birth for the foreign-born population - Belize (%)
Place of birth for the foreign-born population - Costa Rica (%)
Place of birth for the foreign-born population - El Salvador (%)
Place of birth for the foreign-born population - Guatemala (%)
Place of birth for the foreign-born population - Honduras (%)
Place of birth for the foreign-born population - Mexico (%)
Place of birth for the foreign-born population - Nicaragua (%)
Place of birth for the foreign-born population - Panama (%)
Place of birth for the foreign-born population - Other Central America (%)
Place of birth for the foreign-born population - Argentina (%)
Place of birth for the foreign-born population - Bolivia (%)
Place of birth for the foreign-born population - Brazil (%)
Place of birth for the foreign-born population - Chile (%)
Place of birth for the foreign-born population - Colombia (%)
Place of birth for the foreign-born population - Ecuador (%)
Place of birth for the foreign-born population - Guyana (%)
Place of birth for the foreign-born population - Peru (%)
Place of birth for the foreign-born population - Uruguay (%)
Place of birth for the foreign-born population - Venezuela (%)
Place of birth for the foreign-born population - Other South America (%)
Place of birth for the foreign-born population - Canada (%)
Place of birth for the foreign-born population - Other Northern America (%)
Place of birth for the foreign-born population - Other (%)
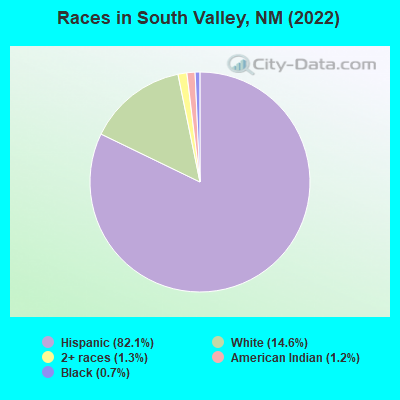
According to 2022 data, the most numerous races in South Valley, NM are Hispanic (30,779 residents), White alone (5,487 residents), and American Indian alone (454 residents). 51.9% of South Valley residents speak English at home. 15.0% of South Valley, NM residents are foreign-born (13.9% born in Latin America), which is 39.9% greater than the foreign-born rate of 9.0% across the entire state of New Mexico.
Race distribution in South Valley
2000 2022
813,495 44.7% White alone 765,386 42.1% Hispanic 161,460 8.9% American Indian alone 30,654 1.7% Black alone 25,793 1.4% Two or more races 18,257 1.0% Asian alone 3,009 0.2% Other race alone 992 0.05% Native Hawaiian and Other
1,059,867 50.2% Hispanic 735,478 34.8% White alone 171,808 8.1% American Indian alone 65,084 3.1% Two or more races 36,870 1.7% Black alone 35,870 1.7% Asian alone 7,582 0.4% Other race alone 785 0.04% Native Hawaiian and Other
Income and house value in South Valley Median household income in 2022 $57,579 White non-Hispanic householders$43,116 American Indian and Alaska Native householders$52,463 Some other race householders$45,010 Two or more races householders$45,822 Hispanic or Latino race householdersMedian 2022 house value $248,124 White Non-Hispanic householders$260,576 Black or African American householders$188,629 American Indian or Alaska Native householders$259,423 Native Hawaiian and other Pacific Islander householders$214,687 Some other race householders$198,545 Two or more races householders$215,148 Hispanic or Latino householders
Median age by race in South Valley
43.4 Median age for White residents41.8 44.8 33.8 Median age for Black or African American residents33.5 -580,580,580.0 33.8 Median age for American Indian / Alaska Native residents29.7 37.7 37.8 Median age for Asian residents-675,749,318.1 38.3 -773,737,373.0 Median age for Native Hawaiian / Pacific Islander residents-388,464,800.3 -785,276,072.8 38.5 Median age for Other race residents41.2 36.0 42.0 Median age for Two or more races residents42.3 41.1 54.5 Median age for White alone residents52.4 56.3 38.0 Median age for Hispanic or Latino residents38.4 37.8
Owner/renter occupied households by race in South Valley
House owners and renters - White residents 4,256 74.0% Owner occupied1,493 26.0% Renter occupiedHouse owners and renters - Black or African American residents 11 47.0% Owner occupied12 53.0% Renter occupiedHouse owners and renters - American Indian / Alaska Native residents 259 71.4% Owner occupied104 28.6% Renter occupiedHouse owners and renters - Asian residents 18 100.0% Owner occupiedHouse owners and renters - Other race residents 3,015 75.1% Owner occupied998 24.9% Renter occupiedHouse owners and renters - Two or more races residents 3,505 73.3% Owner occupied1,275 26.7% Renter occupiedHouse owners and renters - White alone residents 2,047 74.9% Owner occupied687 25.1% Renter occupiedHouse owners and renters - Hispanic or Latino residents 7,788 74.9% Owner occupied2,616 25.1% Renter occupied
Language usage in South Valley
English speakers - Total 51.9% of residents of South Valley speak English at home.
47.1% of residents speak Spanish at home 11,196 66.5% Speak English very well5,630 33.5% Speak English less than very well0.9% of residents speak other language at home 301 91.8% Speak English very well27 8.2% Speak English less than very well
English speakers - Born in the United States 71.1% of residents of South Valley speak English at home.
29.2% of residents speak Spanish at home 1,632 89.7% Speak English very well187 10.3% Speak English less than very well0.8% of residents speak other language at home 27 57.4% Speak English very well20 42.6% Speak English less than very well
English speakers - Native, born elsewhere 42.5% of residents of South Valley speak English at home.
53.0% of residents speak Spanish at home 226 91.5% Speak English very well21 8.5% Speak English less than very well
English speakers - Foreign-born 9.8% of residents of South Valley speak English at home.
89.1% of residents speak Spanish at home 1,249 26.2% Speak English very well3,524 73.8% Speak English less than very well3.0% of residents speak other language at home 159 100.0% Speak English very well
White (Caucasian) - Speak only English Native:
66.9% (8,769)Foreign-born:
15.5% (85)
White (Caucasian) - Speak another language Native:
22.4% (2,937)Foreign-born:
100.0% (547)
Black or African American - Speak only English Native:
100.0% (196)Foreign-born:
75.8% (53)
American Indian / Alaska Native - Speak another language Native:
31.5% (279)Foreign-born:
100.0% (188)
Asian - Speak only English Native:
100.0% (52)Foreign-born:
100.0% (27)
Other race - Speak only English Native:
49.3% (3,826)Foreign-born:
14.1% (446)
Other race - Speak another language Native:
51.4% (3,989)Foreign-born:
87.0% (2,746)
Two or more races - Speak only English Native:
53.2% (5,622)Foreign-born:
5.1% (125)
Two or more races - Speak another language Native:
48.7% (5,152)Foreign-born:
95.2% (2,331)
White alone - Speak only English Native:
97.1% (5,141)Foreign-born:
46.1% (53)
White alone - Speak another language Native:
3.0% (157)Foreign-born:
53.6% (62)
Hispanic or Latino - Speak only English Native:
49.2% (11,790)Foreign-born:
9.9% (512)
Hispanic or Latino - Speak another language Native:
50.7% (12,147)Foreign-born:
89.8% (4,641)
Foreign-born residents in South Valley 5,617 residents are foreign born (13.9% Latin America ).
This city:
15.0%New Mexico:
9.2%
Marital status for residents in South Valley Marital status - White (Caucasian) population 15 years and over
Males 42.0% Never married40.1% Now married0.5% Separated5.3% Widowed12.2% DivorcedFemales 35.6% Never married38.8% Now married1.1% Separated9.3% Widowed15.2% DivorcedWomen who gave birth in the past 12 months Now married:
29.6% (53)Unmarried:
70.4% (126)
Women who did not give birth in the past 12 months Now married:
30.5% (897)Unmarried:
69.5% (2,048)
Marital status - Black or African American population 15 years and over
Males 35.4% Never married60.6% Now married0.0% Separated4.0% Widowed0.0% DivorcedFemales 100.0% Never married0.0% Now married0.0% Separated0.0% Widowed0.0% DivorcedWomen who did not give birth in the past 12 months Now married:
0.0% (0)Unmarried:
100.0% (9)
Marital status - American Indian / Alaska Native population 15 years and over
Males 30.5% Never married67.1% Now married0.0% Separated0.0% Widowed2.3% DivorcedFemales 41.1% Never married43.7% Now married0.0% Separated5.6% Widowed9.6% DivorcedWomen who gave birth in the past 12 months Now married:
100.0% (12)Unmarried:
0.0% (0)
Women who did not give birth in the past 12 months Now married:
39.9% (119)Unmarried:
60.1% (179)
Marital status - Asian population 15 years and over
Males 59.3% Never married0.0% Now married0.0% Separated0.0% Widowed40.7% DivorcedFemales 43.2% Never married56.8% Now married0.0% Separated0.0% Widowed0.0% DivorcedWomen who did not give birth in the past 12 months Now married:
62.5% (26)Unmarried:
37.5% (16)
Marital status - Native Hawaiian / Pacific Islander population 15 years and over
Males 0.0% Never married100.0% Now married0.0% Separated0.0% Widowed0.0% DivorcedFemales 0.0% Never married100.0% Now married0.0% Separated0.0% Widowed0.0% DivorcedWomen who did not give birth in the past 12 months Now married:
100.0% (22)Unmarried:
0.0% (0)
Marital status - Other race population 15 years and over
Males 33.8% Never married41.9% Now married4.1% Separated5.2% Widowed15.0% DivorcedFemales 35.0% Never married39.9% Now married3.0% Separated10.0% Widowed12.2% DivorcedWomen who gave birth in the past 12 months Now married:
58.8% (60)Unmarried:
41.2% (42)
Women who did not give birth in the past 12 months Now married:
45.1% (1,121)Unmarried:
54.9% (1,363)
Marital status - Two or more races population 15 years and over
Males 39.1% Never married47.0% Now married0.7% Separated1.9% Widowed11.3% DivorcedFemales 29.4% Never married48.0% Now married2.8% Separated10.6% Widowed9.1% DivorcedWomen who gave birth in the past 12 months Now married:
42.4% (96)Unmarried:
57.6% (130)
Women who did not give birth in the past 12 months Now married:
46.6% (1,186)Unmarried:
53.4% (1,361)
Marital status - White alone, not Hispanic / Latino population 15 years and over
Males 38.6% Never married42.3% Now married0.3% Separated6.0% Widowed12.9% DivorcedFemales 28.3% Never married40.0% Now married0.8% Separated11.6% Widowed19.4% DivorcedWomen who gave birth in the past 12 months Now married:
100.0% (11)Unmarried:
0.0% (0)
Women who did not give birth in the past 12 months Now married:
30.0% (278)Unmarried:
70.0% (648)
Marital status - Hispanic or Latino population 15 years and over
Males 38.9% Never married43.1% Now married1.6% Separated3.8% Widowed12.6% DivorcedFemales 35.1% Never married41.9% Now married2.2% Separated9.3% Widowed11.4% DivorcedWomen who gave birth in the past 12 months Now married:
38.5% (178)Unmarried:
61.5% (285)
Women who did not give birth in the past 12 months Now married:
39.5% (2,525)Unmarried:
60.5% (3,863)
Ancestries in South Valley
877 3.7% American514 2.2% German329 1.4% English244 1.0% European148 0.6% Irish146 0.6% Italian75 0.3% Ukrainian58 0.2% Scotch-Irish43 0.2% Hungarian40 0.2% French Canadian38 0.2% Greek36 0.2% Northern European34 0.1% British34 0.1% Danish32 0.1% Scottish26 0.1% Lebanese20 0.08% Dutch17 0.07% French15 0.06% Egyptian13 0.05% Croatian13 0.05% Swedish12 0.05% Nigerian11 0.05% Jamaican10 0.04% Czech10 0.04% Polish7 0.03% Russian7 0.03% Scandinavian6 0.03% Eastern European2 0.01% Slavic
Geographical mobility in South Valley Same house 1 year ago 13,417 93.9% White (Caucasian)240 78.5% Black or African American1,069 100.0% American Indian / Alaska Native64 81.4% Asian28 100.0% Native Hawaiian / Pacific Islander10,987 97.0% Other race11,940 88.8% Two or more races5,027 91.8% White alone, not Hispanic / Latino28,620 94.2% Hispanic or LatinoMoved within same county 546 3.8% White / Caucasian58 18.8% Black or African American12 1.1% American Indian / Alaska Native8 10.4% Asian342 3.0% Other race664 4.9% Two or more races272 5.0% White alone, not Hispanic / Latino1,067 3.5% Hispanic or LatinoMoved within same state 98 0.7% White / Caucasian7 2.3% Black or African American11 1.0% American Indian / Alaska Native16 0.1% Other race52 0.4% Two or more races16 0.3% White alone, not Hispanic / Latino130 0.4% Hispanic or LatinoMoved from different state 238 1.7% White / Caucasian198 1.7% Other race397 3.0% Two or more races168 3.1% White alone, not Hispanic / Latino570 1.9% Hispanic or LatinoMoved from abroad 18 0.1% White353 2.6% Two or more races22 0.4% White alone, not Hispanic / Latino267 0.9% Hispanic or Latino
Children Nativity (place of birth) in South Valley
Children under 6 years - Living with two parents Both parents native 774 100.0% NativeBoth parents foreign-born 86 100.0% NativeOne native, one foreign-born parent 329 100.0% NativeChildren under 6 years - Living with one parent Native parent 659 100.0% NativeForeign-born parent 77 57.8% Native56 42.2% Foreign-bornChildren 6 to 17 years - Living with two parents Both parents native 1,212 100.0% NativeBoth parents foreign-born 873 99.3% Native6 0.7% Foreign-bornOne native, one foreign-born parent 643 93.8% Native43 6.2% Foreign-bornChildren 6 to 17 years - Living with one parent Native parent 2,271 100.0% NativeForeign-born parent 662 48.5% Native702 51.5% Foreign-born
Grandparents responsible for own grandchildren in South Valley
Grandparents (30 to 59 years) White / Caucasian 60 44.4% Responsible for grandchildren75 55.6% Not responsible for grandchildrenAsian 4 100.0% Responsible for grandchildrenNative Hawaiian / Pacific Islander 5 100.0% Not responsible for grandchildrenOther race 308 78.0% Responsible for grandchildren87 22.0% Not responsible for grandchildrenTwo or more races 75 89.3% Responsible for grandchildren9 10.7% Not responsible for grandchildrenWhite alone, not Hispanic / Latino 41 100.0% Not responsible for grandchildrenHispanic or Latino 315 73.5% Responsible for grandchildren114 26.5% Not responsible for grandchildrenGrandparents (60 years and over) White / Caucasian 121 55.7% Responsible for grandchildren96 44.3% Not responsible for grandchildrenOther race 26 75.0% Responsible for grandchildren9 25.0% Not responsible for grandchildrenTwo or more races 130 45.9% Responsible for grandchildren153 54.1% Not responsible for grandchildrenWhite alone, not Hispanic / Latino 34 40.6% Responsible for grandchildren50 59.4% Not responsible for grandchildrenHispanic or Latino 219 58.6% Responsible for grandchildren155 41.4% Not responsible for grandchildren