Races in Texarkana, Texas (TX) Detailed Stats
Data:
Races - White alone (%)
Races - White alone (% change since 2000)
Races - Black alone (%)
Races - Black alone (% change since 2000)
Races - American Indian alone (%)
Races - American Indian alone (% change since 2000)
Races - Asian alone (%)
Races - Asian alone (% change since 2000)
Races - Hispanic (%)
Races - Hispanic (% change since 2000)
Races - Native Hawaiian and Other Pacific Islander alone (%)
Races - Native Hawaiian and Other Pacific Islander alone (% change since 2000)
Races - Two or more races(%)
Races - Two or more races(% change since 2000)
Races - Other race alone (%)
Races - Other race alone (% change since 2000)
Racial diversity
Place of birth - Born in state of residence (%)
Place of birth - Born in state of residence (%) - White
Place of birth - Born in state of residence (%) - Black or African American
Place of birth - Born in state of residence (%) - Asian
Place of birth - Born in state of residence (%) - Hispanic or Latino
Place of birth - Born in state of residence (%) - American Indian and Alaska Native
Place of birth - Born in state of residence (%) - Multirace
Place of birth - Born in state of residence (%) - Other Race
Place of birth - Born in other state (%)
Place of birth - Born in other state (%) - White
Place of birth - Born in other state (%) - Black or African American
Place of birth - Born in other state (%) - Asian
Place of birth - Born in other state (%) - Hispanic or Latino
Place of birth - Born in other state (%) - American Indian and Alaska Native
Place of birth - Born in other state (%) - Multirace
Place of birth - Born in other state (%) - Other Race
Place of birth - Native, outside of US (%)
Place of birth - Native, outside of US (%) - White
Place of birth - Native, outside of US (%) - Black or African American
Place of birth - Native, outside of US (%) - Asian
Place of birth - Native, outside of US (%) - Hispanic or Latino
Place of birth - Native, outside of US (%) - American Indian and Alaska Native
Place of birth - Native, outside of US (%) - Multirace
Place of birth - Native, outside of US (%) - Other Race
Place of birth - Foreign born (%)
Place of birth - Foreign born (%) - White
Place of birth - Foreign born (%) - Black or African American
Place of birth - Foreign born (%) - Asian
Place of birth - Foreign born (%) - Hispanic or Latino
Place of birth - Foreign born (%) - American Indian and Alaska Native
Place of birth - Foreign born (%) - Multirace
Place of birth - Foreign born (%) - Other Race
Residents speaking English at home (%)
Residents speaking English at home - Born in the United States (%)
Residents speaking English at home - Native, born elsewhere (%)
Residents speaking English at home - Foreign born (%)
Residents speaking Spanish at home (%)
Residents speaking Spanish at home - Born in the United States (%)
Residents speaking Spanish at home - Native, born elsewhere (%)
Residents speaking Spanish at home - Foreign born (%)
Residents speaking other language at home (%)
Residents speaking other language at home - Born in the United States (%)
Residents speaking other language at home - Native, born elsewhere (%)
Residents speaking other language at home - Foreign born (%)
Marital status - Never married (%)
Marital status - Now married (%)
Marital status - Separated (%)
Marital status - Widowed (%)
Marital status - Divorced (%)
Ancestries Reported - Arab (%)
Ancestries Reported - Czech (%)
Ancestries Reported - Danish (%)
Ancestries Reported - Dutch (%)
Ancestries Reported - English (%)
Ancestries Reported - French (%)
Ancestries Reported - French Canadian (%)
Ancestries Reported - German (%)
Ancestries Reported - Greek (%)
Ancestries Reported - Hungarian (%)
Ancestries Reported - Irish (%)
Ancestries Reported - Italian (%)
Ancestries Reported - Lithuanian (%)
Ancestries Reported - Norwegian (%)
Ancestries Reported - Polish (%)
Ancestries Reported - Portuguese (%)
Ancestries Reported - Russian (%)
Ancestries Reported - Scotch-Irish (%)
Ancestries Reported - Scottish (%)
Ancestries Reported - Slovak (%)
Ancestries Reported - Subsaharan African (%)
Ancestries Reported - Swedish (%)
Ancestries Reported - Swiss (%)
Ancestries Reported - Ukrainian (%)
Ancestries Reported - United States (%)
Ancestries Reported - Welsh (%)
Ancestries Reported - West Indian (%)
Ancestries Reported - Other (%)
Geographical mobility - Same house 1 year ago (%)
Geographical mobility - Same house 1 year ago (%) - White
Geographical mobility - Same house 1 year ago (%) - Black or African American
Geographical mobility - Same house 1 year ago (%) - Asian
Geographical mobility - Same house 1 year ago (%) - Hispanic or Latino
Geographical mobility - Same house 1 year ago (%) - American Indian and Alaska Native
Geographical mobility - Same house 1 year ago (%) - Multirace
Geographical mobility - Same house 1 year ago (%) - Other Race
Geographical mobility - Moved within same county (%)
Geographical mobility - Moved within same county (%) - White
Geographical mobility - Moved within same county (%) - Black or African American
Geographical mobility - Moved within same county (%) - Asian
Geographical mobility - Moved within same county (%) - Hispanic or Latino
Geographical mobility - Moved within same county (%) - American Indian and Alaska Native
Geographical mobility - Moved within same county (%) - Multirace
Geographical mobility - Moved within same county (%) - Other Race
Geographical mobility - Moved from different county within same state (%)
Geographical mobility - Moved from different county within same state (%) - White
Geographical mobility - Moved from different county within same state (%) - Black or African American
Geographical mobility - Moved from different county within same state (%) - Asian
Geographical mobility - Moved from different county within same state (%) - Hispanic or Latino
Geographical mobility - Moved from different county within same state (%) - American Indian and Alaska Native
Geographical mobility - Moved from different county within same state (%) - Multirace
Geographical mobility - Moved from different county within same state (%) - Other Race
Geographical mobility - Moved from different state (%)
Geographical mobility - Moved from different state (%) - White
Geographical mobility - Moved from different state (%) - Black or African American
Geographical mobility - Moved from different state (%) - Asian
Geographical mobility - Moved from different state (%) - Hispanic or Latino
Geographical mobility - Moved from different state (%) - American Indian and Alaska Native
Geographical mobility - Moved from different state (%) - Multirace
Geographical mobility - Moved from different state (%) - Other Race
Geographical mobility - Moved from abroad (%)
Geographical mobility - Moved from abroad (%) - White
Geographical mobility - Moved from abroad (%) - Black or African American
Geographical mobility - Moved from abroad (%) - Asian
Geographical mobility - Moved from abroad (%) - Hispanic or Latino
Geographical mobility - Moved from abroad (%) - American Indian and Alaska Native
Geographical mobility - Moved from abroad (%) - Multirace
Geographical mobility - Moved from abroad (%) - Other Race
Place of birth for the foreign-born population - Ireland (%)
Place of birth for the foreign-born population - Denmark (%)
Place of birth for the foreign-born population - Norway (%)
Place of birth for the foreign-born population - Sweden (%)
Place of birth for the foreign-born population - United Kingdom (%)
Place of birth for the foreign-born population - England (%)
Place of birth for the foreign-born population - Scotland (%)
Place of birth for the foreign-born population - Other Northern Europe (%)
Place of birth for the foreign-born population - Austria (%)
Place of birth for the foreign-born population - Belgium (%)
Place of birth for the foreign-born population - France (%)
Place of birth for the foreign-born population - Germany (%)
Place of birth for the foreign-born population - Netherlands (%)
Place of birth for the foreign-born population - Switzerland (%)
Place of birth for the foreign-born population - Other Western Europe (%)
Place of birth for the foreign-born population - Greece (%)
Place of birth for the foreign-born population - Italy (%)
Place of birth for the foreign-born population - Portugal (%)
Place of birth for the foreign-born population - Spain (%)
Place of birth for the foreign-born population - Other Southern Europe (%)
Place of birth for the foreign-born population - Albania (%)
Place of birth for the foreign-born population - Belarus (%)
Place of birth for the foreign-born population - Bosnia and Herzegovina (%)
Place of birth for the foreign-born population - Bulgaria (%)
Place of birth for the foreign-born population - Croatia (%)
Place of birth for the foreign-born population - Czechoslovakia (%)
Place of birth for the foreign-born population - Hungary (%)
Place of birth for the foreign-born population - Latvia (%)
Place of birth for the foreign-born population - Lithuania (%)
Place of birth for the foreign-born population - North Macedonia (Macedonia) (%)
Place of birth for the foreign-born population - Moldova (%)
Place of birth for the foreign-born population - Poland (%)
Place of birth for the foreign-born population - Romania (%)
Place of birth for the foreign-born population - Russia (%)
Place of birth for the foreign-born population - Serbia (%)
Place of birth for the foreign-born population - Ukraine (%)
Place of birth for the foreign-born population - Other Eastern Europe (%)
Place of birth for the foreign-born population - China (%)
Place of birth for the foreign-born population - Hong Kong (%)
Place of birth for the foreign-born population - Taiwan (%)
Place of birth for the foreign-born population - Japan (%)
Place of birth for the foreign-born population - Korea (%)
Place of birth for the foreign-born population - Other Eastern Asia (%)
Place of birth for the foreign-born population - Afghanistan (%)
Place of birth for the foreign-born population - Bangladesh (%)
Place of birth for the foreign-born population - India (%)
Place of birth for the foreign-born population - Iran (%)
Place of birth for the foreign-born population - Kazakhstan (%)
Place of birth for the foreign-born population - Nepal (%)
Place of birth for the foreign-born population - Pakistan (%)
Place of birth for the foreign-born population - Sri Lanka (%)
Place of birth for the foreign-born population - Uzbekistan (%)
Place of birth for the foreign-born population - Other South Central Asia (%)
Place of birth for the foreign-born population - Burma (%)
Place of birth for the foreign-born population - Cambodia (%)
Place of birth for the foreign-born population - Indonesia (%)
Place of birth for the foreign-born population - Laos (%)
Place of birth for the foreign-born population - Malaysia (%)
Place of birth for the foreign-born population - Philippines (%)
Place of birth for the foreign-born population - Singapore (%)
Place of birth for the foreign-born population - Thailand (%)
Place of birth for the foreign-born population - Vietnam (%)
Place of birth for the foreign-born population - Other South Eastern Asia (%)
Place of birth for the foreign-born population - Armenia (%)
Place of birth for the foreign-born population - Iraq (%)
Place of birth for the foreign-born population - Israel (%)
Place of birth for the foreign-born population - Jordan (%)
Place of birth for the foreign-born population - Kuwait (%)
Place of birth for the foreign-born population - Lebanon (%)
Place of birth for the foreign-born population - Saudi Arabia (%)
Place of birth for the foreign-born population - Syria (%)
Place of birth for the foreign-born population - Turkey (%)
Place of birth for the foreign-born population - Yemen (%)
Place of birth for the foreign-born population - Other Western Asia (%)
Place of birth for the foreign-born population - Eritrea (%)
Place of birth for the foreign-born population - Ethiopia (%)
Place of birth for the foreign-born population - Kenya (%)
Place of birth for the foreign-born population - Somalia (%)
Place of birth for the foreign-born population - Uganda (%)
Place of birth for the foreign-born population - Zimbabwe (%)
Place of birth for the foreign-born population - Other Eastern Africa (%)
Place of birth for the foreign-born population - Cameroon (%)
Place of birth for the foreign-born population - Congo (%)
Place of birth for the foreign-born population - Democratic Republic of Congo (Zaire) (%)
Place of birth for the foreign-born population - Other Middle Africa (%)
Place of birth for the foreign-born population - Egypt (%)
Place of birth for the foreign-born population - Morocco (%)
Place of birth for the foreign-born population - Sudan (%)
Place of birth for the foreign-born population - Other Northern Africa (%)
Place of birth for the foreign-born population - South Africa (%)
Place of birth for the foreign-born population - Other Southern Africa (%)
Place of birth for the foreign-born population - Cabo Verde (%)
Place of birth for the foreign-born population - Ghana (%)
Place of birth for the foreign-born population - Liberia (%)
Place of birth for the foreign-born population - Nigeria (%)
Place of birth for the foreign-born population - Senegal (%)
Place of birth for the foreign-born population - Sierra Leone (%)
Place of birth for the foreign-born population - Other Western Africa (%)
Place of birth for the foreign-born population - Australia (%)
Place of birth for the foreign-born population - New Zealand (%)
Place of birth for the foreign-born population - Fiji (%)
Place of birth for the foreign-born population - Micronesia (%)
Place of birth for the foreign-born population - Bahamas (%)
Place of birth for the foreign-born population - Barbados (%)
Place of birth for the foreign-born population - Cuba (%)
Place of birth for the foreign-born population - Dominica (%)
Place of birth for the foreign-born population - Dominican Republic (%)
Place of birth for the foreign-born population - Grenada (%)
Place of birth for the foreign-born population - Haiti (%)
Place of birth for the foreign-born population - Jamaica (%)
Place of birth for the foreign-born population - St. Vincent and the Grenadines (%)
Place of birth for the foreign-born population - Trinidad and Tobago (%)
Place of birth for the foreign-born population - West Indies (%)
Place of birth for the foreign-born population - Other Caribbean (%)
Place of birth for the foreign-born population - Belize (%)
Place of birth for the foreign-born population - Costa Rica (%)
Place of birth for the foreign-born population - El Salvador (%)
Place of birth for the foreign-born population - Guatemala (%)
Place of birth for the foreign-born population - Honduras (%)
Place of birth for the foreign-born population - Mexico (%)
Place of birth for the foreign-born population - Nicaragua (%)
Place of birth for the foreign-born population - Panama (%)
Place of birth for the foreign-born population - Other Central America (%)
Place of birth for the foreign-born population - Argentina (%)
Place of birth for the foreign-born population - Bolivia (%)
Place of birth for the foreign-born population - Brazil (%)
Place of birth for the foreign-born population - Chile (%)
Place of birth for the foreign-born population - Colombia (%)
Place of birth for the foreign-born population - Ecuador (%)
Place of birth for the foreign-born population - Guyana (%)
Place of birth for the foreign-born population - Peru (%)
Place of birth for the foreign-born population - Uruguay (%)
Place of birth for the foreign-born population - Venezuela (%)
Place of birth for the foreign-born population - Other South America (%)
Place of birth for the foreign-born population - Canada (%)
Place of birth for the foreign-born population - Other Northern America (%)
Place of birth for the foreign-born population - Other (%)
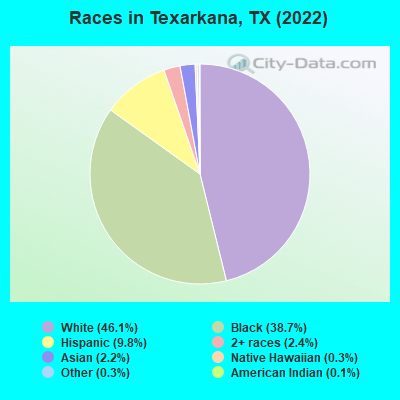
According to 2022 data, the most numerous races in Texarkana, TX are Hispanic (3,528 residents), White alone (16,540 residents), and Black alone (13,900 residents). 91.0% of Texarkana residents speak English at home. 5.4% of Texarkana, TX residents are foreign-born (2.8% born in Latin America, 1.7% born in Asia), which is 214.7% less than the foreign-born rate of 17.0% across the entire state of Texas.
Race distribution in Texarkana
2000 2022
10,933,313 52.4% White alone 6,669,666 32.0% Hispanic 2,364,255 11.3% Black alone 554,445 2.7% Asian alone 230,567 1.1% Two or more races 68,859 0.3% American Indian alone 19,958 0.10% Other race alone 10,757 0.05% Native Hawaiian and Other
12,070,642 40.2% Hispanic 11,683,430 38.9% White alone 3,508,706 11.7% Black alone 1,608,173 5.4% Asian alone 956,560 3.2% Two or more races 125,763 0.4% Other race alone 47,023 0.2% American Indian alone 29,275 0.10% Native Hawaiian and Other
Income and house value in Texarkana Median household income in 2022 $53,687 White non-Hispanic householders$28,819 Black householders$79,874 American Indian and Alaska Native householders$69,745 Asian householders$64,277 Two or more races householders$51,172 Hispanic or Latino race householdersMedian 2022 house value $217,827 White Non-Hispanic householders$104,364 Black or African American householders$156,403 American Indian or Alaska Native householders $391,009 Asian householders$260,767 Some other race householders$52,892 Two or more races householders$121,994 Hispanic or Latino householders
Median age by race in Texarkana
45.8 Median age for White residents42.9 47.3 33.4 Median age for Black or African American residents32.1 31.0 65.1 Median age for American Indian / Alaska Native residents76.7 -767,001,114.1 65.4 Median age for Asian residents69.5 61.3 30.5 Median age for Native Hawaiian / Pacific Islander residents-612,729,233.5 -577,777,777.2 18.5 Median age for Other race residents17.8 21.0 25.9 Median age for Two or more races residents22.3 47.6 46.2 Median age for White alone residents45.6 49.9 26.2 Median age for Hispanic or Latino residents32.4 23.5
Owner/renter occupied households by race in Texarkana
House owners and renters - White residents 5,040 64.6% Owner occupied2,760 35.4% Renter occupiedHouse owners and renters - Black or African American residents 1,672 29.2% Owner occupied4,046 70.8% Renter occupiedHouse owners and renters - American Indian / Alaska Native residents 74 100.0% Owner occupiedHouse owners and renters - Asian residents 140 60.0% Owner occupied93 40.0% Renter occupiedHouse owners and renters - Other race residents 155 51.3% Owner occupied147 48.7% Renter occupiedHouse owners and renters - Two or more races residents 150 43.5% Owner occupied196 56.5% Renter occupiedHouse owners and renters - White alone residents 4,805 64.2% Owner occupied2,685 35.8% Renter occupiedHouse owners and renters - Hispanic or Latino residents 483 45.0% Owner occupied591 55.0% Renter occupied
Language usage in Texarkana
English speakers - Total 91.0% of residents of Texarkana speak English at home.
6.9% of residents speak Spanish at home 1,207 52.2% Speak English very well1,105 47.8% Speak English less than very well2.5% of residents speak other language at home 597 72.4% Speak English very well228 27.6% Speak English less than very well
English speakers - Born in the United States 97.8% of residents of Texarkana speak English at home.
1.4% of residents speak Spanish at home 70 38.9% Speak English very well110 61.1% Speak English less than very well0.5% of residents speak other language at home 69 100.0% Speak English very well
English speakers - Native, born elsewhere 41.7% of residents of Texarkana speak English at home.
97.6% of residents speak Spanish at home 122 60.7% Speak English very well79 39.3% Speak English less than very well
English speakers - Foreign-born 18.9% of residents of Texarkana speak English at home.
49.0% of residents speak Spanish at home 214 25.0% Speak English very well641 75.0% Speak English less than very well29.0% of residents speak other language at home 283 55.9% Speak English very well223 44.1% Speak English less than very well
White (Caucasian) - Speak only English Native:
97.0% (15,820)Foreign-born:
53.8% (321)
White (Caucasian) - Speak another language Native:
3.1% (506)Foreign-born:
46.0% (275)
Black or African American - Speak only English Native:
99.6% (12,946)Foreign-born:
51.6% (34)
Black or African American - Speak another language Native:
0.4% (57)Foreign-born:
45.3% (30)
Asian - Speak only English Native:
59.0% (106)Foreign-born:
26.2% (166)
Asian - Speak another language Native:
41.2% (74)Foreign-born:
74.3% (471)
Other race - Speak another language Native:
60.5% (1,084)Foreign-born:
99.5% (134)
Two or more races - Speak another language Native:
16.9% (280)Foreign-born:
100.0% (86)
White alone - Speak only English Native:
99.1% (15,876)Foreign-born:
47.0% (87)
White alone - Speak another language Native:
1.1% (170)Foreign-born:
53.0% (98)
Hispanic or Latino - Speak only English Native:
48.8% (1,080)Foreign-born:
13.0% (138)
Hispanic or Latino - Speak another language Native:
49.3% (1,090)Foreign-born:
85.6% (911)
Foreign-born residents in Texarkana 1,938 residents are foreign born (2.8% Latin America , 1.7% Asia ).
This city:
5.4%Texas:
17.1%
Marital status for residents in Texarkana Marital status - White (Caucasian) population 15 years and over
Males 33.4% Never married47.4% Now married2.4% Separated4.9% Widowed11.9% DivorcedFemales 19.8% Never married49.3% Now married1.8% Separated13.3% Widowed15.8% DivorcedWomen who gave birth in the past 12 months Now married:
26.4% (69)Unmarried:
73.6% (191)
Women who did not give birth in the past 12 months Now married:
55.2% (1,716)Unmarried:
44.8% (1,394)
Marital status - Black or African American population 15 years and over
Males 53.7% Never married28.7% Now married4.5% Separated2.5% Widowed10.6% DivorcedFemales 50.5% Never married23.5% Now married4.4% Separated7.4% Widowed14.1% DivorcedWomen who gave birth in the past 12 months Now married:
22.8% (38)Unmarried:
77.2% (130)
Women who did not give birth in the past 12 months Now married:
25.5% (788)Unmarried:
74.5% (2,304)
Marital status - American Indian / Alaska Native population 15 years and over
Males 16.7% Never married83.3% Now married0.0% Separated0.0% Widowed0.0% DivorcedFemales 0.0% Never married0.0% Now married0.0% Separated50.0% Widowed50.0% DivorcedMarital status - Asian population 15 years and over
Males 16.7% Never married72.7% Now married0.0% Separated0.0% Widowed10.6% DivorcedFemales 32.3% Never married61.4% Now married0.0% Separated6.3% Widowed0.0% DivorcedWomen who did not give birth in the past 12 months Now married:
53.2% (151)Unmarried:
46.8% (132)
Marital status - Native Hawaiian / Pacific Islander population 15 years and over
Males 0.0% Never married100.0% Now married0.0% Separated0.0% Widowed0.0% DivorcedFemales 100.0% Never married0.0% Now married0.0% Separated0.0% Widowed0.0% DivorcedWomen who did not give birth in the past 12 months Now married:
0.0% (0)Unmarried:
100.0% (29)
Marital status - Other race population 15 years and over
Males 61.4% Never married35.1% Now married2.9% Separated0.6% Widowed0.0% DivorcedFemales 20.8% Never married54.8% Now married5.6% Separated0.0% Widowed18.8% DivorcedWomen who gave birth in the past 12 months Now married:
100.0% (11)Unmarried:
0.0% (0)
Women who did not give birth in the past 12 months Now married:
62.7% (187)Unmarried:
37.3% (111)
Marital status - Two or more races population 15 years and over
Males 57.6% Never married27.3% Now married0.6% Separated3.8% Widowed10.7% DivorcedFemales 43.8% Never married26.0% Now married0.0% Separated0.6% Widowed29.6% DivorcedWomen who did not give birth in the past 12 months Now married:
19.6% (82)Unmarried:
80.4% (334)
Marital status - White alone, not Hispanic / Latino population 15 years and over
Males 32.3% Never married47.3% Now married2.1% Separated5.4% Widowed13.0% DivorcedFemales 17.5% Never married49.6% Now married1.8% Separated14.1% Widowed17.0% DivorcedWomen who gave birth in the past 12 months Now married:
27.2% (72)Unmarried:
72.8% (193)
Women who did not give birth in the past 12 months Now married:
57.5% (1,618)Unmarried:
42.5% (1,197)
Marital status - Hispanic or Latino population 15 years and over
Males 48.8% Never married42.2% Now married3.8% Separated1.5% Widowed3.7% DivorcedFemales 39.9% Never married45.2% Now married2.6% Separated2.0% Widowed10.4% DivorcedWomen who gave birth in the past 12 months Now married:
50.0% (8)Unmarried:
50.0% (8)
Women who did not give birth in the past 12 months Now married:
44.5% (351)Unmarried:
55.5% (438)
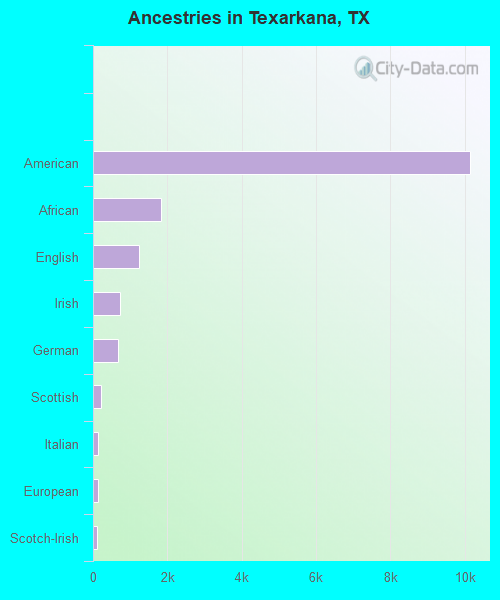
Ancestries in Texarkana
10,151 39.2% American1,835 7.1% African1,237 4.8% English723 2.8% Irish660 2.5% German209 0.8% Scottish138 0.5% Italian122 0.5% European111 0.4% Scotch-Irish70 0.3% French60 0.2% Norwegian57 0.2% Lithuanian31 0.1% French Canadian30 0.1% Welsh29 0.1% Scandinavian22 0.08% Iranian20 0.08% Czech20 0.08% Yugoslavian18 0.07% Egyptian16 0.06% Ukrainian13 0.05% Swedish11 0.04% British
Geographical mobility in Texarkana Same house 1 year ago 15,394 86.3% White (Caucasian)11,413 85.2% Black or African American102 100.0% American Indian / Alaska Native789 86.4% Asian108 98.2% Native Hawaiian / Pacific Islander1,296 90.3% Other race1,699 82.2% Two or more races14,178 86.3% White alone, not Hispanic / Latino3,172 91.1% Hispanic or LatinoMoved within same county 1,115 6.2% White / Caucasian597 4.5% Black or African American55 3.8% Other race90 4.4% Two or more races1,102 6.7% White alone, not Hispanic / Latino103 3.0% Hispanic or LatinoMoved within same state 584 3.3% White / Caucasian221 1.6% Black or African American128 14.1% Asian80 5.6% Other race222 10.7% Two or more races586 3.6% White alone, not Hispanic / Latino162 4.7% Hispanic or LatinoMoved from different state 669 3.8% White / Caucasian460 3.4% Black or African American23 1.1% Two or more races543 3.3% White alone, not Hispanic / Latino41 1.2% Hispanic or LatinoMoved from abroad 49 0.3% White17 0.8% Two or more races49 0.3% White alone, not Hispanic / Latino10 0.3% Hispanic or Latino
Children Nativity (place of birth) in Texarkana
Children under 6 years - Living with two parents Both parents native 996 100.0% NativeBoth parents foreign-born 231 83.0% Native47 17.0% Foreign-bornOne native, one foreign-born parent 105 100.0% NativeChildren under 6 years - Living with one parent Native parent 1,371 100.0% NativeChildren 6 to 17 years - Living with two parents Both parents native 2,603 100.0% Native1 0.0% Foreign-bornBoth parents foreign-born 300 72.5% Native114 27.5% Foreign-bornOne native, one foreign-born parent 166 100.0% NativeChildren 6 to 17 years - Living with one parent Native parent 2,298 100.0% NativeForeign-born parent 110 50.5% Native108 49.5% Foreign-born
Grandparents responsible for own grandchildren in Texarkana
Grandparents (30 to 59 years) White / Caucasian 37 13.4% Responsible for grandchildren241 86.6% Not responsible for grandchildrenBlack or African American 92 79.1% Responsible for grandchildren24 20.9% Not responsible for grandchildrenTwo or more races 49 72.9% Responsible for grandchildren18 27.1% Not responsible for grandchildrenWhite alone, not Hispanic / Latino 49 19.7% Responsible for grandchildren200 80.3% Not responsible for grandchildrenGrandparents (60 years and over) White / Caucasian 67 56.9% Responsible for grandchildren51 43.1% Not responsible for grandchildrenBlack or African American 15 51.3% Responsible for grandchildren14 48.7% Not responsible for grandchildrenTwo or more races 6 100.0% Not responsible for grandchildrenWhite alone, not Hispanic / Latino 69 49.5% Responsible for grandchildren70 50.5% Not responsible for grandchildren