Races in Tuckahoe, Virginia (VA) Detailed Stats
Data:
Races - White alone (%)
Races - White alone (% change since 2000)
Races - Black alone (%)
Races - Black alone (% change since 2000)
Races - American Indian alone (%)
Races - American Indian alone (% change since 2000)
Races - Asian alone (%)
Races - Asian alone (% change since 2000)
Races - Hispanic (%)
Races - Hispanic (% change since 2000)
Races - Native Hawaiian and Other Pacific Islander alone (%)
Races - Native Hawaiian and Other Pacific Islander alone (% change since 2000)
Races - Two or more races(%)
Races - Two or more races(% change since 2000)
Races - Other race alone (%)
Races - Other race alone (% change since 2000)
Racial diversity
Place of birth - Born in state of residence (%)
Place of birth - Born in state of residence (%) - White
Place of birth - Born in state of residence (%) - Black or African American
Place of birth - Born in state of residence (%) - Asian
Place of birth - Born in state of residence (%) - Hispanic or Latino
Place of birth - Born in state of residence (%) - American Indian and Alaska Native
Place of birth - Born in state of residence (%) - Multirace
Place of birth - Born in state of residence (%) - Other Race
Place of birth - Born in other state (%)
Place of birth - Born in other state (%) - White
Place of birth - Born in other state (%) - Black or African American
Place of birth - Born in other state (%) - Asian
Place of birth - Born in other state (%) - Hispanic or Latino
Place of birth - Born in other state (%) - American Indian and Alaska Native
Place of birth - Born in other state (%) - Multirace
Place of birth - Born in other state (%) - Other Race
Place of birth - Native, outside of US (%)
Place of birth - Native, outside of US (%) - White
Place of birth - Native, outside of US (%) - Black or African American
Place of birth - Native, outside of US (%) - Asian
Place of birth - Native, outside of US (%) - Hispanic or Latino
Place of birth - Native, outside of US (%) - American Indian and Alaska Native
Place of birth - Native, outside of US (%) - Multirace
Place of birth - Native, outside of US (%) - Other Race
Place of birth - Foreign born (%)
Place of birth - Foreign born (%) - White
Place of birth - Foreign born (%) - Black or African American
Place of birth - Foreign born (%) - Asian
Place of birth - Foreign born (%) - Hispanic or Latino
Place of birth - Foreign born (%) - American Indian and Alaska Native
Place of birth - Foreign born (%) - Multirace
Place of birth - Foreign born (%) - Other Race
Residents speaking English at home (%)
Residents speaking English at home - Born in the United States (%)
Residents speaking English at home - Native, born elsewhere (%)
Residents speaking English at home - Foreign born (%)
Residents speaking Spanish at home (%)
Residents speaking Spanish at home - Born in the United States (%)
Residents speaking Spanish at home - Native, born elsewhere (%)
Residents speaking Spanish at home - Foreign born (%)
Residents speaking other language at home (%)
Residents speaking other language at home - Born in the United States (%)
Residents speaking other language at home - Native, born elsewhere (%)
Residents speaking other language at home - Foreign born (%)
Marital status - Never married (%)
Marital status - Now married (%)
Marital status - Separated (%)
Marital status - Widowed (%)
Marital status - Divorced (%)
Ancestries Reported - Arab (%)
Ancestries Reported - Czech (%)
Ancestries Reported - Danish (%)
Ancestries Reported - Dutch (%)
Ancestries Reported - English (%)
Ancestries Reported - French (%)
Ancestries Reported - French Canadian (%)
Ancestries Reported - German (%)
Ancestries Reported - Greek (%)
Ancestries Reported - Hungarian (%)
Ancestries Reported - Irish (%)
Ancestries Reported - Italian (%)
Ancestries Reported - Lithuanian (%)
Ancestries Reported - Norwegian (%)
Ancestries Reported - Polish (%)
Ancestries Reported - Portuguese (%)
Ancestries Reported - Russian (%)
Ancestries Reported - Scotch-Irish (%)
Ancestries Reported - Scottish (%)
Ancestries Reported - Slovak (%)
Ancestries Reported - Subsaharan African (%)
Ancestries Reported - Swedish (%)
Ancestries Reported - Swiss (%)
Ancestries Reported - Ukrainian (%)
Ancestries Reported - United States (%)
Ancestries Reported - Welsh (%)
Ancestries Reported - West Indian (%)
Ancestries Reported - Other (%)
Geographical mobility - Same house 1 year ago (%)
Geographical mobility - Same house 1 year ago (%) - White
Geographical mobility - Same house 1 year ago (%) - Black or African American
Geographical mobility - Same house 1 year ago (%) - Asian
Geographical mobility - Same house 1 year ago (%) - Hispanic or Latino
Geographical mobility - Same house 1 year ago (%) - American Indian and Alaska Native
Geographical mobility - Same house 1 year ago (%) - Multirace
Geographical mobility - Same house 1 year ago (%) - Other Race
Geographical mobility - Moved within same county (%)
Geographical mobility - Moved within same county (%) - White
Geographical mobility - Moved within same county (%) - Black or African American
Geographical mobility - Moved within same county (%) - Asian
Geographical mobility - Moved within same county (%) - Hispanic or Latino
Geographical mobility - Moved within same county (%) - American Indian and Alaska Native
Geographical mobility - Moved within same county (%) - Multirace
Geographical mobility - Moved within same county (%) - Other Race
Geographical mobility - Moved from different county within same state (%)
Geographical mobility - Moved from different county within same state (%) - White
Geographical mobility - Moved from different county within same state (%) - Black or African American
Geographical mobility - Moved from different county within same state (%) - Asian
Geographical mobility - Moved from different county within same state (%) - Hispanic or Latino
Geographical mobility - Moved from different county within same state (%) - American Indian and Alaska Native
Geographical mobility - Moved from different county within same state (%) - Multirace
Geographical mobility - Moved from different county within same state (%) - Other Race
Geographical mobility - Moved from different state (%)
Geographical mobility - Moved from different state (%) - White
Geographical mobility - Moved from different state (%) - Black or African American
Geographical mobility - Moved from different state (%) - Asian
Geographical mobility - Moved from different state (%) - Hispanic or Latino
Geographical mobility - Moved from different state (%) - American Indian and Alaska Native
Geographical mobility - Moved from different state (%) - Multirace
Geographical mobility - Moved from different state (%) - Other Race
Geographical mobility - Moved from abroad (%)
Geographical mobility - Moved from abroad (%) - White
Geographical mobility - Moved from abroad (%) - Black or African American
Geographical mobility - Moved from abroad (%) - Asian
Geographical mobility - Moved from abroad (%) - Hispanic or Latino
Geographical mobility - Moved from abroad (%) - American Indian and Alaska Native
Geographical mobility - Moved from abroad (%) - Multirace
Geographical mobility - Moved from abroad (%) - Other Race
Place of birth for the foreign-born population - Ireland (%)
Place of birth for the foreign-born population - Denmark (%)
Place of birth for the foreign-born population - Norway (%)
Place of birth for the foreign-born population - Sweden (%)
Place of birth for the foreign-born population - United Kingdom (%)
Place of birth for the foreign-born population - England (%)
Place of birth for the foreign-born population - Scotland (%)
Place of birth for the foreign-born population - Other Northern Europe (%)
Place of birth for the foreign-born population - Austria (%)
Place of birth for the foreign-born population - Belgium (%)
Place of birth for the foreign-born population - France (%)
Place of birth for the foreign-born population - Germany (%)
Place of birth for the foreign-born population - Netherlands (%)
Place of birth for the foreign-born population - Switzerland (%)
Place of birth for the foreign-born population - Other Western Europe (%)
Place of birth for the foreign-born population - Greece (%)
Place of birth for the foreign-born population - Italy (%)
Place of birth for the foreign-born population - Portugal (%)
Place of birth for the foreign-born population - Spain (%)
Place of birth for the foreign-born population - Other Southern Europe (%)
Place of birth for the foreign-born population - Albania (%)
Place of birth for the foreign-born population - Belarus (%)
Place of birth for the foreign-born population - Bosnia and Herzegovina (%)
Place of birth for the foreign-born population - Bulgaria (%)
Place of birth for the foreign-born population - Croatia (%)
Place of birth for the foreign-born population - Czechoslovakia (%)
Place of birth for the foreign-born population - Hungary (%)
Place of birth for the foreign-born population - Latvia (%)
Place of birth for the foreign-born population - Lithuania (%)
Place of birth for the foreign-born population - North Macedonia (Macedonia) (%)
Place of birth for the foreign-born population - Moldova (%)
Place of birth for the foreign-born population - Poland (%)
Place of birth for the foreign-born population - Romania (%)
Place of birth for the foreign-born population - Russia (%)
Place of birth for the foreign-born population - Serbia (%)
Place of birth for the foreign-born population - Ukraine (%)
Place of birth for the foreign-born population - Other Eastern Europe (%)
Place of birth for the foreign-born population - China (%)
Place of birth for the foreign-born population - Hong Kong (%)
Place of birth for the foreign-born population - Taiwan (%)
Place of birth for the foreign-born population - Japan (%)
Place of birth for the foreign-born population - Korea (%)
Place of birth for the foreign-born population - Other Eastern Asia (%)
Place of birth for the foreign-born population - Afghanistan (%)
Place of birth for the foreign-born population - Bangladesh (%)
Place of birth for the foreign-born population - India (%)
Place of birth for the foreign-born population - Iran (%)
Place of birth for the foreign-born population - Kazakhstan (%)
Place of birth for the foreign-born population - Nepal (%)
Place of birth for the foreign-born population - Pakistan (%)
Place of birth for the foreign-born population - Sri Lanka (%)
Place of birth for the foreign-born population - Uzbekistan (%)
Place of birth for the foreign-born population - Other South Central Asia (%)
Place of birth for the foreign-born population - Burma (%)
Place of birth for the foreign-born population - Cambodia (%)
Place of birth for the foreign-born population - Indonesia (%)
Place of birth for the foreign-born population - Laos (%)
Place of birth for the foreign-born population - Malaysia (%)
Place of birth for the foreign-born population - Philippines (%)
Place of birth for the foreign-born population - Singapore (%)
Place of birth for the foreign-born population - Thailand (%)
Place of birth for the foreign-born population - Vietnam (%)
Place of birth for the foreign-born population - Other South Eastern Asia (%)
Place of birth for the foreign-born population - Armenia (%)
Place of birth for the foreign-born population - Iraq (%)
Place of birth for the foreign-born population - Israel (%)
Place of birth for the foreign-born population - Jordan (%)
Place of birth for the foreign-born population - Kuwait (%)
Place of birth for the foreign-born population - Lebanon (%)
Place of birth for the foreign-born population - Saudi Arabia (%)
Place of birth for the foreign-born population - Syria (%)
Place of birth for the foreign-born population - Turkey (%)
Place of birth for the foreign-born population - Yemen (%)
Place of birth for the foreign-born population - Other Western Asia (%)
Place of birth for the foreign-born population - Eritrea (%)
Place of birth for the foreign-born population - Ethiopia (%)
Place of birth for the foreign-born population - Kenya (%)
Place of birth for the foreign-born population - Somalia (%)
Place of birth for the foreign-born population - Uganda (%)
Place of birth for the foreign-born population - Zimbabwe (%)
Place of birth for the foreign-born population - Other Eastern Africa (%)
Place of birth for the foreign-born population - Cameroon (%)
Place of birth for the foreign-born population - Congo (%)
Place of birth for the foreign-born population - Democratic Republic of Congo (Zaire) (%)
Place of birth for the foreign-born population - Other Middle Africa (%)
Place of birth for the foreign-born population - Egypt (%)
Place of birth for the foreign-born population - Morocco (%)
Place of birth for the foreign-born population - Sudan (%)
Place of birth for the foreign-born population - Other Northern Africa (%)
Place of birth for the foreign-born population - South Africa (%)
Place of birth for the foreign-born population - Other Southern Africa (%)
Place of birth for the foreign-born population - Cabo Verde (%)
Place of birth for the foreign-born population - Ghana (%)
Place of birth for the foreign-born population - Liberia (%)
Place of birth for the foreign-born population - Nigeria (%)
Place of birth for the foreign-born population - Senegal (%)
Place of birth for the foreign-born population - Sierra Leone (%)
Place of birth for the foreign-born population - Other Western Africa (%)
Place of birth for the foreign-born population - Australia (%)
Place of birth for the foreign-born population - New Zealand (%)
Place of birth for the foreign-born population - Fiji (%)
Place of birth for the foreign-born population - Micronesia (%)
Place of birth for the foreign-born population - Bahamas (%)
Place of birth for the foreign-born population - Barbados (%)
Place of birth for the foreign-born population - Cuba (%)
Place of birth for the foreign-born population - Dominica (%)
Place of birth for the foreign-born population - Dominican Republic (%)
Place of birth for the foreign-born population - Grenada (%)
Place of birth for the foreign-born population - Haiti (%)
Place of birth for the foreign-born population - Jamaica (%)
Place of birth for the foreign-born population - St. Vincent and the Grenadines (%)
Place of birth for the foreign-born population - Trinidad and Tobago (%)
Place of birth for the foreign-born population - West Indies (%)
Place of birth for the foreign-born population - Other Caribbean (%)
Place of birth for the foreign-born population - Belize (%)
Place of birth for the foreign-born population - Costa Rica (%)
Place of birth for the foreign-born population - El Salvador (%)
Place of birth for the foreign-born population - Guatemala (%)
Place of birth for the foreign-born population - Honduras (%)
Place of birth for the foreign-born population - Mexico (%)
Place of birth for the foreign-born population - Nicaragua (%)
Place of birth for the foreign-born population - Panama (%)
Place of birth for the foreign-born population - Other Central America (%)
Place of birth for the foreign-born population - Argentina (%)
Place of birth for the foreign-born population - Bolivia (%)
Place of birth for the foreign-born population - Brazil (%)
Place of birth for the foreign-born population - Chile (%)
Place of birth for the foreign-born population - Colombia (%)
Place of birth for the foreign-born population - Ecuador (%)
Place of birth for the foreign-born population - Guyana (%)
Place of birth for the foreign-born population - Peru (%)
Place of birth for the foreign-born population - Uruguay (%)
Place of birth for the foreign-born population - Venezuela (%)
Place of birth for the foreign-born population - Other South America (%)
Place of birth for the foreign-born population - Canada (%)
Place of birth for the foreign-born population - Other Northern America (%)
Place of birth for the foreign-born population - Other (%)
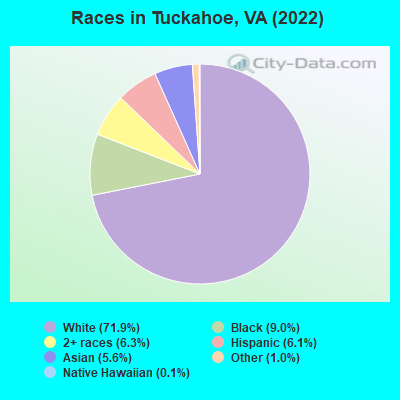
According to 2022 data, the most numerous races in Tuckahoe, VA are White alone (34,611 residents), Black alone (4,358 residents), and Hispanic (2,952 residents). 85.2% of Tuckahoe residents speak English at home. 13.1% of Tuckahoe, VA residents are foreign-born (4.7% born in Asia, 3.4% born in Latin America, 2.6% born in Europe, 1.9% born in Africa), which is 8.3% greater than the foreign-born rate of 12.0% across the entire state of Virginia.
Race distribution in Tuckahoe
2000 2022
4,965,637 70.2% White alone 1,376,378 19.4% Black alone 329,540 4.7% Hispanic 259,277 3.7% Asian alone 114,022 1.6% Two or more races 18,596 0.3% American Indian alone 11,685 0.2% Other race alone 3,380 0.05% Native Hawaiian and Other
5,095,130 58.7% White alone 1,594,785 18.4% Black alone 905,750 10.4% Hispanic 602,881 6.9% Asian alone 406,047 4.7% Two or more races 60,419 0.7% Other race alone 11,738 0.1% American Indian alone 6,869 0.08% Native Hawaiian and Other
Income and house value in Tuckahoe Median household income in 2022 $99,755 White non-Hispanic householders$46,996 Black householders$85,094 Asian householders$62,404 Some other race householders$47,936 Two or more races householders$51,493 Hispanic or Latino race householdersMedian 2022 house value $443,597 White Non-Hispanic householders$391,702 Black or African American householders$329,839 American Indian or Alaska Native householders $498,424 Asian householders$351,828 Some other race householders$321,630 Two or more races householders$383,493 Hispanic or Latino householders
Median age by race in Tuckahoe
44.9 Median age for White residents41.4 48.1 31.6 Median age for Black or African American residents29.1 35.4 72.3 Median age for American Indian / Alaska Native residents-402,222,221.8 -687,861,271.0 32.8 Median age for Asian residents42.7 26.7 -348,441,926.0 Median age for Native Hawaiian / Pacific Islander residents-541,531,822.5 -714,150,046.8 31.7 Median age for Other race residents31.2 32.7 27.2 Median age for Two or more races residents22.9 27.7 45.2 Median age for White alone residents41.1 48.7 28.1 Median age for Hispanic or Latino residents28.6 28.9
Owner/renter occupied households by race in Tuckahoe
House owners and renters - White residents 10,712 71.9% Owner occupied4,186 28.1% Renter occupiedHouse owners and renters - Black or African American residents 349 17.0% Owner occupied1,697 83.0% Renter occupiedHouse owners and renters - American Indian / Alaska Native residents 27 66.3% Owner occupied14 33.7% Renter occupiedHouse owners and renters - Asian residents 374 47.1% Owner occupied420 52.9% Renter occupiedHouse owners and renters - Native Hawaiian / Pacific Islander residents 27 100.0% Owner occupiedHouse owners and renters - Other race residents 169 30.9% Owner occupied378 69.1% Renter occupiedHouse owners and renters - Two or more races residents 504 44.7% Owner occupied623 55.3% Renter occupiedHouse owners and renters - White alone residents 10,695 72.4% Owner occupied4,071 27.6% Renter occupiedHouse owners and renters - Hispanic or Latino residents 335 36.1% Owner occupied592 63.9% Renter occupied
Language usage in Tuckahoe
English speakers - Total 85.2% of residents of Tuckahoe speak English at home.
5.1% of residents speak Spanish at home 1,618 70.3% Speak English very well685 29.7% Speak English less than very well9.4% of residents speak other language at home 2,198 52.3% Speak English very well2,001 47.7% Speak English less than very well
English speakers - Born in the United States 93.9% of residents of Tuckahoe speak English at home.
5.1% of residents speak Spanish at home 698 86.3% Speak English very well111 13.7% Speak English less than very well1.9% of residents speak other language at home 269 87.9% Speak English very well37 12.1% Speak English less than very well
English speakers - Native, born elsewhere 73.8% of residents of Tuckahoe speak English at home.
8.4% of residents speak Spanish at home 44 55.7% Speak English very well35 44.3% Speak English less than very well21.2% of residents speak other language at home 100 50.3% Speak English very well99 49.7% Speak English less than very well
English speakers - Foreign-born 25.3% of residents of Tuckahoe speak English at home.
16.0% of residents speak Spanish at home 360 37.0% Speak English very well614 63.0% Speak English less than very well55.9% of residents speak other language at home 1,505 44.3% Speak English very well1,891 55.7% Speak English less than very well
White (Caucasian) - Speak only English Native:
96.8% (29,763)Foreign-born:
26.4% (488)
White (Caucasian) - Speak another language Native:
3.0% (911)Foreign-born:
73.1% (1,352)
Black or African American - Speak only English Native:
95.6% (3,375)Foreign-born:
41.0% (339)
Black or African American - Speak another language Native:
4.7% (166)Foreign-born:
48.8% (403)
Asian - Speak only English Native:
71.3% (455)Foreign-born:
24.8% (429)
Asian - Speak another language Native:
32.3% (206)Foreign-born:
77.0% (1,332)
Other race - Speak only English Native:
41.7% (223)Foreign-born:
4.1% (38)
Other race - Speak another language Native:
52.4% (280)Foreign-born:
98.1% (924)
Two or more races - Speak only English Native:
87.2% (2,789)Foreign-born:
14.6% (83)
Two or more races - Speak another language Native:
12.7% (406)Foreign-born:
85.2% (483)
White alone - Speak only English Native:
97.3% (29,667)Foreign-born:
24.8% (472)
White alone - Speak another language Native:
2.5% (762)Foreign-born:
75.0% (1,427)
Hispanic or Latino - Speak only English Native:
54.0% (824)Foreign-born:
6.9% (73)
Hispanic or Latino - Speak another language Native:
44.9% (686)Foreign-born:
95.2% (1,006)
Foreign-born residents in Tuckahoe 6,302 residents are foreign born (4.7% Asia , 3.4% Latin America , 2.6% Europe , 1.9% Africa ).
This city:
13.1%Virginia:
12.6%
Marital status for residents in Tuckahoe Marital status - White (Caucasian) population 15 years and over
Males 32.7% Never married55.4% Now married0.7% Separated2.7% Widowed8.4% DivorcedFemales 19.6% Never married52.5% Now married1.9% Separated12.0% Widowed14.1% DivorcedWomen who gave birth in the past 12 months Now married:
74.3% (175)Unmarried:
25.7% (60)
Women who did not give birth in the past 12 months Now married:
54.0% (3,495)Unmarried:
46.0% (2,978)
Marital status - Black or African American population 15 years and over
Males 59.3% Never married28.4% Now married5.1% Separated1.4% Widowed5.7% DivorcedFemales 51.8% Never married20.6% Now married0.7% Separated9.6% Widowed17.3% DivorcedWomen who gave birth in the past 12 months Now married:
100.0% (7)Unmarried:
0.0% (0)
Women who did not give birth in the past 12 months Now married:
23.4% (292)Unmarried:
76.6% (957)
Marital status - American Indian / Alaska Native population 15 years and over
Males 100.0% Never married0.0% Now married0.0% Separated0.0% Widowed0.0% DivorcedFemales 36.8% Never married63.2% Now married0.0% Separated0.0% Widowed0.0% DivorcedWomen who did not give birth in the past 12 months Now married:
63.2% (13)Unmarried:
36.8% (7)
Marital status - Asian population 15 years and over
Males 34.9% Never married52.9% Now married0.0% Separated2.8% Widowed9.4% DivorcedFemales 28.5% Never married54.3% Now married0.0% Separated11.1% Widowed6.1% DivorcedWomen who gave birth in the past 12 months Now married:
100.0% (23)Unmarried:
0.0% (0)
Women who did not give birth in the past 12 months Now married:
59.8% (573)Unmarried:
40.2% (385)
Marital status - Other race population 15 years and over
Males 30.9% Never married66.3% Now married0.0% Separated0.0% Widowed2.8% DivorcedFemales 22.5% Never married33.2% Now married26.1% Separated8.8% Widowed9.4% DivorcedWomen who did not give birth in the past 12 months Now married:
68.8% (329)Unmarried:
31.2% (149)
Marital status - Two or more races population 15 years and over
Males 55.0% Never married40.5% Now married2.2% Separated0.0% Widowed2.4% DivorcedFemales 42.8% Never married37.8% Now married3.5% Separated7.3% Widowed8.5% DivorcedWomen who gave birth in the past 12 months Now married:
100.0% (20)Unmarried:
0.0% (0)
Women who did not give birth in the past 12 months Now married:
40.3% (477)Unmarried:
59.7% (708)
Marital status - White alone, not Hispanic / Latino population 15 years and over
Males 32.8% Never married55.4% Now married0.7% Separated2.8% Widowed8.4% DivorcedFemales 19.4% Never married52.3% Now married1.9% Separated12.1% Widowed14.2% DivorcedWomen who gave birth in the past 12 months Now married:
75.1% (157)Unmarried:
24.9% (52)
Women who did not give birth in the past 12 months Now married:
54.3% (3,492)Unmarried:
45.7% (2,938)
Marital status - Hispanic or Latino population 15 years and over
Males 36.1% Never married56.2% Now married2.7% Separated0.0% Widowed5.0% DivorcedFemales 27.8% Never married41.8% Now married14.3% Separated6.8% Widowed9.4% DivorcedWomen who gave birth in the past 12 months Now married:
68.8% (22)Unmarried:
31.2% (10)
Women who did not give birth in the past 12 months Now married:
54.9% (351)Unmarried:
45.1% (289)
Ancestries in Tuckahoe
4,151 16.8% English1,899 7.7% American1,697 6.9% Irish1,417 5.8% German1,147 4.7% Italian719 2.9% European588 2.4% Scotch-Irish564 2.3% Scottish496 2.0% Egyptian406 1.6% Polish258 1.0% Afghan240 1.0% British224 0.9% Jamaican221 0.9% Iraqi211 0.9% Brazilian176 0.7% Turkish171 0.7% African144 0.6% Yugoslavian135 0.5% Greek134 0.5% Welsh122 0.5% Liberian118 0.5% French112 0.5% Canadian108 0.4% Scandinavian108 0.4% Russian101 0.4% Northern European91 0.4% Armenian86 0.3% Lebanese86 0.3% French Canadian78 0.3% Dutch73 0.3% Ukrainian72 0.3% Norwegian68 0.3% Czech62 0.3% Portuguese61 0.2% Cajun55 0.2% Arab53 0.2% Slovak49 0.2% Eastern European47 0.2% Hungarian42 0.2% Romanian36 0.1% Lithuanian32 0.1% Swedish32 0.1% Danish28 0.1% Soviet Union19 0.08% Kenyan19 0.08% Trinidadian and Tobagonian15 0.06% Barbadian15 0.06% Haitian12 0.05% South African9 0.04% Latvian9 0.04% Swiss8 0.03% Serbian7 0.03% Czechoslovakian
Geographical mobility in Tuckahoe Same house 1 year ago 31,412 90.4% White (Caucasian)3,436 75.6% Black or African American38 80.5% American Indian / Alaska Native2,110 85.8% Asian33 95.3% Native Hawaiian / Pacific Islander1,792 96.6% Other race3,359 83.7% Two or more races31,545 91.5% White alone, not Hispanic / Latino2,158 75.2% Hispanic or LatinoMoved within same county 1,559 4.5% White / Caucasian876 19.3% Black or African American231 9.4% Asian362 9.0% Two or more races1,193 3.5% White alone, not Hispanic / Latino466 16.2% Hispanic or LatinoMoved within same state 1,308 3.8% White / Caucasian147 3.2% Black or African American46 1.9% Asian272 6.8% Two or more races1,283 3.7% White alone, not Hispanic / Latino131 4.6% Hispanic or LatinoMoved from different state 333 1.0% White / Caucasian7 14.7% American Indian / Alaska Native24 1.0% Asian54 2.9% Other race72 1.8% Two or more races348 1.0% White alone, not Hispanic / Latino74 2.6% Hispanic or LatinoMoved from abroad 48 0.1% White50 2.7% Other race14 0.4% Two or more races48 0.1% White alone, not Hispanic / Latino41 1.4% Hispanic or Latino
Children Nativity (place of birth) in Tuckahoe
Children under 6 years - Living with two parents Both parents native 1,902 100.0% NativeBoth parents foreign-born 601 91.8% Native54 8.2% Foreign-bornOne native, one foreign-born parent 396 100.0% NativeChildren under 6 years - Living with one parent Native parent 811 100.0% NativeForeign-born parent 121 100.0% NativeChildren 6 to 17 years - Living with two parents Both parents native 4,477 100.0% NativeBoth parents foreign-born 543 68.9% Native245 31.1% Foreign-bornOne native, one foreign-born parent 299 100.0% NativeChildren 6 to 17 years - Living with one parent Native parent 908 100.0% NativeForeign-born parent 462 51.1% Native441 48.9% Foreign-born
Grandparents responsible for own grandchildren in Tuckahoe
Grandparents (30 to 59 years) White / Caucasian 2 100.0% Not responsible for grandchildrenBlack or African American 21 61.6% Responsible for grandchildren13 38.4% Not responsible for grandchildrenOther race 31 100.0% Not responsible for grandchildrenTwo or more races 19 100.0% Not responsible for grandchildrenWhite alone, not Hispanic / Latino 3 100.0% Not responsible for grandchildrenGrandparents (60 years and over) White / Caucasian 19 17.1% Responsible for grandchildren94 82.9% Not responsible for grandchildrenBlack or African American 8 31.8% Responsible for grandchildren16 68.2% Not responsible for grandchildrenOther race 20 100.0% Not responsible for grandchildrenWhite alone, not Hispanic / Latino 19 16.2% Responsible for grandchildren100 83.8% Not responsible for grandchildren