Races in Watauga, Texas (TX) Detailed Stats
Data:
Races - White alone (%)
Races - White alone (% change since 2000)
Races - Black alone (%)
Races - Black alone (% change since 2000)
Races - American Indian alone (%)
Races - American Indian alone (% change since 2000)
Races - Asian alone (%)
Races - Asian alone (% change since 2000)
Races - Hispanic (%)
Races - Hispanic (% change since 2000)
Races - Native Hawaiian and Other Pacific Islander alone (%)
Races - Native Hawaiian and Other Pacific Islander alone (% change since 2000)
Races - Two or more races(%)
Races - Two or more races(% change since 2000)
Races - Other race alone (%)
Races - Other race alone (% change since 2000)
Racial diversity
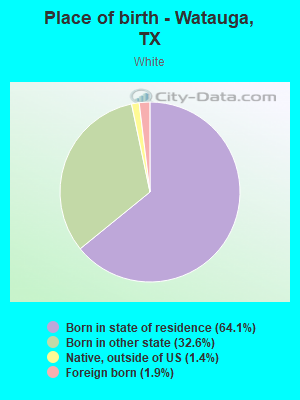
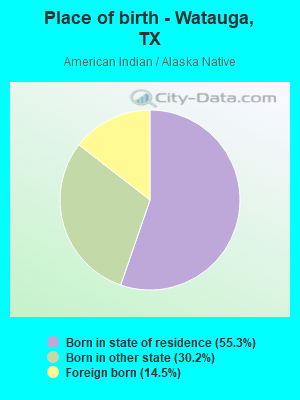
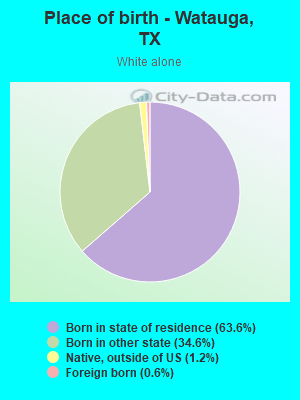
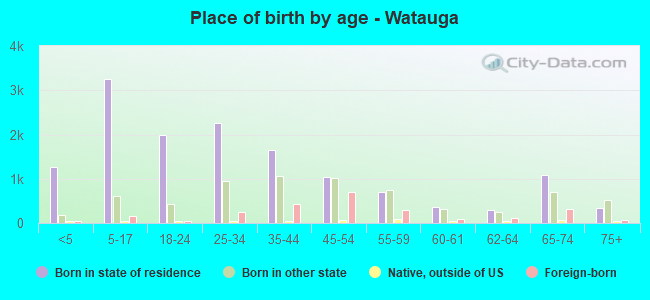
Place of birth - Born in state of residence (%)
Place of birth - Born in state of residence (%) - White
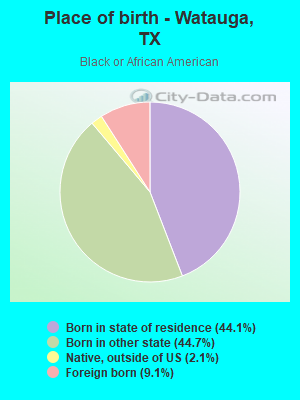
Place of birth - Born in state of residence (%) - Black or African American
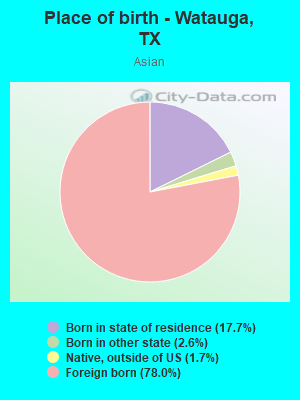
Place of birth - Born in state of residence (%) - Asian
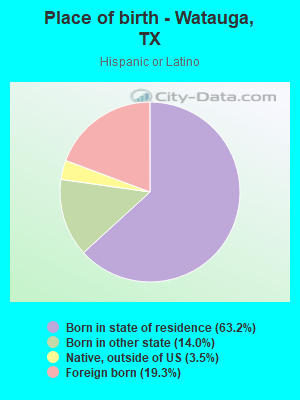
Place of birth - Born in state of residence (%) - Hispanic or Latino
Place of birth - Born in state of residence (%) - American Indian and Alaska Native
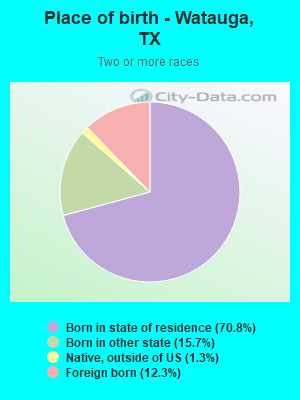
Place of birth - Born in state of residence (%) - Multirace
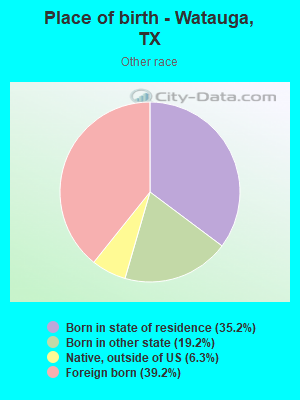
Place of birth - Born in state of residence (%) - Other Race
Place of birth - Born in other state (%)
Place of birth - Born in other state (%) - White
Place of birth - Born in other state (%) - Black or African American
Place of birth - Born in other state (%) - Asian
Place of birth - Born in other state (%) - Hispanic or Latino
Place of birth - Born in other state (%) - American Indian and Alaska Native
Place of birth - Born in other state (%) - Multirace
Place of birth - Born in other state (%) - Other Race
Place of birth - Native, outside of US (%)
Place of birth - Native, outside of US (%) - White
Place of birth - Native, outside of US (%) - Black or African American
Place of birth - Native, outside of US (%) - Asian
Place of birth - Native, outside of US (%) - Hispanic or Latino
Place of birth - Native, outside of US (%) - American Indian and Alaska Native
Place of birth - Native, outside of US (%) - Multirace
Place of birth - Native, outside of US (%) - Other Race
Place of birth - Foreign born (%)
Place of birth - Foreign born (%) - White
Place of birth - Foreign born (%) - Black or African American
Place of birth - Foreign born (%) - Asian
Place of birth - Foreign born (%) - Hispanic or Latino
Place of birth - Foreign born (%) - American Indian and Alaska Native
Place of birth - Foreign born (%) - Multirace
Place of birth - Foreign born (%) - Other Race
Residents speaking English at home (%)
Residents speaking English at home - Born in the United States (%)
Residents speaking English at home - Native, born elsewhere (%)
Residents speaking English at home - Foreign born (%)
Residents speaking Spanish at home (%)
Residents speaking Spanish at home - Born in the United States (%)
Residents speaking Spanish at home - Native, born elsewhere (%)
Residents speaking Spanish at home - Foreign born (%)
Residents speaking other language at home (%)
Residents speaking other language at home - Born in the United States (%)
Residents speaking other language at home - Native, born elsewhere (%)
Residents speaking other language at home - Foreign born (%)
Marital status - Never married (%)
Marital status - Now married (%)
Marital status - Separated (%)
Marital status - Widowed (%)
Marital status - Divorced (%)
Ancestries Reported - Arab (%)
Ancestries Reported - Czech (%)
Ancestries Reported - Danish (%)
Ancestries Reported - Dutch (%)
Ancestries Reported - English (%)
Ancestries Reported - French (%)
Ancestries Reported - French Canadian (%)
Ancestries Reported - German (%)
Ancestries Reported - Greek (%)
Ancestries Reported - Hungarian (%)
Ancestries Reported - Irish (%)
Ancestries Reported - Italian (%)
Ancestries Reported - Lithuanian (%)
Ancestries Reported - Norwegian (%)
Ancestries Reported - Polish (%)
Ancestries Reported - Portuguese (%)
Ancestries Reported - Russian (%)
Ancestries Reported - Scotch-Irish (%)
Ancestries Reported - Scottish (%)
Ancestries Reported - Slovak (%)
Ancestries Reported - Subsaharan African (%)
Ancestries Reported - Swedish (%)
Ancestries Reported - Swiss (%)
Ancestries Reported - Ukrainian (%)
Ancestries Reported - United States (%)
Ancestries Reported - Welsh (%)
Ancestries Reported - West Indian (%)
Ancestries Reported - Other (%)
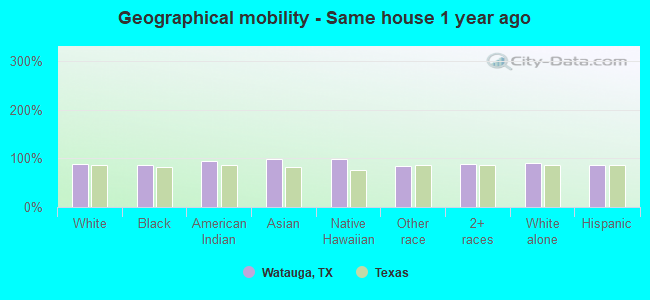
Geographical mobility - Same house 1 year ago (%)
Geographical mobility - Same house 1 year ago (%) - White
Geographical mobility - Same house 1 year ago (%) - Black or African American
Geographical mobility - Same house 1 year ago (%) - Asian
Geographical mobility - Same house 1 year ago (%) - Hispanic or Latino
Geographical mobility - Same house 1 year ago (%) - American Indian and Alaska Native
Geographical mobility - Same house 1 year ago (%) - Multirace
Geographical mobility - Same house 1 year ago (%) - Other Race
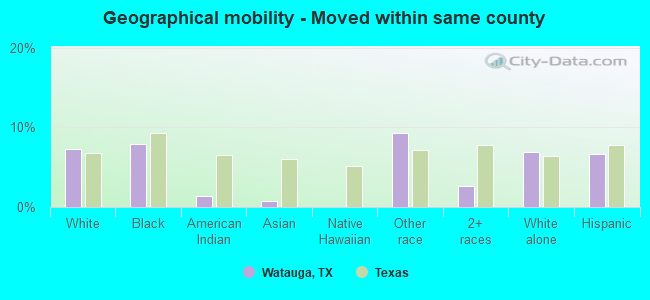
Geographical mobility - Moved within same county (%)
Geographical mobility - Moved within same county (%) - White
Geographical mobility - Moved within same county (%) - Black or African American
Geographical mobility - Moved within same county (%) - Asian
Geographical mobility - Moved within same county (%) - Hispanic or Latino
Geographical mobility - Moved within same county (%) - American Indian and Alaska Native
Geographical mobility - Moved within same county (%) - Multirace
Geographical mobility - Moved within same county (%) - Other Race
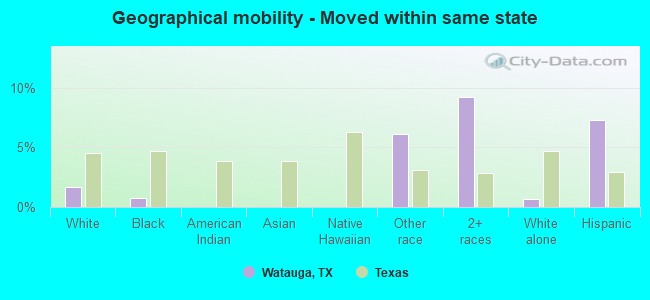
Geographical mobility - Moved from different county within same state (%)
Geographical mobility - Moved from different county within same state (%) - White
Geographical mobility - Moved from different county within same state (%) - Black or African American
Geographical mobility - Moved from different county within same state (%) - Asian
Geographical mobility - Moved from different county within same state (%) - Hispanic or Latino
Geographical mobility - Moved from different county within same state (%) - American Indian and Alaska Native
Geographical mobility - Moved from different county within same state (%) - Multirace
Geographical mobility - Moved from different county within same state (%) - Other Race
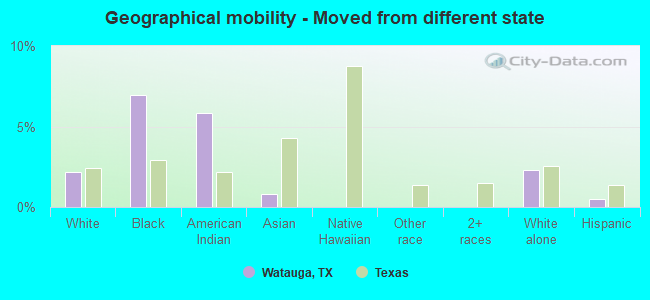
Geographical mobility - Moved from different state (%)
Geographical mobility - Moved from different state (%) - White
Geographical mobility - Moved from different state (%) - Black or African American
Geographical mobility - Moved from different state (%) - Asian
Geographical mobility - Moved from different state (%) - Hispanic or Latino
Geographical mobility - Moved from different state (%) - American Indian and Alaska Native
Geographical mobility - Moved from different state (%) - Multirace
Geographical mobility - Moved from different state (%) - Other Race
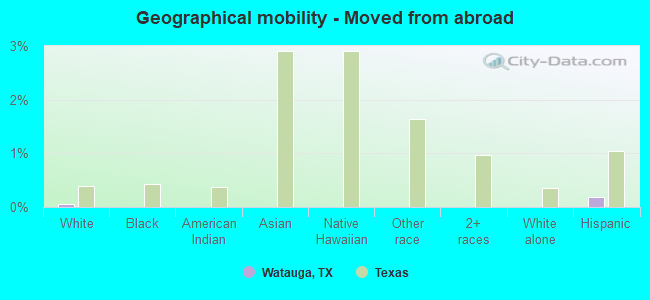
Geographical mobility - Moved from abroad (%)
Geographical mobility - Moved from abroad (%) - White
Geographical mobility - Moved from abroad (%) - Black or African American
Geographical mobility - Moved from abroad (%) - Asian
Geographical mobility - Moved from abroad (%) - Hispanic or Latino
Geographical mobility - Moved from abroad (%) - American Indian and Alaska Native
Geographical mobility - Moved from abroad (%) - Multirace
Geographical mobility - Moved from abroad (%) - Other Race
Place of birth for the foreign-born population - Ireland (%)
Place of birth for the foreign-born population - Denmark (%)
Place of birth for the foreign-born population - Norway (%)
Place of birth for the foreign-born population - Sweden (%)
Place of birth for the foreign-born population - United Kingdom (%)
Place of birth for the foreign-born population - England (%)
Place of birth for the foreign-born population - Scotland (%)
Place of birth for the foreign-born population - Other Northern Europe (%)
Place of birth for the foreign-born population - Austria (%)
Place of birth for the foreign-born population - Belgium (%)
Place of birth for the foreign-born population - France (%)
Place of birth for the foreign-born population - Germany (%)
Place of birth for the foreign-born population - Netherlands (%)
Place of birth for the foreign-born population - Switzerland (%)
Place of birth for the foreign-born population - Other Western Europe (%)
Place of birth for the foreign-born population - Greece (%)
Place of birth for the foreign-born population - Italy (%)
Place of birth for the foreign-born population - Portugal (%)
Place of birth for the foreign-born population - Spain (%)
Place of birth for the foreign-born population - Other Southern Europe (%)
Place of birth for the foreign-born population - Albania (%)
Place of birth for the foreign-born population - Belarus (%)
Place of birth for the foreign-born population - Bosnia and Herzegovina (%)
Place of birth for the foreign-born population - Bulgaria (%)
Place of birth for the foreign-born population - Croatia (%)
Place of birth for the foreign-born population - Czechoslovakia (%)
Place of birth for the foreign-born population - Hungary (%)
Place of birth for the foreign-born population - Latvia (%)
Place of birth for the foreign-born population - Lithuania (%)
Place of birth for the foreign-born population - North Macedonia (Macedonia) (%)
Place of birth for the foreign-born population - Moldova (%)
Place of birth for the foreign-born population - Poland (%)
Place of birth for the foreign-born population - Romania (%)
Place of birth for the foreign-born population - Russia (%)
Place of birth for the foreign-born population - Serbia (%)
Place of birth for the foreign-born population - Ukraine (%)
Place of birth for the foreign-born population - Other Eastern Europe (%)
Place of birth for the foreign-born population - China (%)
Place of birth for the foreign-born population - Hong Kong (%)
Place of birth for the foreign-born population - Taiwan (%)
Place of birth for the foreign-born population - Japan (%)
Place of birth for the foreign-born population - Korea (%)
Place of birth for the foreign-born population - Other Eastern Asia (%)
Place of birth for the foreign-born population - Afghanistan (%)
Place of birth for the foreign-born population - Bangladesh (%)
Place of birth for the foreign-born population - India (%)
Place of birth for the foreign-born population - Iran (%)
Place of birth for the foreign-born population - Kazakhstan (%)
Place of birth for the foreign-born population - Nepal (%)
Place of birth for the foreign-born population - Pakistan (%)
Place of birth for the foreign-born population - Sri Lanka (%)
Place of birth for the foreign-born population - Uzbekistan (%)
Place of birth for the foreign-born population - Other South Central Asia (%)
Place of birth for the foreign-born population - Burma (%)
Place of birth for the foreign-born population - Cambodia (%)
Place of birth for the foreign-born population - Indonesia (%)
Place of birth for the foreign-born population - Laos (%)
Place of birth for the foreign-born population - Malaysia (%)
Place of birth for the foreign-born population - Philippines (%)
Place of birth for the foreign-born population - Singapore (%)
Place of birth for the foreign-born population - Thailand (%)
Place of birth for the foreign-born population - Vietnam (%)
Place of birth for the foreign-born population - Other South Eastern Asia (%)
Place of birth for the foreign-born population - Armenia (%)
Place of birth for the foreign-born population - Iraq (%)
Place of birth for the foreign-born population - Israel (%)
Place of birth for the foreign-born population - Jordan (%)
Place of birth for the foreign-born population - Kuwait (%)
Place of birth for the foreign-born population - Lebanon (%)
Place of birth for the foreign-born population - Saudi Arabia (%)
Place of birth for the foreign-born population - Syria (%)
Place of birth for the foreign-born population - Turkey (%)
Place of birth for the foreign-born population - Yemen (%)
Place of birth for the foreign-born population - Other Western Asia (%)
Place of birth for the foreign-born population - Eritrea (%)
Place of birth for the foreign-born population - Ethiopia (%)
Place of birth for the foreign-born population - Kenya (%)
Place of birth for the foreign-born population - Somalia (%)
Place of birth for the foreign-born population - Uganda (%)
Place of birth for the foreign-born population - Zimbabwe (%)
Place of birth for the foreign-born population - Other Eastern Africa (%)
Place of birth for the foreign-born population - Cameroon (%)
Place of birth for the foreign-born population - Congo (%)
Place of birth for the foreign-born population - Democratic Republic of Congo (Zaire) (%)
Place of birth for the foreign-born population - Other Middle Africa (%)
Place of birth for the foreign-born population - Egypt (%)
Place of birth for the foreign-born population - Morocco (%)
Place of birth for the foreign-born population - Sudan (%)
Place of birth for the foreign-born population - Other Northern Africa (%)
Place of birth for the foreign-born population - South Africa (%)
Place of birth for the foreign-born population - Other Southern Africa (%)
Place of birth for the foreign-born population - Cabo Verde (%)
Place of birth for the foreign-born population - Ghana (%)
Place of birth for the foreign-born population - Liberia (%)
Place of birth for the foreign-born population - Nigeria (%)
Place of birth for the foreign-born population - Senegal (%)
Place of birth for the foreign-born population - Sierra Leone (%)
Place of birth for the foreign-born population - Other Western Africa (%)
Place of birth for the foreign-born population - Australia (%)
Place of birth for the foreign-born population - New Zealand (%)
Place of birth for the foreign-born population - Fiji (%)
Place of birth for the foreign-born population - Micronesia (%)
Place of birth for the foreign-born population - Bahamas (%)
Place of birth for the foreign-born population - Barbados (%)
Place of birth for the foreign-born population - Cuba (%)
Place of birth for the foreign-born population - Dominica (%)
Place of birth for the foreign-born population - Dominican Republic (%)
Place of birth for the foreign-born population - Grenada (%)
Place of birth for the foreign-born population - Haiti (%)
Place of birth for the foreign-born population - Jamaica (%)
Place of birth for the foreign-born population - St. Vincent and the Grenadines (%)
Place of birth for the foreign-born population - Trinidad and Tobago (%)
Place of birth for the foreign-born population - West Indies (%)
Place of birth for the foreign-born population - Other Caribbean (%)
Place of birth for the foreign-born population - Belize (%)
Place of birth for the foreign-born population - Costa Rica (%)
Place of birth for the foreign-born population - El Salvador (%)
Place of birth for the foreign-born population - Guatemala (%)
Place of birth for the foreign-born population - Honduras (%)
Place of birth for the foreign-born population - Mexico (%)
Place of birth for the foreign-born population - Nicaragua (%)
Place of birth for the foreign-born population - Panama (%)
Place of birth for the foreign-born population - Other Central America (%)
Place of birth for the foreign-born population - Argentina (%)
Place of birth for the foreign-born population - Bolivia (%)
Place of birth for the foreign-born population - Brazil (%)
Place of birth for the foreign-born population - Chile (%)
Place of birth for the foreign-born population - Colombia (%)
Place of birth for the foreign-born population - Ecuador (%)
Place of birth for the foreign-born population - Guyana (%)
Place of birth for the foreign-born population - Peru (%)
Place of birth for the foreign-born population - Uruguay (%)
Place of birth for the foreign-born population - Venezuela (%)
Place of birth for the foreign-born population - Other South America (%)
Place of birth for the foreign-born population - Canada (%)
Place of birth for the foreign-born population - Other Northern America (%)
Place of birth for the foreign-born population - Other (%)
Latest news about races in Watauga, TX collected exclusively by city-data.com from local newspapers, TV, and radio stations
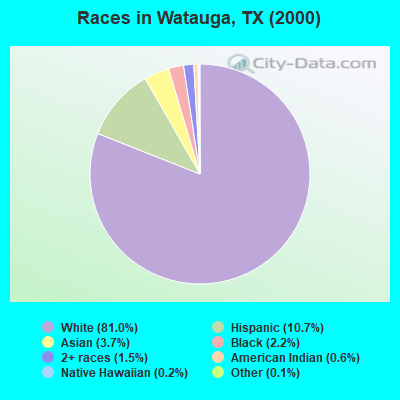
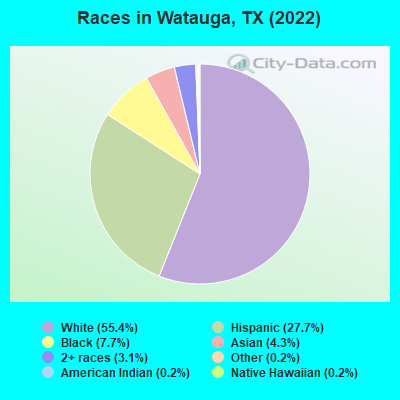
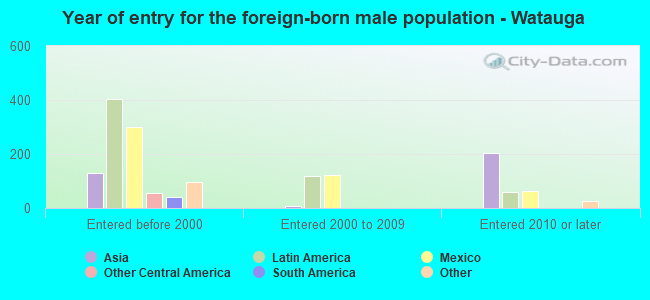
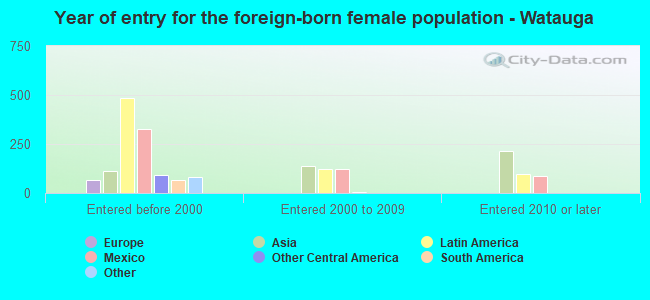
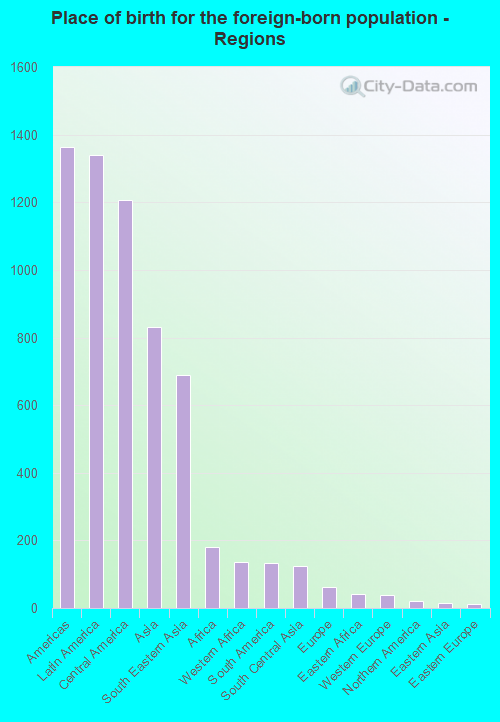
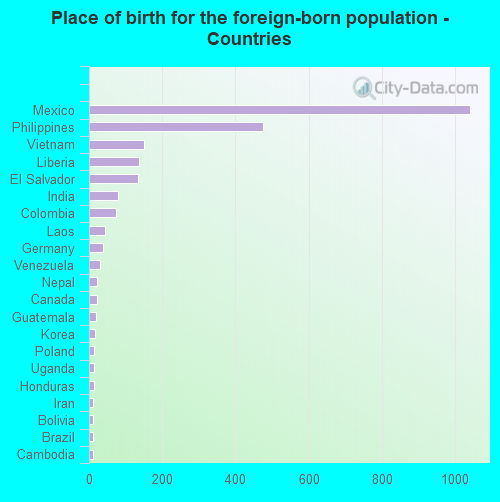
According to 2022 data, the most numerous races in Watauga, TX are Hispanic (6,639 residents), White alone (13,286 residents), and Black alone (1,855 residents). 80.4% of Watauga residents speak English at home. 10.2% of Watauga, TX residents are foreign-born (5.5% born in Latin America, 3.4% born in Asia), which is 66.9% less than the foreign-born rate of 17.0% across the entire state of Texas.
Race distribution in Watauga
2000 2022
10,933,313 52.4% White alone 6,669,666 32.0% Hispanic 2,364,255 11.3% Black alone 554,445 2.7% Asian alone 230,567 1.1% Two or more races 68,859 0.3% American Indian alone 19,958 0.10% Other race alone 10,757 0.05% Native Hawaiian and Other
12,070,642 40.2% Hispanic 11,683,430 38.9% White alone 3,508,706 11.7% Black alone 1,608,173 5.4% Asian alone 956,560 3.2% Two or more races 125,763 0.4% Other race alone 47,023 0.2% American Indian alone 29,275 0.10% Native Hawaiian and Other
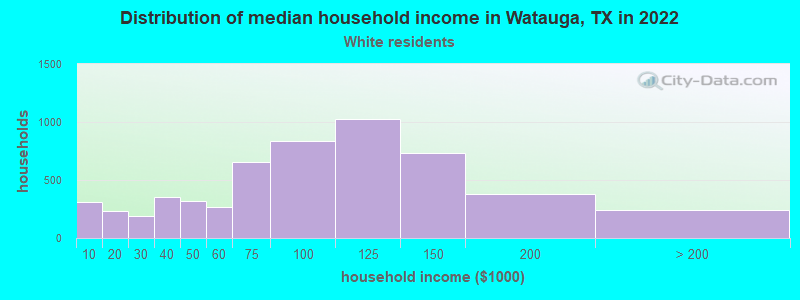
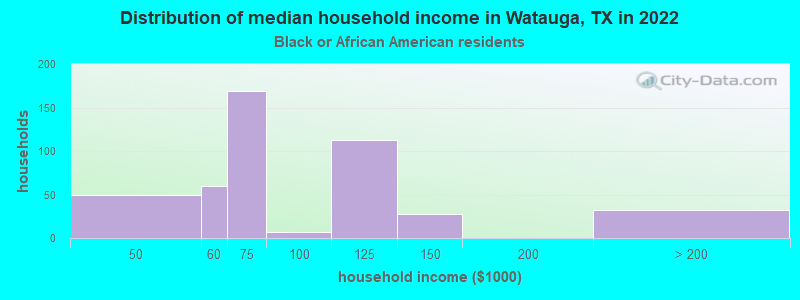
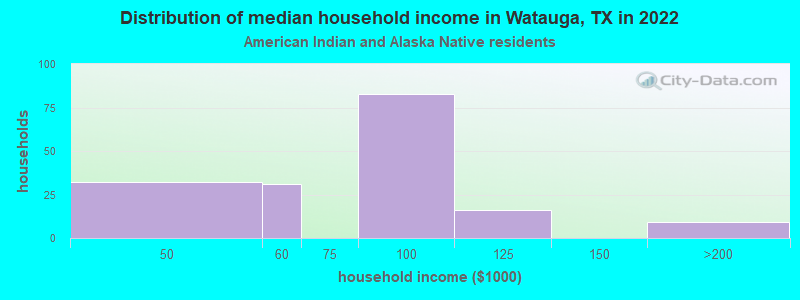
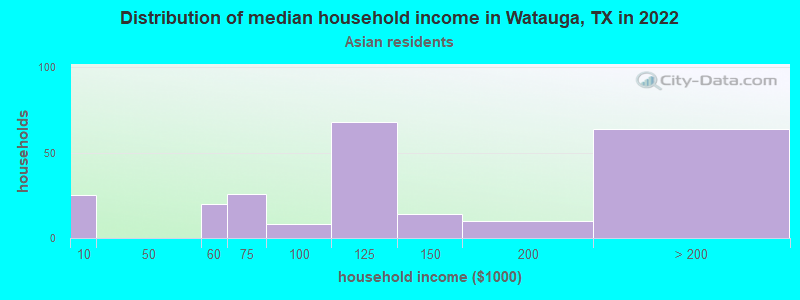
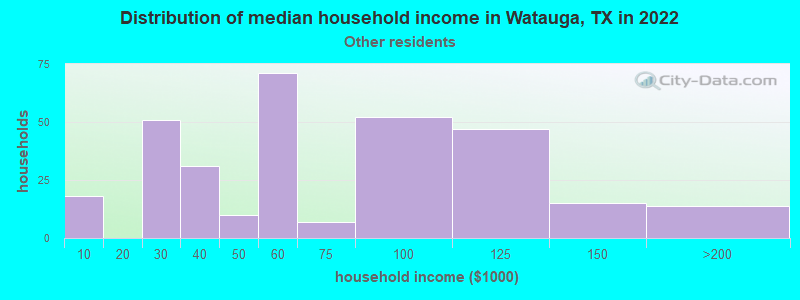
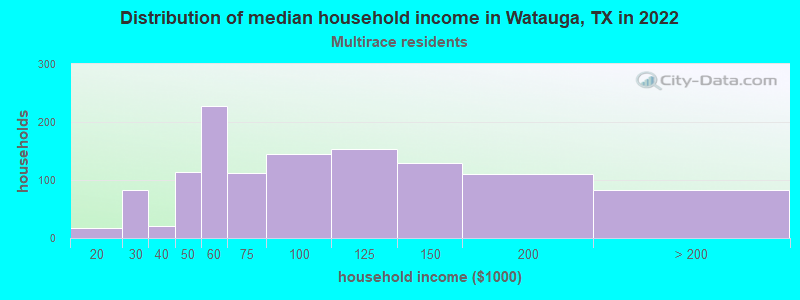
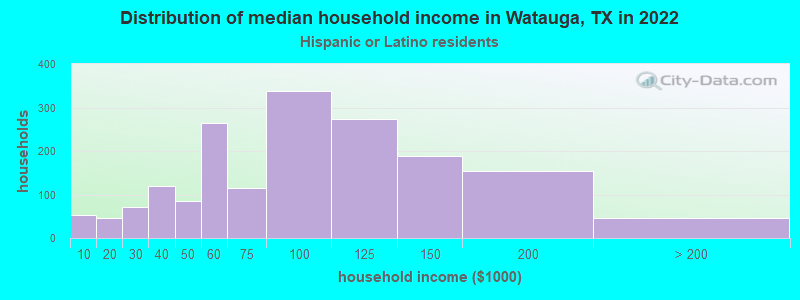
Income and house value in Watauga Median household income in 2022 $87,630 White non-Hispanic householders$73,668 Black householders$92,667 American Indian and Alaska Native householders$122,139 Asian householders$54,978 Some other race householders$72,981 Two or more races householders$76,779 Hispanic or Latino race householdersMedian 2022 house value $244,017 White Non-Hispanic householders$200,156 Black or African American householders$286,334 American Indian or Alaska Native householders $228,264 Asian householders$471,972 Native Hawaiian and other Pacific Islander householders$238,457 Some other race householders$247,723 Two or more races householders$239,693 Hispanic or Latino householders
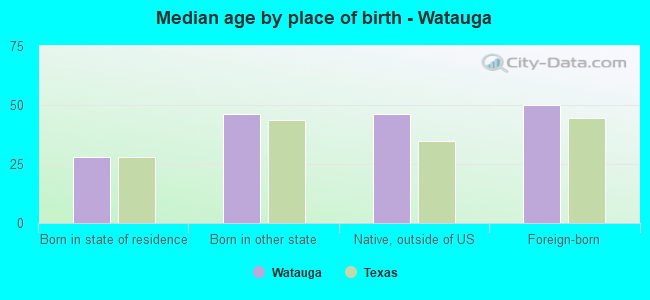
Median age by race in Watauga
41.1 Median age for White residents39.0 42.9 29.4 Median age for Black or African American residents25.4 30.8 29.9 Median age for American Indian / Alaska Native residents33.1 27.0 36.1 Median age for Asian residents36.8 35.2 -565,040,649.8 Median age for Native Hawaiian / Pacific Islander residents-550,102,248.9 -551,928,782.8 45.0 Median age for Other race residents32.0 50.2 23.3 Median age for Two or more races residents28.3 19.3 42.4 Median age for White alone residents41.7 42.8 28.2 Median age for Hispanic or Latino residents25.8 30.2
Owner/renter occupied households by race in Watauga
House owners and renters - White residents 4,436 79.4% Owner occupied1,148 20.6% Renter occupiedHouse owners and renters - Black or African American residents 267 55.1% Owner occupied218 44.9% Renter occupiedHouse owners and renters - American Indian / Alaska Native residents 150 91.7% Owner occupied14 8.3% Renter occupiedHouse owners and renters - Asian residents 148 65.6% Owner occupied78 34.4% Renter occupiedHouse owners and renters - Other race residents 338 89.0% Owner occupied42 11.0% Renter occupiedHouse owners and renters - Two or more races residents 939 77.7% Owner occupied269 22.3% Renter occupiedHouse owners and renters - White alone residents 4,223 79.3% Owner occupied1,099 20.7% Renter occupiedHouse owners and renters - Hispanic or Latino residents 1,448 79.2% Owner occupied380 20.8% Renter occupied
Language usage in Watauga
English speakers - Total 80.4% of residents of Watauga speak English at home.
15.4% of residents speak Spanish at home 2,109 60.9% Speak English very well1,355 39.1% Speak English less than very well3.9% of residents speak other language at home 652 73.8% Speak English very well232 26.2% Speak English less than very well
English speakers - Born in the United States 92.4% of residents of Watauga speak English at home.
6.9% of residents speak Spanish at home 320 69.4% Speak English very well141 30.6% Speak English less than very well0.3% of residents speak other language at home 20 100.0% Speak English very well
English speakers - Native, born elsewhere 56.6% of residents of Watauga speak English at home.
40.5% of residents speak Spanish at home 124 66.7% Speak English very well62 33.3% Speak English less than very well
English speakers - Foreign-born 17.8% of residents of Watauga speak English at home.
51.6% of residents speak Spanish at home 342 27.6% Speak English very well895 72.4% Speak English less than very well30.9% of residents speak other language at home 525 70.9% Speak English very well216 29.1% Speak English less than very well
White (Caucasian) - Speak only English Native:
97.3% (13,221)Foreign-born:
42.9% (118)
White (Caucasian) - Speak another language Native:
4.3% (591)Foreign-born:
65.5% (179)
Black or African American - Speak only English Native:
98.6% (1,583)Foreign-born:
73.1% (131)
American Indian / Alaska Native - Speak another language Native:
67.0% (234)Foreign-born:
100.0% (69)
Asian - Speak only English Native:
82.2% (142)Foreign-born:
17.2% (141)
Asian - Speak another language Native:
24.1% (42)Foreign-born:
83.6% (685)
Other race - Speak only English Native:
45.2% (279)Foreign-born:
8.9% (39)
Other race - Speak another language Native:
55.9% (345)Foreign-born:
91.4% (404)
Two or more races - Speak another language Native:
33.2% (1,143)Foreign-born:
100.0% (561)
White alone - Speak only English Native:
98.6% (12,608)Foreign-born:
100.0% (82)
White alone - Speak another language Native:
1.6% (202)Foreign-born:
10.9% (9)
Hispanic or Latino - Speak only English Native:
55.6% (2,624)Foreign-born:
6.0% (77)
Hispanic or Latino - Speak another language Native:
43.3% (2,046)Foreign-born:
93.9% (1,205)
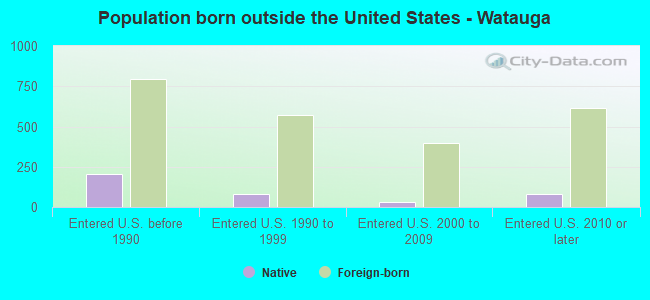
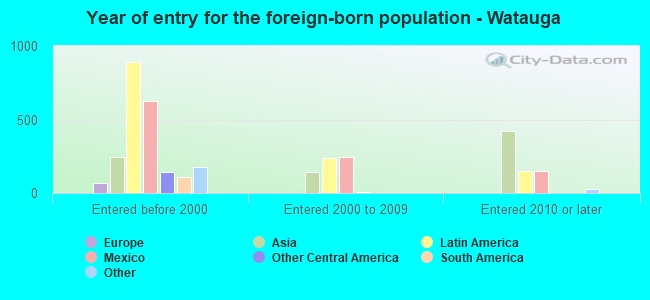
Foreign-born residents in Watauga 2,441 residents are foreign born (5.5% Latin America , 3.4% Asia ).
This city:
10.2%Texas:
17.1%
Marital status for residents in Watauga Marital status - White (Caucasian) population 15 years and over
Males 30.3% Never married53.2% Now married1.7% Separated1.9% Widowed12.9% DivorcedFemales 21.5% Never married55.3% Now married1.0% Separated7.9% Widowed14.5% DivorcedWomen who gave birth in the past 12 months Now married:
68.0% (71)Unmarried:
32.0% (33)
Women who did not give birth in the past 12 months Now married:
53.5% (1,508)Unmarried:
46.5% (1,309)
Marital status - Black or African American population 15 years and over
Males 49.1% Never married39.8% Now married1.7% Separated0.0% Widowed9.3% DivorcedFemales 39.2% Never married42.0% Now married0.0% Separated14.9% Widowed3.9% DivorcedWomen who gave birth in the past 12 months Now married:
100.0% (55)Unmarried:
0.0% (0)
Women who did not give birth in the past 12 months Now married:
35.0% (150)Unmarried:
65.0% (279)
Marital status - American Indian / Alaska Native population 15 years and over
Males 40.4% Never married59.6% Now married0.0% Separated0.0% Widowed0.0% DivorcedFemales 55.9% Never married26.1% Now married0.0% Separated3.6% Widowed14.4% DivorcedWomen who gave birth in the past 12 months Now married:
100.0% (10)Unmarried:
0.0% (0)
Women who did not give birth in the past 12 months Now married:
7.1% (17)Unmarried:
92.9% (224)
Marital status - Asian population 15 years and over
Males 41.7% Never married58.3% Now married0.0% Separated0.0% Widowed0.0% DivorcedFemales 16.3% Never married66.2% Now married0.0% Separated17.5% Widowed0.0% DivorcedWomen who gave birth in the past 12 months Now married:
100.0% (9)Unmarried:
0.0% (0)
Women who did not give birth in the past 12 months Now married:
72.1% (185)Unmarried:
27.9% (72)
Marital status - Other race population 15 years and over
Males 46.3% Never married39.0% Now married6.3% Separated0.0% Widowed8.3% DivorcedFemales 22.2% Never married51.6% Now married0.0% Separated7.1% Widowed19.1% DivorcedWomen who did not give birth in the past 12 months Now married:
53.7% (157)Unmarried:
46.3% (135)
Marital status - Two or more races population 15 years and over
Males 32.4% Never married53.5% Now married0.0% Separated0.0% Widowed14.1% DivorcedFemales 31.7% Never married49.8% Now married0.0% Separated4.7% Widowed13.8% DivorcedWomen who gave birth in the past 12 months Now married:
100.0% (31)Unmarried:
0.0% (0)
Women who did not give birth in the past 12 months Now married:
53.0% (524)Unmarried:
47.0% (465)
Marital status - White alone, not Hispanic / Latino population 15 years and over
Males 29.8% Never married53.4% Now married1.4% Separated2.0% Widowed13.5% DivorcedFemales 20.8% Never married54.6% Now married1.0% Separated8.4% Widowed15.3% DivorcedWomen who gave birth in the past 12 months Now married:
54.7% (45)Unmarried:
45.3% (38)
Women who did not give birth in the past 12 months Now married:
52.1% (1,385)Unmarried:
47.9% (1,275)
Marital status - Hispanic or Latino population 15 years and over
Males 38.9% Never married47.6% Now married3.2% Separated0.5% Widowed9.8% DivorcedFemales 28.1% Never married53.3% Now married0.3% Separated4.3% Widowed14.0% DivorcedWomen who gave birth in the past 12 months Now married:
100.0% (64)Unmarried:
0.0% (0)
Women who did not give birth in the past 12 months Now married:
53.2% (813)Unmarried:
46.8% (716)
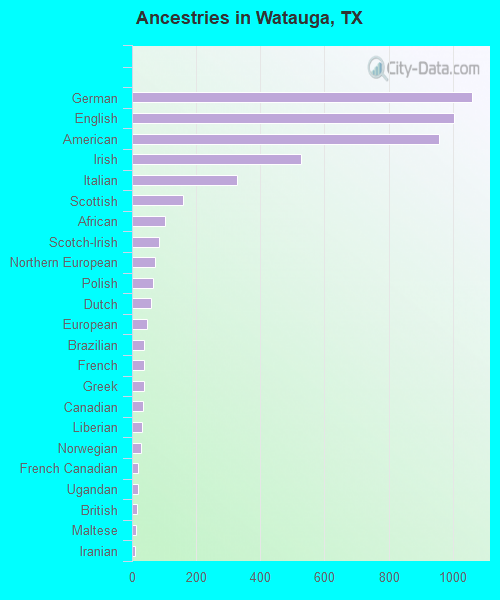
Ancestries in Watauga
1,060 8.3% German1,003 7.8% English956 7.5% American528 4.1% Irish327 2.6% Italian159 1.2% Scottish103 0.8% African83 0.6% Scotch-Irish71 0.6% Northern European67 0.5% Polish59 0.5% Dutch46 0.4% European38 0.3% Brazilian38 0.3% French36 0.3% Greek34 0.3% Canadian32 0.2% Liberian29 0.2% Norwegian20 0.2% French Canadian18 0.1% Ugandan15 0.1% British12 0.09% Maltese10 0.08% Iranian8 0.06% Swedish7 0.05% Czech7 0.05% Russian5 0.04% Romanian5 0.04% Scandinavian4 0.03% Slovak
Geographical mobility in Watauga Same house 1 year ago 12,501 88.5% White (Caucasian)1,640 86.3% Black or African American484 95.5% American Indian / Alaska Native1,026 98.0% Asian50 98.2% Native Hawaiian / Pacific Islander929 83.9% Other race4,032 87.8% Two or more races11,876 89.7% White alone, not Hispanic / Latino5,589 85.3% Hispanic or LatinoMoved within same county 1,023 7.2% White / Caucasian150 7.9% Black or African American7 1.4% American Indian / Alaska Native8 0.8% Asian102 9.2% Other race123 2.7% Two or more races912 6.9% White alone, not Hispanic / Latino433 6.6% Hispanic or LatinoMoved within same state 231 1.6% White / Caucasian15 0.8% Black or African American68 6.1% Other race425 9.3% Two or more races85 0.6% White alone, not Hispanic / Latino477 7.3% Hispanic or LatinoMoved from different state 310 2.2% White / Caucasian132 6.9% Black or African American30 5.9% American Indian / Alaska Native8 0.8% Asian306 2.3% White alone, not Hispanic / Latino32 0.5% Hispanic or LatinoMoved from abroad 7 0.0% White12 0.2% Hispanic or Latino
Children Nativity (place of birth) in Watauga
Children under 6 years - Living with two parents Both parents native 958 100.0% NativeBoth parents foreign-born 56 100.0% NativeOne native, one foreign-born parent 151 100.0% NativeChildren under 6 years - Living with one parent Native parent 323 98.6% Native5 1.4% Foreign-bornForeign-born parent 16 23.1% Native54 76.9% Foreign-bornChildren 6 to 17 years - Living with two parents Both parents native 1,887 99.9% Native2 0.1% Foreign-bornBoth parents foreign-born 450 89.2% Native54 10.8% Foreign-bornOne native, one foreign-born parent 279 100.0% NativeChildren 6 to 17 years - Living with one parent Native parent 1,083 98.6% Native15 1.4% Foreign-bornForeign-born parent 88 71.7% Native35 28.3% Foreign-born
Grandparents responsible for own grandchildren in Watauga
Grandparents (30 to 59 years) White / Caucasian 59 54.7% Responsible for grandchildren49 45.3% Not responsible for grandchildrenTwo or more races 160 91.7% Responsible for grandchildren14 8.3% Not responsible for grandchildrenWhite alone, not Hispanic / Latino 25 30.7% Responsible for grandchildren57 69.3% Not responsible for grandchildrenHispanic or Latino 145 96.8% Responsible for grandchildren5 3.2% Not responsible for grandchildrenGrandparents (60 years and over) White / Caucasian 26 46.6% Responsible for grandchildren30 53.4% Not responsible for grandchildrenTwo or more races 99 100.0% Not responsible for grandchildrenWhite alone, not Hispanic / Latino 28 47.7% Responsible for grandchildren31 52.3% Not responsible for grandchildrenHispanic or Latino 53 100.0% Not responsible for grandchildren