Races in Wolf Trap, Virginia (VA) Detailed Stats
Data:
Races - White alone (%)
Races - White alone (% change since 2000)
Races - Black alone (%)
Races - Black alone (% change since 2000)
Races - American Indian alone (%)
Races - American Indian alone (% change since 2000)
Races - Asian alone (%)
Races - Asian alone (% change since 2000)
Races - Hispanic (%)
Races - Hispanic (% change since 2000)
Races - Native Hawaiian and Other Pacific Islander alone (%)
Races - Native Hawaiian and Other Pacific Islander alone (% change since 2000)
Races - Two or more races(%)
Races - Two or more races(% change since 2000)
Races - Other race alone (%)
Races - Other race alone (% change since 2000)
Racial diversity
Place of birth - Born in state of residence (%)
Place of birth - Born in state of residence (%) - White
Place of birth - Born in state of residence (%) - Black or African American
Place of birth - Born in state of residence (%) - Asian
Place of birth - Born in state of residence (%) - Hispanic or Latino
Place of birth - Born in state of residence (%) - American Indian and Alaska Native
Place of birth - Born in state of residence (%) - Multirace
Place of birth - Born in state of residence (%) - Other Race
Place of birth - Born in other state (%)
Place of birth - Born in other state (%) - White
Place of birth - Born in other state (%) - Black or African American
Place of birth - Born in other state (%) - Asian
Place of birth - Born in other state (%) - Hispanic or Latino
Place of birth - Born in other state (%) - American Indian and Alaska Native
Place of birth - Born in other state (%) - Multirace
Place of birth - Born in other state (%) - Other Race
Place of birth - Native, outside of US (%)
Place of birth - Native, outside of US (%) - White
Place of birth - Native, outside of US (%) - Black or African American
Place of birth - Native, outside of US (%) - Asian
Place of birth - Native, outside of US (%) - Hispanic or Latino
Place of birth - Native, outside of US (%) - American Indian and Alaska Native
Place of birth - Native, outside of US (%) - Multirace
Place of birth - Native, outside of US (%) - Other Race
Place of birth - Foreign born (%)
Place of birth - Foreign born (%) - White
Place of birth - Foreign born (%) - Black or African American
Place of birth - Foreign born (%) - Asian
Place of birth - Foreign born (%) - Hispanic or Latino
Place of birth - Foreign born (%) - American Indian and Alaska Native
Place of birth - Foreign born (%) - Multirace
Place of birth - Foreign born (%) - Other Race
Residents speaking English at home (%)
Residents speaking English at home - Born in the United States (%)
Residents speaking English at home - Native, born elsewhere (%)
Residents speaking English at home - Foreign born (%)
Residents speaking Spanish at home (%)
Residents speaking Spanish at home - Born in the United States (%)
Residents speaking Spanish at home - Native, born elsewhere (%)
Residents speaking Spanish at home - Foreign born (%)
Residents speaking other language at home (%)
Residents speaking other language at home - Born in the United States (%)
Residents speaking other language at home - Native, born elsewhere (%)
Residents speaking other language at home - Foreign born (%)
Marital status - Never married (%)
Marital status - Now married (%)
Marital status - Separated (%)
Marital status - Widowed (%)
Marital status - Divorced (%)
Ancestries Reported - Arab (%)
Ancestries Reported - Czech (%)
Ancestries Reported - Danish (%)
Ancestries Reported - Dutch (%)
Ancestries Reported - English (%)
Ancestries Reported - French (%)
Ancestries Reported - French Canadian (%)
Ancestries Reported - German (%)
Ancestries Reported - Greek (%)
Ancestries Reported - Hungarian (%)
Ancestries Reported - Irish (%)
Ancestries Reported - Italian (%)
Ancestries Reported - Lithuanian (%)
Ancestries Reported - Norwegian (%)
Ancestries Reported - Polish (%)
Ancestries Reported - Portuguese (%)
Ancestries Reported - Russian (%)
Ancestries Reported - Scotch-Irish (%)
Ancestries Reported - Scottish (%)
Ancestries Reported - Slovak (%)
Ancestries Reported - Subsaharan African (%)
Ancestries Reported - Swedish (%)
Ancestries Reported - Swiss (%)
Ancestries Reported - Ukrainian (%)
Ancestries Reported - United States (%)
Ancestries Reported - Welsh (%)
Ancestries Reported - West Indian (%)
Ancestries Reported - Other (%)
Geographical mobility - Same house 1 year ago (%)
Geographical mobility - Same house 1 year ago (%) - White
Geographical mobility - Same house 1 year ago (%) - Black or African American
Geographical mobility - Same house 1 year ago (%) - Asian
Geographical mobility - Same house 1 year ago (%) - Hispanic or Latino
Geographical mobility - Same house 1 year ago (%) - American Indian and Alaska Native
Geographical mobility - Same house 1 year ago (%) - Multirace
Geographical mobility - Same house 1 year ago (%) - Other Race
Geographical mobility - Moved within same county (%)
Geographical mobility - Moved within same county (%) - White
Geographical mobility - Moved within same county (%) - Black or African American
Geographical mobility - Moved within same county (%) - Asian
Geographical mobility - Moved within same county (%) - Hispanic or Latino
Geographical mobility - Moved within same county (%) - American Indian and Alaska Native
Geographical mobility - Moved within same county (%) - Multirace
Geographical mobility - Moved within same county (%) - Other Race
Geographical mobility - Moved from different county within same state (%)
Geographical mobility - Moved from different county within same state (%) - White
Geographical mobility - Moved from different county within same state (%) - Black or African American
Geographical mobility - Moved from different county within same state (%) - Asian
Geographical mobility - Moved from different county within same state (%) - Hispanic or Latino
Geographical mobility - Moved from different county within same state (%) - American Indian and Alaska Native
Geographical mobility - Moved from different county within same state (%) - Multirace
Geographical mobility - Moved from different county within same state (%) - Other Race
Geographical mobility - Moved from different state (%)
Geographical mobility - Moved from different state (%) - White
Geographical mobility - Moved from different state (%) - Black or African American
Geographical mobility - Moved from different state (%) - Asian
Geographical mobility - Moved from different state (%) - Hispanic or Latino
Geographical mobility - Moved from different state (%) - American Indian and Alaska Native
Geographical mobility - Moved from different state (%) - Multirace
Geographical mobility - Moved from different state (%) - Other Race
Geographical mobility - Moved from abroad (%)
Geographical mobility - Moved from abroad (%) - White
Geographical mobility - Moved from abroad (%) - Black or African American
Geographical mobility - Moved from abroad (%) - Asian
Geographical mobility - Moved from abroad (%) - Hispanic or Latino
Geographical mobility - Moved from abroad (%) - American Indian and Alaska Native
Geographical mobility - Moved from abroad (%) - Multirace
Geographical mobility - Moved from abroad (%) - Other Race
Place of birth for the foreign-born population - Ireland (%)
Place of birth for the foreign-born population - Denmark (%)
Place of birth for the foreign-born population - Norway (%)
Place of birth for the foreign-born population - Sweden (%)
Place of birth for the foreign-born population - United Kingdom (%)
Place of birth for the foreign-born population - England (%)
Place of birth for the foreign-born population - Scotland (%)
Place of birth for the foreign-born population - Other Northern Europe (%)
Place of birth for the foreign-born population - Austria (%)
Place of birth for the foreign-born population - Belgium (%)
Place of birth for the foreign-born population - France (%)
Place of birth for the foreign-born population - Germany (%)
Place of birth for the foreign-born population - Netherlands (%)
Place of birth for the foreign-born population - Switzerland (%)
Place of birth for the foreign-born population - Other Western Europe (%)
Place of birth for the foreign-born population - Greece (%)
Place of birth for the foreign-born population - Italy (%)
Place of birth for the foreign-born population - Portugal (%)
Place of birth for the foreign-born population - Spain (%)
Place of birth for the foreign-born population - Other Southern Europe (%)
Place of birth for the foreign-born population - Albania (%)
Place of birth for the foreign-born population - Belarus (%)
Place of birth for the foreign-born population - Bosnia and Herzegovina (%)
Place of birth for the foreign-born population - Bulgaria (%)
Place of birth for the foreign-born population - Croatia (%)
Place of birth for the foreign-born population - Czechoslovakia (%)
Place of birth for the foreign-born population - Hungary (%)
Place of birth for the foreign-born population - Latvia (%)
Place of birth for the foreign-born population - Lithuania (%)
Place of birth for the foreign-born population - North Macedonia (Macedonia) (%)
Place of birth for the foreign-born population - Moldova (%)
Place of birth for the foreign-born population - Poland (%)
Place of birth for the foreign-born population - Romania (%)
Place of birth for the foreign-born population - Russia (%)
Place of birth for the foreign-born population - Serbia (%)
Place of birth for the foreign-born population - Ukraine (%)
Place of birth for the foreign-born population - Other Eastern Europe (%)
Place of birth for the foreign-born population - China (%)
Place of birth for the foreign-born population - Hong Kong (%)
Place of birth for the foreign-born population - Taiwan (%)
Place of birth for the foreign-born population - Japan (%)
Place of birth for the foreign-born population - Korea (%)
Place of birth for the foreign-born population - Other Eastern Asia (%)
Place of birth for the foreign-born population - Afghanistan (%)
Place of birth for the foreign-born population - Bangladesh (%)
Place of birth for the foreign-born population - India (%)
Place of birth for the foreign-born population - Iran (%)
Place of birth for the foreign-born population - Kazakhstan (%)
Place of birth for the foreign-born population - Nepal (%)
Place of birth for the foreign-born population - Pakistan (%)
Place of birth for the foreign-born population - Sri Lanka (%)
Place of birth for the foreign-born population - Uzbekistan (%)
Place of birth for the foreign-born population - Other South Central Asia (%)
Place of birth for the foreign-born population - Burma (%)
Place of birth for the foreign-born population - Cambodia (%)
Place of birth for the foreign-born population - Indonesia (%)
Place of birth for the foreign-born population - Laos (%)
Place of birth for the foreign-born population - Malaysia (%)
Place of birth for the foreign-born population - Philippines (%)
Place of birth for the foreign-born population - Singapore (%)
Place of birth for the foreign-born population - Thailand (%)
Place of birth for the foreign-born population - Vietnam (%)
Place of birth for the foreign-born population - Other South Eastern Asia (%)
Place of birth for the foreign-born population - Armenia (%)
Place of birth for the foreign-born population - Iraq (%)
Place of birth for the foreign-born population - Israel (%)
Place of birth for the foreign-born population - Jordan (%)
Place of birth for the foreign-born population - Kuwait (%)
Place of birth for the foreign-born population - Lebanon (%)
Place of birth for the foreign-born population - Saudi Arabia (%)
Place of birth for the foreign-born population - Syria (%)
Place of birth for the foreign-born population - Turkey (%)
Place of birth for the foreign-born population - Yemen (%)
Place of birth for the foreign-born population - Other Western Asia (%)
Place of birth for the foreign-born population - Eritrea (%)
Place of birth for the foreign-born population - Ethiopia (%)
Place of birth for the foreign-born population - Kenya (%)
Place of birth for the foreign-born population - Somalia (%)
Place of birth for the foreign-born population - Uganda (%)
Place of birth for the foreign-born population - Zimbabwe (%)
Place of birth for the foreign-born population - Other Eastern Africa (%)
Place of birth for the foreign-born population - Cameroon (%)
Place of birth for the foreign-born population - Congo (%)
Place of birth for the foreign-born population - Democratic Republic of Congo (Zaire) (%)
Place of birth for the foreign-born population - Other Middle Africa (%)
Place of birth for the foreign-born population - Egypt (%)
Place of birth for the foreign-born population - Morocco (%)
Place of birth for the foreign-born population - Sudan (%)
Place of birth for the foreign-born population - Other Northern Africa (%)
Place of birth for the foreign-born population - South Africa (%)
Place of birth for the foreign-born population - Other Southern Africa (%)
Place of birth for the foreign-born population - Cabo Verde (%)
Place of birth for the foreign-born population - Ghana (%)
Place of birth for the foreign-born population - Liberia (%)
Place of birth for the foreign-born population - Nigeria (%)
Place of birth for the foreign-born population - Senegal (%)
Place of birth for the foreign-born population - Sierra Leone (%)
Place of birth for the foreign-born population - Other Western Africa (%)
Place of birth for the foreign-born population - Australia (%)
Place of birth for the foreign-born population - New Zealand (%)
Place of birth for the foreign-born population - Fiji (%)
Place of birth for the foreign-born population - Micronesia (%)
Place of birth for the foreign-born population - Bahamas (%)
Place of birth for the foreign-born population - Barbados (%)
Place of birth for the foreign-born population - Cuba (%)
Place of birth for the foreign-born population - Dominica (%)
Place of birth for the foreign-born population - Dominican Republic (%)
Place of birth for the foreign-born population - Grenada (%)
Place of birth for the foreign-born population - Haiti (%)
Place of birth for the foreign-born population - Jamaica (%)
Place of birth for the foreign-born population - St. Vincent and the Grenadines (%)
Place of birth for the foreign-born population - Trinidad and Tobago (%)
Place of birth for the foreign-born population - West Indies (%)
Place of birth for the foreign-born population - Other Caribbean (%)
Place of birth for the foreign-born population - Belize (%)
Place of birth for the foreign-born population - Costa Rica (%)
Place of birth for the foreign-born population - El Salvador (%)
Place of birth for the foreign-born population - Guatemala (%)
Place of birth for the foreign-born population - Honduras (%)
Place of birth for the foreign-born population - Mexico (%)
Place of birth for the foreign-born population - Nicaragua (%)
Place of birth for the foreign-born population - Panama (%)
Place of birth for the foreign-born population - Other Central America (%)
Place of birth for the foreign-born population - Argentina (%)
Place of birth for the foreign-born population - Bolivia (%)
Place of birth for the foreign-born population - Brazil (%)
Place of birth for the foreign-born population - Chile (%)
Place of birth for the foreign-born population - Colombia (%)
Place of birth for the foreign-born population - Ecuador (%)
Place of birth for the foreign-born population - Guyana (%)
Place of birth for the foreign-born population - Peru (%)
Place of birth for the foreign-born population - Uruguay (%)
Place of birth for the foreign-born population - Venezuela (%)
Place of birth for the foreign-born population - Other South America (%)
Place of birth for the foreign-born population - Canada (%)
Place of birth for the foreign-born population - Other Northern America (%)
Place of birth for the foreign-born population - Other (%)
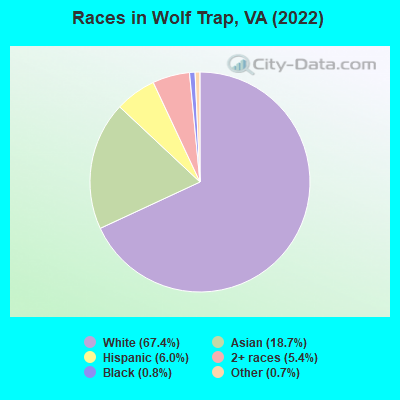
According to 2022 data, the most numerous races in Wolf Trap, VA are White alone (10,522 residents), Black alone (125 residents), and Hispanic (936 residents). 76.3% of Wolf Trap residents speak English at home. 24.7% of Wolf Trap, VA residents are foreign-born (15.5% born in Asia, 4.6% born in Europe, 3.2% born in Latin America), which is 51.3% greater than the foreign-born rate of 12.0% across the entire state of Virginia.
Race distribution in Wolf Trap
2000 2022
4,965,637 70.2% White alone 1,376,378 19.4% Black alone 329,540 4.7% Hispanic 259,277 3.7% Asian alone 114,022 1.6% Two or more races 18,596 0.3% American Indian alone 11,685 0.2% Other race alone 3,380 0.05% Native Hawaiian and Other
5,095,130 58.7% White alone 1,594,785 18.4% Black alone 905,750 10.4% Hispanic 602,881 6.9% Asian alone 406,047 4.7% Two or more races 60,419 0.7% Other race alone 11,738 0.1% American Indian alone 6,869 0.08% Native Hawaiian and Other
Income and house value in Wolf Trap Median household income in 2022 over $200,000 White non-Hispanic householdersover $200,000 Asian householders$182,698 Hispanic or Latino race householdersMedian 2022 house value over $1,000,000 White Non-Hispanic householders$798,108 Black or African American householders$668,059 American Indian or Alaska Native householders over $1,000,000 Asian householdersover $1,000,000 Some other race householders$972,397 Two or more races householdersover $1,000,000 Hispanic or Latino householders
Median age by race in Wolf Trap
50.5 Median age for White residents49.5 51.4 45.0 Median age for Black or African American residents44.1 50.8 -754,182,753.4 Median age for American Indian / Alaska Native residents-964,539,006.1 -669,005,847.3 48.7 Median age for Asian residents45.9 49.5 -666,666,666.0 Median age for Native Hawaiian / Pacific Islander residents-558,791,801.0 -584,518,166.9 13.2 Median age for Other race residents13.6 13.0 15.9 Median age for Two or more races residents18.6 14.5 50.2 Median age for White alone residents49.5 51.2 37.6 Median age for Hispanic or Latino residents42.7 37.1
Owner/renter occupied households by race in Wolf Trap
House owners and renters - White residents 3,989 96.1% Owner occupied162 3.9% Renter occupiedHouse owners and renters - Black or African American residents 22 34.8% Owner occupied42 65.2% Renter occupiedHouse owners and renters - American Indian / Alaska Native residents 11 100.0% Renter occupiedHouse owners and renters - Asian residents 812 96.9% Owner occupied26 3.1% Renter occupiedHouse owners and renters - Other race residents 13 100.0% Owner occupiedHouse owners and renters - Two or more races residents 221 93.3% Owner occupied16 6.7% Renter occupiedHouse owners and renters - White alone residents 4,009 96.6% Owner occupied140 3.4% Renter occupiedHouse owners and renters - Hispanic or Latino residents 229 80.4% Owner occupied56 19.6% Renter occupied
Language usage in Wolf Trap
English speakers - Total 76.3% of residents of Wolf Trap speak English at home.
3.7% of residents speak Spanish at home 401 72.0% Speak English very well156 28.0% Speak English less than very well20.6% of residents speak other language at home 2,109 68.9% Speak English very well952 31.1% Speak English less than very well
English speakers - Born in the United States 93.0% of residents of Wolf Trap speak English at home.
1.3% of residents speak Spanish at home 99 100.0% Speak English very well5.6% of residents speak other language at home 334 81.3% Speak English very well77 18.7% Speak English less than very well
English speakers - Native, born elsewhere 89.7% of residents of Wolf Trap speak English at home.
5.1% of residents speak Spanish at home 18 100.0% Speak English very well2.0% of residents speak other language at home 7 100.0% Speak English very well
English speakers - Foreign-born 29.9% of residents of Wolf Trap speak English at home.
10.2% of residents speak Spanish at home 241 61.0% Speak English very well154 39.0% Speak English less than very well61.7% of residents speak other language at home 1,543 64.8% Speak English very well838 35.2% Speak English less than very well
White (Caucasian) - Speak only English Native:
97.6% (8,628)Foreign-born:
52.9% (553)
White (Caucasian) - Speak another language Native:
3.6% (317)Foreign-born:
56.9% (595)
Asian - Speak only English Native:
60.5% (550)Foreign-born:
18.4% (360)
Asian - Speak another language Native:
38.5% (350)Foreign-born:
82.3% (1,608)
Other race - Speak only English Native:
100.0% (85)Foreign-born:
86.2% (40)
Two or more races - Speak only English Native:
89.9% (764)Foreign-born:
29.0% (128)
Two or more races - Speak another language Native:
8.9% (76)Foreign-born:
70.6% (312)
White alone - Speak only English Native:
96.6% (8,569)Foreign-born:
47.3% (563)
White alone - Speak another language Native:
3.6% (319)Foreign-born:
55.5% (661)
Hispanic or Latino - Speak only English Native:
77.3% (329)Foreign-born:
15.0% (63)
Hispanic or Latino - Speak another language Native:
28.1% (120)Foreign-born:
85.2% (358)
Foreign-born residents in Wolf Trap 3,851 residents are foreign born (15.5% Asia , 4.6% Europe , 3.2% Latin America ).
This city:
24.7%Virginia:
12.6%
Marital status for residents in Wolf Trap Marital status - White (Caucasian) population 15 years and over
Males 20.1% Never married74.1% Now married0.1% Separated1.4% Widowed4.3% DivorcedFemales 17.6% Never married69.3% Now married0.8% Separated7.0% Widowed5.2% DivorcedWomen who gave birth in the past 12 months Now married:
100.0% (80)Unmarried:
0.0% (0)
Women who did not give birth in the past 12 months Now married:
54.3% (849)Unmarried:
45.7% (714)
Marital status - Black or African American population 15 years and over
Males 16.4% Never married34.4% Now married0.0% Separated0.0% Widowed49.2% DivorcedFemales 0.0% Never married62.5% Now married0.0% Separated37.5% Widowed0.0% DivorcedWomen who gave birth in the past 12 months Now married:
100.0% (9)Unmarried:
0.0% (0)
Women who did not give birth in the past 12 months Now married:
100.0% (9)Unmarried:
0.0% (0)
Marital status - Asian population 15 years and over
Males 24.7% Never married72.4% Now married0.0% Separated1.8% Widowed1.1% DivorcedFemales 15.7% Never married69.5% Now married0.4% Separated10.9% Widowed3.5% DivorcedWomen who gave birth in the past 12 months Now married:
100.0% (33)Unmarried:
0.0% (0)
Women who did not give birth in the past 12 months Now married:
64.2% (409)Unmarried:
35.8% (228)
Marital status - Other race population 15 years and over
Males 100.0% Never married0.0% Now married0.0% Separated0.0% Widowed0.0% DivorcedFemales 66.7% Never married33.3% Now married0.0% Separated0.0% Widowed0.0% DivorcedWomen who did not give birth in the past 12 months Now married:
4.3% (1)Unmarried:
95.7% (27)
Marital status - Two or more races population 15 years and over
Males 34.7% Never married46.4% Now married0.0% Separated0.0% Widowed18.8% DivorcedFemales 39.9% Never married53.4% Now married0.0% Separated6.8% Widowed0.0% DivorcedWomen who did not give birth in the past 12 months Now married:
55.0% (155)Unmarried:
45.0% (127)
Marital status - White alone, not Hispanic / Latino population 15 years and over
Males 19.8% Never married74.3% Now married0.1% Separated1.5% Widowed4.4% DivorcedFemales 16.6% Never married70.9% Now married0.9% Separated7.2% Widowed4.4% DivorcedWomen who gave birth in the past 12 months Now married:
100.0% (65)Unmarried:
0.0% (0)
Women who did not give birth in the past 12 months Now married:
55.7% (873)Unmarried:
44.3% (696)
Marital status - Hispanic or Latino population 15 years and over
Males 19.9% Never married59.4% Now married0.0% Separated0.0% Widowed20.7% DivorcedFemales 27.6% Never married51.9% Now married0.0% Separated8.0% Widowed12.5% DivorcedWomen who gave birth in the past 12 months Now married:
100.0% (23)Unmarried:
0.0% (0)
Women who did not give birth in the past 12 months Now married:
51.8% (99)Unmarried:
48.2% (92)
Ancestries in Wolf Trap
742 10.1% American699 9.5% English503 6.8% Irish350 4.8% German234 3.2% Iranian208 2.8% Italian196 2.7% European187 2.5% Syrian143 1.9% Polish117 1.6% French112 1.5% Eastern European101 1.4% British99 1.3% Scottish98 1.3% Lebanese85 1.2% Romanian83 1.1% Greek64 0.9% Scotch-Irish63 0.9% Norwegian55 0.7% Russian52 0.7% Swedish37 0.5% Northern European30 0.4% French Canadian29 0.4% Scandinavian28 0.4% Lithuanian28 0.4% Dutch26 0.4% Hungarian26 0.4% Slavic25 0.3% Bulgarian25 0.3% Ethiopian24 0.3% Austrian18 0.2% Danish13 0.2% Belgian13 0.2% Czech12 0.2% Carpatho Rusyn12 0.2% Slovak11 0.1% Ukrainian10 0.1% Serbian9 0.1% Celtic8 0.1% Trinidadian and Tobagonian7 0.10% Brazilian7 0.10% Portuguese7 0.10% Turkish6 0.08% Canadian6 0.08% Arab6 0.08% Pennsylvania German6 0.08% Slovene5 0.07% Egyptian4 0.05% Welsh1 0.01% Afghan
Children Nativity (place of birth) in Wolf Trap
Children under 6 years - Living with two parents Both parents native 554 100.0% NativeBoth parents foreign-born 194 100.0% NativeOne native, one foreign-born parent 177 100.0% NativeChildren under 6 years - Living with one parent Native parent 27 100.0% NativeForeign-born parent 3 100.0% NativeChildren 6 to 17 years - Living with two parents Both parents native 1,443 94.8% Native79 5.2% Foreign-bornBoth parents foreign-born 357 62.3% Native216 37.7% Foreign-bornOne native, one foreign-born parent 553 98.1% Native11 1.9% Foreign-bornChildren 6 to 17 years - Living with one parent Native parent 129 100.0% NativeForeign-born parent 53 51.3% Native50 48.7% Foreign-born
Grandparents responsible for own grandchildren in Wolf Trap
Grandparents (30 to 59 years) White / Caucasian 1 14.6% Responsible for grandchildren5 85.4% Not responsible for grandchildrenAsian 44 100.0% Not responsible for grandchildrenWhite alone, not Hispanic / Latino 2 100.0% Responsible for grandchildrenHispanic or Latino 8 100.0% Not responsible for grandchildrenGrandparents (60 years and over) White / Caucasian 34 51.5% Responsible for grandchildren32 48.5% Not responsible for grandchildrenAsian 24 100.0% Not responsible for grandchildrenWhite alone, not Hispanic / Latino 38 59.9% Responsible for grandchildren25 40.1% Not responsible for grandchildrenHispanic or Latino 20 100.0% Not responsible for grandchildren