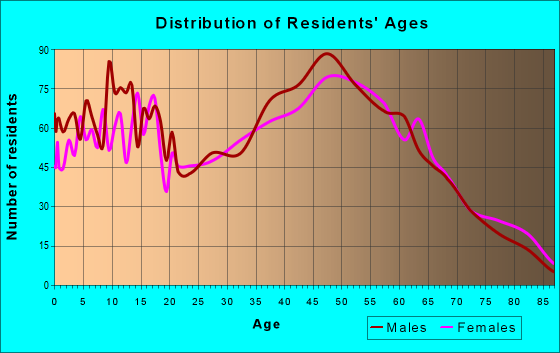
Estimated zip code population in 2022: 9,571 Zip code population in 2010: 9,356 Zip code population in 2000: 8,623
Houses and condos: 3,850 Renter-occupied apartments: 421
% of renters here:
11%
State:
27%
March 2022 cost of living index in zip code 48074: 91.8 (less than average, U.S. average is 100)
Land area: 37.1 sq. mi. Water area: 0.3 sq. mi.
Population density: 258 people per square mile
(very low).
OSM Map
General Map
Google Map
MSN Map
OSM Map
General Map
Google Map
MSN Map
OSM Map
General Map
Google Map
MSN Map
OSM Map
General Map
Google Map
MSN Map
Please wait while loading the map...
Real estate property taxes paid for housing units in 2022:
This zip code:
0.9% ($1,708)
Michigan:
1.2% ($2,746)
Median real estate property taxes paid for housing units with mortgages in 2022: $1,832 (0.9%) Median real estate property taxes paid for housing units with no mortgage in 2022: $1,544 (1.1%)
Averages for the 2020 tax year for zip code 48074, filed in 2021:
Average Adjusted Gross Income (AGI) in 2020: $52,518 (Individual Income Tax Returns)
Here:
$52,518
State:
$68,945
Salary/wage: $49,031 (reported on 78.2% of returns)
Here:
$49,031
State:
$57,142
(% of AGI for various income ranges: 868.5% for AGIs below $25k, 3060.3% for AGIs $25k-50k, 5848.5% for AGIs $50k-75k, 9106.5% for AGIs $75k-100k, 15921.2% for AGIs $100k-200k, 64015.0% for AGIs over 200k)
Taxable interest for individuals: $754 (reported on 25.1% of returns)
This zip code:
$754
Michigan:
$1,630
(% of AGI for various income ranges: 11.4% for AGIs below $25k, 17.5% for AGIs $25k-50k, 20.5% for AGIs $50k-75k, 16.5% for AGIs $75k-100k, 76.2% for AGIs $100k-200k, 600.0% for AGIs over 200k)
Ordinary dividends: $1,781 (reported on 11.8% of returns)
Here:
$1,781
State:
$6,972
(% of AGI for various income ranges: 11.5% for AGIs below $25k, 16.1% for AGIs $25k-50k, 27.2% for AGIs $50k-75k, 50.5% for AGIs $75k-100k, 73.5% for AGIs $100k-200k, 425.0% for AGIs over 200k)
Net capital gain/loss in AGI: +$6,062 (reported on 10.6% of returns)
Here:
+$6,062
State:
+$20,064
(% of AGI for various income ranges: 17.4% for AGIs $25k-50k, 26.2% for AGIs $50k-75k, 94.6% for AGIs $75k-100k, 298.0% for AGIs $100k-200k, 6400.0% for AGIs over 200k)
Profit/loss from business: +$7,101 (reported on 13.9% of returns)
Here:
+$7,101
State:
+$11,172
(% of AGI for various income ranges: 86.7% for AGIs below $25k, 106.3% for AGIs $25k-50k, 189.0% for AGIs $50k-75k, 139.7% for AGIs $75k-100k, 261.2% for AGIs $100k-200k)
Taxable individual retirement arrangement distribution: $14,511 (reported on 7.8% of returns)
48074:
$14,511
Michigan:
$19,803
(% of AGI for various income ranges: 52.0% for AGIs below $25k, 85.4% for AGIs $25k-50k, 150.5% for AGIs $50k-75k, 253.0% for AGIs $75k-100k, 541.8% for AGIs $100k-200k)
Total itemized deductions: $24,064 (reported on 2.9% of returns)
Here:
$24,064
State:
$34,117
(% of AGI for various income ranges: 44.2% for AGIs $25k-50k, 127.0% for AGIs $50k-75k, 155.4% for AGIs $75k-100k, 391.0% for AGIs $100k-200k)
Charity contributions: $7,220 (reported on 2.0% of returns)
Here:
$7,220
State:
$13,548
(% of AGI for various income ranges: 31.5% for AGIs $50k-75k, 133.2% for AGIs $100k-200k)
Taxes paid: $6,371 (reported on 2.9% of returns)
48074:
$6,371
State:
$7,972
(% of AGI for various income ranges: 9.1% for AGIs $25k-50k, 27.5% for AGIs $50k-75k, 44.6% for AGIs $75k-100k, 116.5% for AGIs $100k-200k)
Earned income credit: $1,975 (reported on 13.7% of returns)
Here:
$1,975
State:
$2,251
(% of AGI for various income ranges: 59.5% for AGIs below $25k, 58.6% for AGIs $25k-50k, 2.0% for AGIs $50k-75k)
Percentage of individuals using paid preparers for their 2020 taxes: 94.1%
Here:
94%
State:
93%
(% for various income ranges: 91.8% for AGIs below $25k, 94.5% for AGIs $25k-50k, 94.8% for AGIs $50k-75k, 95.9% for AGIs $75k-100k, 96.7% for AGIs $100k-200k, 100.0% for AGIs over 200k)
Averages for the 2012 tax year for zip code 48074, filed in 2013:
Average Adjusted Gross Income (AGI) in 2012: $43,342 (Individual Income Tax Returns)
Here:
$43,342
State:
$55,609
Salary/wage: $40,651 (reported on 84.0% of returns)
Here:
$40,651
State:
$46,782
(% of AGI for various income ranges: 68.0% for AGIs below $25k, 76.1% for AGIs $25k-50k, 80.6% for AGIs $50k-75k, 83.2% for AGIs $75k-100k, 84.9% for AGIs $100k-200k, 59.0% for AGIs over 200k)
Taxable interest for individuals: $720 (reported on 25.9% of returns)
This zip code:
$720
Michigan:
$1,491
(% of AGI for various income ranges: 0.9% for AGIs below $25k, 0.4% for AGIs $25k-50k, 0.3% for AGIs $50k-75k, 0.6% for AGIs $75k-100k, 0.3% for AGIs $100k-200k)
Ordinary dividends: $1,524 (reported on 12.5% of returns)
Here:
$1,524
State:
$6,225
(% of AGI for various income ranges: 0.7% for AGIs below $25k, 0.3% for AGIs $25k-50k, 0.4% for AGIs $50k-75k, 0.6% for AGIs $75k-100k, 0.5% for AGIs $100k-200k)
Net capital gain/loss in AGI: +$692 (reported on 8.3% of returns)
Here:
+$692
State:
+$9,326
(% of AGI for various income ranges: 0.2% for AGIs $25k-50k, 0.2% for AGIs $75k-100k, 0.2% for AGIs $100k-200k)
Profit/loss from business: +$6,938 (reported on 12.3% of returns)
Here:
+$6,938
State:
+$11,523
(% of AGI for various income ranges: 5.5% for AGIs below $25k, 2.5% for AGIs $25k-50k, 1.0% for AGIs $50k-75k, 0.8% for AGIs $75k-100k, 1.9% for AGIs $100k-200k)
Taxable individual retirement arrangement distribution: $9,914 (reported on 10.0% of returns)
48074:
$9,914
Michigan:
$15,298
(% of AGI for various income ranges: 3.0% for AGIs below $25k, 2.7% for AGIs $25k-50k, 1.6% for AGIs $50k-75k, 2.9% for AGIs $75k-100k, 2.1% for AGIs $100k-200k)
Total itemized deductions: $17,364 (22% of AGI, reported on 27.5% of returns)
Here:
$17,364
State:
$21,628
Here:
22.1% of AGI
State:
18.4% of AGI
(% of AGI for various income ranges: 7.2% for AGIs below $25k, 9.0% for AGIs $25k-50k, 10.8% for AGIs $50k-75k, 12.8% for AGIs $75k-100k, 13.1% for AGIs $100k-200k, 12.9% for AGIs over 200k)
Charity contributions: $2,114 (reported on 21.5% of returns)
Here:
$2,114
State:
$4,225
(% of AGI for various income ranges: 0.6% for AGIs below $25k, 0.7% for AGIs $25k-50k, 1.2% for AGIs $50k-75k, 1.1% for AGIs $75k-100k, 1.5% for AGIs $100k-200k, 0.7% for AGIs over 200k)
Taxes paid: $5,386 (reported on 27.5% of returns)
48074:
$5,386
State:
$8,327
(% of AGI for various income ranges: 1.3% for AGIs below $25k, 2.0% for AGIs $25k-50k, 3.1% for AGIs $50k-75k, 4.1% for AGIs $75k-100k, 5.1% for AGIs $100k-200k, 5.1% for AGIs over 200k)
Earned income credit: $1,924 (reported on 18.5% of returns)
Here:
$1,924
State:
$2,306
(% of AGI for various income ranges: 5.1% for AGIs below $25k, 1.1% for AGIs $25k-50k)
Percentage of individuals using paid preparers for their 2012 taxes: 58.6%
Here:
59%
State:
57%
(% for various income ranges: 54.3% for AGIs below $25k, 60.0% for AGIs $25k-50k, 60.9% for AGIs $50k-75k, 63.4% for AGIs $75k-100k, 71.4% for AGIs $100k-200k)
Averages for the 2004 tax year for zip code 48074, filed in 2005:
Average Adjusted Gross Income (AGI) in 2004: $39,056 (Individual Income Tax Returns)
Here:
$39,056
State:
$48,204
Salary/wage: $37,647 (reported on 88.3% of returns)
Here:
$37,647
State:
$42,791
(% of AGI for various income ranges: 100.2% for AGIs below $10k, 73.6% for AGIs $10k-25k, 82.3% for AGIs $25k-50k, 88.5% for AGIs $50k-75k, 89.9% for AGIs $75k-100k, 83.7% for AGIs over 100k)
Taxable interest for individuals: $754 (reported on 44.0% of returns)
This zip code:
$754
Michigan:
$1,725
(% of AGI for various income ranges: 2.9% for AGIs below $10k, 1.9% for AGIs $10k-25k, 0.9% for AGIs $25k-50k, 0.6% for AGIs $50k-75k, 0.5% for AGIs $75k-100k, 0.8% for AGIs over 100k)
Taxable dividends: $988 (reported on 16.8% of returns)
Here:
$988
State:
$3,420
(% of AGI for various income ranges: 1.4% for AGIs below $10k, 0.8% for AGIs $10k-25k, 0.4% for AGIs $25k-50k, 0.4% for AGIs $50k-75k, 0.4% for AGIs $75k-100k, 0.3% for AGIs over 100k)
Net capital gain/loss: +$2,905 (reported on 11.2% of returns)
Here:
+$2,905
State:
+$8,532
(% of AGI for various income ranges: -1.1% for AGIs below $10k, -0.1% for AGIs $10k-25k, 0.4% for AGIs $25k-50k, 0.5% for AGIs $50k-75k, 0.7% for AGIs $75k-100k, 2.9% for AGIs over 100k)
Profit/loss from business: +$3,408 (reported on 12.0% of returns)
Here:
+$3,408
State:
+$9,547
(% of AGI for various income ranges: 0.4% for AGIs below $10k, 3.7% for AGIs $10k-25k, 1.8% for AGIs $25k-50k, 0.6% for AGIs $50k-75k, 0.4% for AGIs $75k-100k, -0.1% for AGIs over 100k)
IRA payment deduction: $1,977 (reported on 2.0% of returns)
48074:
$1,977
Michigan:
$2,875
(% of AGI for various income ranges: 0.2% for AGIs $10k-25k, 0.2% for AGIs $25k-50k, 0.1% for AGIs $50k-75k, 0.1% for AGIs $75k-100k)
Total itemized deductions: $15,016 (23% of AGI, reported on 34.7% of returns)
Here:
$15,016
State:
$18,509
Here:
23.1% of AGI
State:
20.7% of AGI
(% of AGI for various income ranges: 6.3% for AGIs below $10k, 9.2% for AGIs $10k-25k, 11.9% for AGIs $25k-50k, 14.5% for AGIs $50k-75k, 15.9% for AGIs $75k-100k, 14.0% for AGIs over 100k)
Charity contributions deductions: $1,640 (2% of AGI, reported on 30.7% of returns)
Here:
$1,640
State:
$3,365
Here:
2.4% of AGI
State:
3.6% of AGI
(% of AGI for various income ranges: 0.2% for AGIs below $10k, 0.7% for AGIs $10k-25k, 1.0% for AGIs $25k-50k, 1.3% for AGIs $50k-75k, 1.7% for AGIs $75k-100k, 1.7% for AGIs over 100k)
Total tax: $4,430 (reported on 76.4% of returns)
48074:
$4,430
State:
$7,691
(% of AGI for various income ranges: 2.7% for AGIs below $10k, 4.1% for AGIs $10k-25k, 6.6% for AGIs $25k-50k, 8.5% for AGIs $50k-75k, 9.7% for AGIs $75k-100k, 14.4% for AGIs over 100k)
Earned income credit: $1,527 (reported on 13.3% of returns)
Here:
$1,527
State:
$1,737
Percentage of individuals using paid preparers for their 2004 taxes: 61.6%
Here:
62%
State:
60%
(% for various income ranges: 50.5% for AGIs below $10k, 62.9% for AGIs $10k-25k, 64.9% for AGIs $25k-50k, 65.2% for AGIs $50k-75k, 64.1% for AGIs $75k-100k, 64.5% for AGIs over 100k)
Likely homosexual households (counted as self-reported same-sex unmarried-partner households)
Lesbian couples: 0.6% of all households
Gay men: 0.0% of all households
Household received Food Stamps/SNAP in the past 12 months: 554 Household did not receive Food Stamps/SNAP in the past 12 months: 3,280
Women who had a birth in the past 12 months: 168 (85 now married, 80 unmarried) Women who did not have a birth in the past 12 months: 1,889 (830 now married, 1,057 unmarried)
Housing units in zip code 48074 with a mortgage: 1,893 (146 second mortgage, 142 both second mortgage and home equity loan) Houses without a mortgage: 106
Median monthly owner costs for units with a mortgage: $1,237 Median monthly owner costs for units without a mortgage: $485
Residents with income below the poverty level in 2022:
This zip code:
10.5%
Whole state:
13.4%
Residents with income below 50% of the poverty level in 2022:
This zip code:
4.3%
Whole state:
6.9%
Median number of rooms in houses and condos:
Here:
6.1
State:
6.5
Median number of rooms in apartments:
Here:
6.0
State:
4.3
Notable locations in this zip code not listed on our city pages
Notable locations in zip code 48074: Fore Lakes Golf Club (A), Port Huron KOA Campgrounds (B), Smiths Creek Station (C), Tri - Hospital Emergency Medical Services Station 5 (D), G Lynn Campbell Library (E), Kimball Township Fire Department Station 1 (F), Kimball Township Fire Department Station 2 (G). Display/hide their locations on the map
Churches in zip code 48074 include: Holy Rosary Church (A), Kimball Calvary Gospel Church (B), Community Independent Baptist Church (C), Life in Christ Church (D), Sparlingville Wesleyan Church (E), New Hope All Nation Apostolic Holiness Church (F), Wadhams Baptist Church (G), All Faiths Church (H), Smiths Creek Community Church (I). Display/hide their locations on the map
Streams, rivers, and creeks: Morris Drain (A), South Branch Pine River (B), Scheffle Drain (C), Liverance Drain (D), Big Creek (E), Nelson Drain (F). Display/hide their locations on the map
1,268 married couples with children.
409 single-parent households (200 men, 209 women).
97.5% of residents of 48074 zip code speak English at home.
1.2% of residents speak Spanish at home (100% very well).
0.6% of residents speak other Indo-European language at home (78% very well, 22% not well).
0.4% of residents speak Asian or Pacific Island language at home (100% very well).
Foreign born population: 97 (1.0%) (26.2% of them are naturalized citizens)
This zip code:
1.0%
Whole state:
6.9%
13%Bolivia
12%Malaysia
12%Ethiopia
7%France
30%German
15%American
13%English
10%Polish
4%European
4%Swedish
3%French Canadian
Year of entry for the foreign-born population
342010 or later
142000 to 2009
91990 to 1999
93Before 1990
Public high school in in zip code 48074 not listed on the city page:
Facilities with environmental interests located in this zip code:
BARRETT PAVING MATERIALS INCORPORATED (2376 WADHAMS ROAD in SMITHS CREEK, MI)
AIR SYNTHETIC MINOR (AIRS/AFS) CRITERIA AND HAZARDOUS AIR POLLUTANT INVENTORY (Inventory of air pollution sources) (Resource Conservation and Recovery Act (tracking hazardous waste)) Business SIC classification: ASPHALT PAVING MIXTURES AND BLOCKS Business NAICS classification: ASPHALT PAVING MIXTURE AND BLOCK MANUFACTURING.; ASPHALT PAVING MIXTURE AND BLOCK MANUFACTURING. Alternative names: MOLESWORTH PAVING CO
CF INDUSTRIES INC (2600 WADHAMS ROAD in KIMBALL, MI)
AIR MINOR (AIRS/AFS) Conditionally Exempt Small Quantity Generators, less than 100 kg/month of hazardous waste (Resource Conservation and Recovery Act (tracking hazardous waste)) Business SIC classification: FARM SUPPLIES Alternative names: CF INDUSTRIES INCORPORATED PORT HURON TERMINAL
EVANS MINING CORP (1900 RICHMAN RD in SMITHS CREEK, MI)
AIR MINOR (AIRS/AFS) (Resource Conservation and Recovery Act (tracking hazardous waste)) Business SIC classification: CONSTRUCTION SAND AND GRAVEL Business NAICS classification: MINING MACHINERY AND EQUIPMENT MANUFACTURING.
BATTON ENTERPRISES (42 N AIRPORT RD in SMITHS CREEK, MI)
(Resource Conservation and Recovery Act (tracking hazardous waste))
BLUE WATER LIFT TRUCK SERVICE INC (1405 N. RANGE RD. in KIMBALL, MI)
(Resource Conservation and Recovery Act (tracking hazardous waste)) Organizations: HAROLD R WAITE (CONTACT/OWNER)
ALLIED PHOTOCHEMICAL (48 N AIRPORT DR in KIMBALL, MI)
Conditionally Exempt Small Quantity Generators, less than 100 kg/month of hazardous waste (Resource Conservation and Recovery Act (tracking hazardous waste)) Organizations: DAVID TOKARSKI (CONTACT/OPERATOR)
, ROY C KROHN (CONTACT/OPERATOR)
BLACK RIVER CONCRETE (T 06N R 16E SEC 3 KIMBALL TWP in KIMBALL, MI)
(Resource Conservation and Recovery Act (tracking hazardous waste))
AUTOMOBILE METAL AUTOSHAPING (60 AIRPORT DR in KIMBALL, MI)
Conditionally Exempt Small Quantity Generators, less than 100 kg/month of hazardous waste (Resource Conservation and Recovery Act (tracking hazardous waste)) Organizations: AUTOMOBILE METAL SHAPING (CONTACT/OPERATOR)
MI DEPT/TRANSPORTATION BRIDGE (S12-77111 (I-94 UNDER RAVENSWOOD DRIVE in KIMBALL TOWNSHIP, MI)
Conditionally Exempt Small Quantity Generators, less than 100 kg/month of hazardous waste (Resource Conservation and Recovery Act (tracking hazardous waste))
3M CANADA CO C/O PORT HURON FULFILLMENT (35 ASH DRIVE in KIMBALL, MI)
COMPLIANCE ACTIVITY (Tracking inspections of insecticide, fungicide, and rodenticide, and toxic substances)
Housing units lacking complete plumbing facilities: 1.1% Housing units lacking complete kitchen facilities: 0.3%
84.7%Utility gas
6.9%Bottled, tank, or LP gas
5.1%Electricity
1.9%Wood
1.1%Fuel oil, kerosene, etc.
Population in 1990: 4,496. Population change in the 1990s: +4,127 (+91.8%).
Place of birth for U.S.-born residents:
This state: 8,366
Northeast: 259
Midwest: 325
South: 304
West: 148
56% of the 48074 zip code residents lived in the same house 5 years ago. Out of people who lived in different houses, 73% lived in this county. Out of people who lived in different counties, 50% lived in Michigan.
91% of the 48074 zip code residents lived in the same house 1 year ago. Out of people who lived in different houses, 75% moved from this county. Out of people who lived in different houses, 9% moved from different county within same state. Out of people who lived in different houses, 14% moved from different state.
Private vs. public school enrollment:
Students in private schools in grades 1 to 8 (elementary and middle school): 73
Here:
8.2%
Michigan:
12.4%
Students in private schools in grades 9 to 12 (high school):
Here:
0.0%
Michigan:
9.8%
Students in private undergraduate colleges: 120
Here:
21.9%
Michigan:
14.9%
Occupation by median earnings in the past 12 months ($)
89,569Architecture and engineering occupations
74,614Installation, maintenance, and repair occupations
72,436Health diagnosing and treating practitioners and other technical occupations
64,481Community and social service occupations
59,040Computer and mathematical occupations
55,852Education, training, and library occupations
Companies with federal contracts located in this zip code:
LAWRENCE FABRICATING CO INC (95 ASH DR in SMITHS CREEK, MI; small business) : $690,877 in 31 contractsfrom 1999 to 2006
Contracts for Vehicular Cab, Body, and Frame Structural Components, Vehicular Furniture and Accessories, Aircraft Ground Servicing Equipment, Scaffolding Equipment and Concrete Forms, and moreby Army, Defense Logistics Agency Signed by year:2000: $243,372; 2001: $0; 2002: $0; 2003: $0; 2004: $202,779; 2005: $87,640; 2006: $40,430.
Biggest contracts:
$179,502 with Army for Vehicular Cab, Body, and Frame Structural Components. Signed on 2000-07-20. Completion date: 2000-11-21.
$97,320 with Defense Logistics Agency for Vehicular Cab, Body, and Frame Structural Components. Signed on 2004-02-26. Completion date: 2004-06-20.
$67,900 with Defense Logistics Agency for Vehicular Furniture and Accessories. Signed on 2004-03-26. Completion date: 2004-07-19.
$61,040, same as above.Signed on 1999-10-15. Completion date: 2000-02-12.
ARLINGTON INNS, INC (1611 RANGE RD in SMITHS CREEK, MI; small business) : $145,719 in 6 contractsfrom 2001 to 2002
Contracts for Lodging - Hotel/Motel by Army Signed by year:2000: $0; 2001: $36,601; 2002: $109,118; 2003: $0; 2004: $0; 2005: $0; 2006: $0.
Biggest contracts:
$61,097 with Army for Lodging - Hotel/Motel. Signed on 2002-04-08. Completion date: 2002-07-17.
$19,471, same as above.Signed on 2001-12-01. Completion date: 2001-12-31.
$17,701, same as above.Signed on 2002-01-01. Completion date: 2002-01-31.
$17,130, same as above.Signed on 2001-11-01. Completion date: 2001-11-30.
CIPA USA INC, ATC DIV. (12 AIRPORT RD. in SMITHS CREEK, MI; small business)
$75,600 with Army for Miscellaneous Vehicular Components. Signed on 2000-08-30. Completion date: 2001-06-30.
Top industries in this zip code by the number of employees in 2005:
Administrative and Support and Waste Management and Remediation Services: Office Administrative Services (50-99: 1)
Other Services (except Public Administration): Religious Organizations (20-49: 1, 1-4: 4)
Construction: Plumbing, Heating, and Air-Conditioning Contractors (20-49: 1, 1-4: 3)
Health Care and Social Assistance: Child Day Care Services (20-49: 1, 1-4: 2)
Other Services (except Public Administration): Commercial and Industrial Machinery and Equipment (except Automotive and Electronic) Repair and Maintenance (20-49: 1, 1-4: 1)
People in group quarters in 2010:
52 people in group homes intended for adults
7 people in other noninstitutional facilities
3 people in workers' group living quarters and job corps centers
People in group quarters in 2000:
53 people in other group homes
12 people in homes for the mentally retarded
7 people in nursing homes
6 people in other noninstitutional group quarters
3 people in homes for the mentally ill
Fatal accident statistics in 2014:
Fatal accident count: 1
Vehicles involved in fatal accidents: 2
Fatal accidents caused by drunken drivers: 0
Fatalities: 1
Persons involved in fatal accidents: 3
Pedestrians involved in fatal accidents: 0
Fatal accident statistics in 2013:
Fatal accident count: 1
Vehicles involved in fatal accidents: 2
Fatal accidents caused by drunken drivers: 2
Fatalities: 2
Persons involved in fatal accidents: 3
Pedestrians involved in fatal accidents: 0
Home Mortgage Disclosure Act Aggregated Statistics For Year 2009 (Based on 4 full tracts)
A) FHA, FSA/RHS & VA Home Purchase Loans
B) Conventional Home Purchase Loans
C) Refinancings
D) Home Improvement Loans
F) Non-occupant Loans on < 5 Family Dwellings (A B C & D)
G) Loans On Manufactured Home Dwelling (A B C & D)
Number
Average Value
Number
Average Value
Number
Average Value
Number
Average Value
Number
Average Value
Number
Average Value
LOANS ORIGINATED
72
$114,944
52
$80,393
363
$120,691
44
$15,969
22
$72,940
22
$60,440
APPLICATIONS APPROVED, NOT ACCEPTED
8
$113,149
2
$88,955
52
$113,974
2
$12,995
2
$108,715
6
$93,423
APPLICATIONS DENIED
30
$88,422
20
$60,964
128
$122,714
32
$30,511
2
$74,805
14
$38,616
APPLICATIONS WITHDRAWN
2
$81,785
6
$56,927
76
$150,585
4
$13,962
2
$39,980
6
$136,598
FILES CLOSED FOR INCOMPLETENESS
4
$25,988
6
$58,847
38
$128,894
0
$0
2
$69,820
4
$91,760
Aggregated Statistics For Year 2008 (Based on 4 full tracts)
A) FHA, FSA/RHS & VA Home Purchase Loans
B) Conventional Home Purchase Loans
C) Refinancings
D) Home Improvement Loans
F) Non-occupant Loans on < 5 Family Dwellings (A B C & D)
G) Loans On Manufactured Home Dwelling (A B C & D)
Number
Average Value
Number
Average Value
Number
Average Value
Number
Average Value
Number
Average Value
Number
Average Value
LOANS ORIGINATED
72
$125,521
76
$95,076
206
$116,082
56
$27,367
26
$83,007
32
$77,985
APPLICATIONS APPROVED, NOT ACCEPTED
12
$113,908
18
$105,101
20
$152,158
10
$38,711
0
$0
6
$112,502
APPLICATIONS DENIED
16
$130,689
44
$62,825
178
$128,895
40
$45,077
8
$57,432
40
$51,945
APPLICATIONS WITHDRAWN
8
$112,955
8
$122,466
40
$123,954
6
$24,647
6
$155,448
10
$76,652
FILES CLOSED FOR INCOMPLETENESS
8
$105,769
6
$66,300
36
$147,295
0
$0
6
$87,438
6
$73,630
Aggregated Statistics For Year 2007 (Based on 4 full tracts)
A) FHA, FSA/RHS & VA Home Purchase Loans
B) Conventional Home Purchase Loans
C) Refinancings
D) Home Improvement Loans
F) Non-occupant Loans on < 5 Family Dwellings (A B C & D)
G) Loans On Manufactured Home Dwelling (A B C & D)
Number
Average Value
Number
Average Value
Number
Average Value
Number
Average Value
Number
Average Value
Number
Average Value
LOANS ORIGINATED
28
$127,924
216
$116,951
425
$113,541
110
$45,630
24
$95,811
52
$72,085
APPLICATIONS APPROVED, NOT ACCEPTED
2
$88,955
22
$108,903
96
$131,698
18
$32,585
6
$83,448
18
$83,754
APPLICATIONS DENIED
10
$144,242
36
$85,666
407
$133,835
70
$50,640
24
$96,974
38
$85,841
APPLICATIONS WITHDRAWN
8
$142,441
14
$74,211
80
$147,951
8
$123,525
6
$118,120
10
$54,330
FILES CLOSED FOR INCOMPLETENESS
2
$133,650
4
$131,315
46
$162,435
6
$41,298
2
$148,925
4
$93,452
Aggregated Statistics For Year 2006 (Based on 4 full tracts)
A) FHA, FSA/RHS & VA Home Purchase Loans
B) Conventional Home Purchase Loans
C) Refinancings
D) Home Improvement Loans
F) Non-occupant Loans on < 5 Family Dwellings (A B C & D)
G) Loans On Manufactured Home Dwelling (A B C & D)
Number
Average Value
Number
Average Value
Number
Average Value
Number
Average Value
Number
Average Value
Number
Average Value
LOANS ORIGINATED
32
$150,221
349
$111,099
505
$104,189
124
$26,180
54
$97,030
62
$78,995
APPLICATIONS APPROVED, NOT ACCEPTED
2
$116,695
48
$88,393
112
$119,512
16
$27,200
14
$104,611
22
$61,323
APPLICATIONS DENIED
6
$91,097
76
$81,785
427
$123,142
106
$28,638
24
$95,842
34
$74,961
APPLICATIONS WITHDRAWN
8
$125,818
40
$124,833
222
$119,703
18
$21,744
4
$103,860
6
$74,473
FILES CLOSED FOR INCOMPLETENESS
0
$0
8
$100,809
78
$140,372
0
$0
0
$0
2
$1,000
Aggregated Statistics For Year 2005 (Based on 4 full tracts)
A) FHA, FSA/RHS & VA Home Purchase Loans
B) Conventional Home Purchase Loans
C) Refinancings
D) Home Improvement Loans
E) Loans on Dwellings For 5+ Families
F) Non-occupant Loans on < 5 Family Dwellings (A B C & D)
G) Loans On Manufactured Home Dwelling (A B C & D)
Number
Average Value
Number
Average Value
Number
Average Value
Number
Average Value
Number
Average Value
Number
Average Value
Number
Average Value
LOANS ORIGINATED
34
$136,184
337
$119,343
661
$117,255
166
$21,517
0
$0
40
$87,698
84
$77,914
APPLICATIONS APPROVED, NOT ACCEPTED
8
$140,305
52
$117,050
110
$125,313
20
$20,268
0
$0
8
$187,786
26
$87,506
APPLICATIONS DENIED
2
$173,550
98
$84,763
493
$118,386
84
$32,439
0
$0
8
$68,092
60
$63,646
APPLICATIONS WITHDRAWN
8
$122,308
44
$327,998
226
$142,964
26
$77,176
2
$194,495
2
$77,960
16
$87,885
FILES CLOSED FOR INCOMPLETENESS
6
$119,798
8
$101,305
156
$138,926
8
$38,230
0
$0
0
$0
8
$160,170
Aggregated Statistics For Year 2004 (Based on 4 full tracts)
A) FHA, FSA/RHS & VA Home Purchase Loans
B) Conventional Home Purchase Loans
C) Refinancings
D) Home Improvement Loans
F) Non-occupant Loans on < 5 Family Dwellings (A B C & D)
G) Loans On Manufactured Home Dwelling (A B C & D)
Number
Average Value
Number
Average Value
Number
Average Value
Number
Average Value
Number
Average Value
Number
Average Value
LOANS ORIGINATED
20
$124,281
285
$112,018
693
$114,311
104
$31,404
34
$118,080
80
$92,054
APPLICATIONS APPROVED, NOT ACCEPTED
4
$155,922
60
$115,131
116
$105,013
18
$75,570
12
$111,972
28
$87,601
APPLICATIONS DENIED
6
$91,428
106
$84,651
441
$115,656
62
$49,953
12
$82,488
56
$81,664
APPLICATIONS WITHDRAWN
2
$90,765
28
$130,458
250
$128,192
16
$44,028
6
$68,155
14
$108,431
FILES CLOSED FOR INCOMPLETENESS
2
$103,730
2
$19,950
178
$125,560
8
$20,219
4
$46,400
4
$97,950
Aggregated Statistics For Year 2003 (Based on 4 full tracts)
A) FHA, FSA/RHS & VA Home Purchase Loans
B) Conventional Home Purchase Loans
C) Refinancings
D) Home Improvement Loans
F) Non-occupant Loans on < 5 Family Dwellings (A B C & D)
Detailed PMIC statistics for the following Tracts:6341.00
, 6346.00
2002 - 2018 National Fire Incident Reporting System (NFIRS) incidents
According to the data from the years 2002 - 2018 the average number of fire incidents per year is 32. The highest number of reported fires - 55 took place in 2015, and the least - 7 in 2007. The data has a declining trend.
When looking into fire subcategories, the most incidents belonged to: Structure Fires (54.5%), and Outside Fires (23.7%).
Fire incident types reported to NFIRS in Zip Code 48074
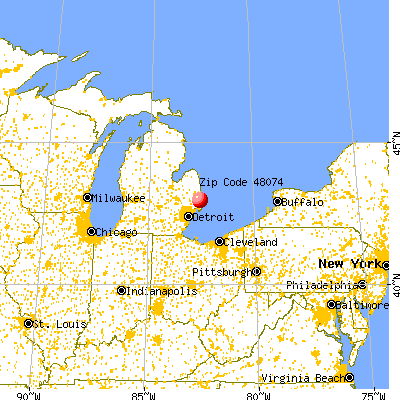


 Nearest zip codes: 48040, 48049, 48079, 48060, 48027, 48063.


 (Students: 723, Location: 4800 LAPEER RD, Grades: KG-12, Charter school)
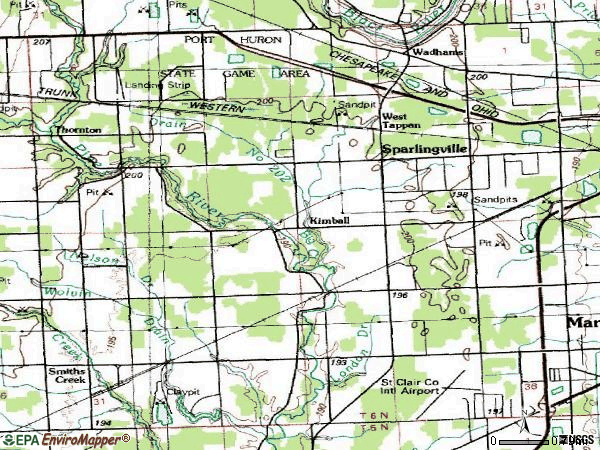


 According to the data from the years 2002 - 2018 the average number of fire incidents per year is 32. The highest number of reported fires - 55 took place in 2015, and the least - 7 in 2007. The data has a declining trend.
 When looking into fire subcategories, the most incidents belonged to: Structure Fires (54.5%), and Outside Fires (23.7%).