Estimated zip code population in 2022: 26,666
Zip code population in 2010: 26,455
Zip code population in 2000: 23,683
Houses and condos: 11,990
Renter-occupied apartments: 6,949
% of renters here:
64%State:
27%
March 2022 cost of living index in zip code 49006: 83.4
(less than average, U.S. average is 100)
Land area: 6.5
sq. mi.
Water area: 0.0
sq. mi.
Population density: 4,087 people per square mile (average).
OSM Map
General Map
Google Map
MSN Map
OSM Map
General Map
Google Map
MSN Map
OSM Map
General Map
Google Map
MSN Map
OSM Map
General Map
Google Map
MSN Map
Please wait while loading the map...
Real estate property taxes paid for housing units in 2022:
This zip code:
1.6% ($3,174)Michigan:
1.2% ($2,746)
Median real estate property taxes paid for housing units with mortgages in 2022: $3,179 (1.6%)
Median real estate property taxes paid for housing units with no mortgage in 2022: $3,206 (1.5%)
Profiles of local businesses
Business Search - 14 Million verified businesses
Males: 12,904 Females: 13,762
For population 25 years and over in 49006:
High school or higher: 93.7%Bachelor's degree or higher: 50.8%Graduate or professional degree: 19.5%Unemployed: 5.3%Mean travel time to work (commute): 17.6 minutes
For population 15 years and over in 49006:
Never married: 68.8%Now married: 20.7%Separated: 0.3%Widowed: 4.2%Divorced: 6.1%
Zip code 49006 compared to state average:
Median age significantly below state average. Renting percentage significantly above state average. Length of stay since moving in above state average. Number of college students significantly above state average. 17,700 66.4% White 3,755 14.1% Black 2,003 7.5% Two or more races 1,966 7.4% Hispanic or Latino 1,120 4.2% Asian 92 0.3% Some other race 27 0.1% Native Hawaiian and Other
Data:
Median household income ($)
Median household income (% change since 2000)
Household income diversity
Ratio of average income to average house value (%)
Ratio of average income to average rent
Median household income ($) - White
Median household income ($) - Black or African American
Median household income ($) - Asian
Median household income ($) - Hispanic or Latino
Median household income ($) - American Indian and Alaska Native
Median household income ($) - Multirace
Median household income ($) - Other Race
Median household income for houses/condos with a mortgage ($)
Median household income for apartments without a mortgage ($)
Races - White alone (%)
Races - White alone (% change since 2000)
Races - Black alone (%)
Races - Black alone (% change since 2000)
Races - American Indian alone (%)
Races - American Indian alone (% change since 2000)
Races - Asian alone (%)
Races - Asian alone (% change since 2000)
Races - Hispanic (%)
Races - Hispanic (% change since 2000)
Races - Native Hawaiian and Other Pacific Islander alone (%)
Races - Native Hawaiian and Other Pacific Islander alone (% change since 2000)
Races - Two or more races (%)
Races - Two or more races (% change since 2000)
Races - Other race alone (%)
Races - Other race alone (% change since 2000)
Racial diversity
Unemployment (%)
Unemployment (% change since 2000)
Unemployment (%) - White
Unemployment (%) - Black or African American
Unemployment (%) - Asian
Unemployment (%) - Hispanic or Latino
Unemployment (%) - American Indian and Alaska Native
Unemployment (%) - Multirace
Unemployment (%) - Other Race
Population density (people per square mile)
Population - Males (%)
Population - Females (%)
Population - Males (%) - White
Population - Males (%) - Black or African American
Population - Males (%) - Asian
Population - Males (%) - Hispanic or Latino
Population - Males (%) - American Indian and Alaska Native
Population - Males (%) - Multirace
Population - Males (%) - Other Race
Population - Females (%) - White
Population - Females (%) - Black or African American
Population - Females (%) - Asian
Population - Females (%) - Hispanic or Latino
Population - Females (%) - American Indian and Alaska Native
Population - Females (%) - Multirace
Population - Females (%) - Other Race
Coronavirus confirmed cases (Jun 10, 2024)
Deaths caused by coronavirus (Jun 10, 2024)
Coronavirus confirmed cases (per 100k population) (Jun 10, 2024)
Deaths caused by coronavirus (per 100k population) (Jun 10, 2024)
Daily increase in number of cases (Jun 10, 2024)
Weekly increase in number of cases (Jun 10, 2024)
Cases doubled (in days) (Jun 10, 2024)
Hospitalized patients (Apr 18, 2022)
Negative test results (Apr 18, 2022)
Total test results (Apr 18, 2022)
COVID Vaccine doses distributed (per 100k population) (Sep 19, 2023)
COVID Vaccine doses administered (per 100k population) (Sep 19, 2023)
COVID Vaccine doses distributed (Sep 19, 2023)
COVID Vaccine doses administered (Sep 19, 2023)
Likely homosexual households (%)
Likely homosexual households (% change since 2000)
Likely homosexual households - Lesbian couples (%)
Likely homosexual households - Lesbian couples (% change since 2000)
Likely homosexual households - Gay men (%)
Likely homosexual households - Gay men (% change since 2000)
Cost of living index
Median gross rent ($)
Median contract rent ($)
Median monthly housing costs ($)
Median house or condo value ($)
Median house or condo value ($ change since 2000)
Mean house or condo value by units in structure - 1, detached ($)
Mean house or condo value by units in structure - 1, attached ($)
Mean house or condo value by units in structure - 2 ($)
Mean house or condo value by units in structure by units in structure - 3 or 4 ($)
Mean house or condo value by units in structure - 5 or more ($)
Mean house or condo value by units in structure - Boat, RV, van, etc. ($)
Mean house or condo value by units in structure - Mobile home ($)
Median house or condo value ($) - White
Median house or condo value ($) - Black or African American
Median house or condo value ($) - Asian
Median house or condo value ($) - Hispanic or Latino
Median house or condo value ($) - American Indian and Alaska Native
Median house or condo value ($) - Multirace
Median house or condo value ($) - Other Race
Median resident age
Resident age diversity
Median resident age - Males
Median resident age - Females
Median resident age - White
Median resident age - Black or African American
Median resident age - Asian
Median resident age - Hispanic or Latino
Median resident age - American Indian and Alaska Native
Median resident age - Multirace
Median resident age - Other Race
Median resident age - Males - White
Median resident age - Males - Black or African American
Median resident age - Males - Asian
Median resident age - Males - Hispanic or Latino
Median resident age - Males - American Indian and Alaska Native
Median resident age - Males - Multirace
Median resident age - Males - Other Race
Median resident age - Females - White
Median resident age - Females - Black or African American
Median resident age - Females - Asian
Median resident age - Females - Hispanic or Latino
Median resident age - Females - American Indian and Alaska Native
Median resident age - Females - Multirace
Median resident age - Females - Other Race
Commute - mean travel time to work (minutes)
Travel time to work - Less than 5 minutes (%)
Travel time to work - Less than 5 minutes (% change since 2000)
Travel time to work - 5 to 9 minutes (%)
Travel time to work - 5 to 9 minutes (% change since 2000)
Travel time to work - 10 to 19 minutes (%)
Travel time to work - 10 to 19 minutes (% change since 2000)
Travel time to work - 20 to 29 minutes (%)
Travel time to work - 20 to 29 minutes (% change since 2000)
Travel time to work - 30 to 39 minutes (%)
Travel time to work - 30 to 39 minutes (% change since 2000)
Travel time to work - 40 to 59 minutes (%)
Travel time to work - 40 to 59 minutes (% change since 2000)
Travel time to work - 60 to 89 minutes (%)
Travel time to work - 60 to 89 minutes (% change since 2000)
Travel time to work - 90 or more minutes (%)
Travel time to work - 90 or more minutes (% change since 2000)
Marital status - Never married (%)
Marital status - Now married (%)
Marital status - Separated (%)
Marital status - Widowed (%)
Marital status - Divorced (%)
Median family income ($)
Median family income (% change since 2000)
Median non-family income ($)
Median non-family income (% change since 2000)
Median per capita income ($)
Median per capita income (% change since 2000)
Median family income ($) - White
Median family income ($) - Black or African American
Median family income ($) - Asian
Median family income ($) - Hispanic or Latino
Median family income ($) - American Indian and Alaska Native
Median family income ($) - Multirace
Median family income ($) - Other Race
Median year house/condo built
Median year apartment built
Year house built - Built 2005 or later (%)
Year house built - Built 2000 to 2004 (%)
Year house built - Built 1990 to 1999 (%)
Year house built - Built 1980 to 1989 (%)
Year house built - Built 1970 to 1979 (%)
Year house built - Built 1960 to 1969 (%)
Year house built - Built 1950 to 1959 (%)
Year house built - Built 1940 to 1949 (%)
Year house built - Built 1939 or earlier (%)
Average household size
Household density (households per square mile)
Average household size - White
Average household size - Black or African American
Average household size - Asian
Average household size - Hispanic or Latino
Average household size - American Indian and Alaska Native
Average household size - Multirace
Average household size - Other Race
Occupied housing units (%)
Vacant housing units (%)
Owner occupied housing units (%)
Renter occupied housing units (%)
Vacancy status - For rent (%)
Vacancy status - For sale only (%)
Vacancy status - Rented or sold, not occupied (%)
Vacancy status - For seasonal, recreational, or occasional use (%)
Vacancy status - For migrant workers (%)
Vacancy status - Other vacant (%)
Residents with income below the poverty level (%)
Residents with income below 50% of the poverty level (%)
Children below poverty level (%)
Poor families by family type - Married-couple family (%)
Poor families by family type - Male, no wife present (%)
Poor families by family type - Female, no husband present (%)
Poverty status for native-born residents (%)
Poverty status for foreign-born residents (%)
Poverty among high school graduates not in families (%)
Poverty among people who did not graduate high school not in families (%)
Residents with income below the poverty level (%) - White
Residents with income below the poverty level (%) - Black or African American
Residents with income below the poverty level (%) - Asian
Residents with income below the poverty level (%) - Hispanic or Latino
Residents with income below the poverty level (%) - American Indian and Alaska Native
Residents with income below the poverty level (%) - Multirace
Residents with income below the poverty level (%) - Other Race
Air pollution - Air Quality Index (AQI)
Air pollution - CO
Air pollution - NO2
Air pollution - SO2
Air pollution - Ozone
Air pollution - PM10
Air pollution - PM25
Air pollution - Pb
Crime - Murders per 100,000 population
Crime - Rapes per 100,000 population
Crime - Robberies per 100,000 population
Crime - Assaults per 100,000 population
Crime - Burglaries per 100,000 population
Crime - Thefts per 100,000 population
Crime - Auto thefts per 100,000 population
Crime - Arson per 100,000 population
Crime - City-data.com crime index
Crime - Violent crime index
Crime - Property crime index
Crime - Murders per 100,000 population (5 year average)
Crime - Rapes per 100,000 population (5 year average)
Crime - Robberies per 100,000 population (5 year average)
Crime - Assaults per 100,000 population (5 year average)
Crime - Burglaries per 100,000 population (5 year average)
Crime - Thefts per 100,000 population (5 year average)
Crime - Auto thefts per 100,000 population (5 year average)
Crime - Arson per 100,000 population (5 year average)
Crime - City-data.com crime index (5 year average)
Crime - Violent crime index (5 year average)
Crime - Property crime index (5 year average)
1996 Presidential Elections Results (%) - Democratic Party (Clinton)
1996 Presidential Elections Results (%) - Republican Party (Dole)
1996 Presidential Elections Results (%) - Other
2000 Presidential Elections Results (%) - Democratic Party (Gore)
2000 Presidential Elections Results (%) - Republican Party (Bush)
2000 Presidential Elections Results (%) - Other
2004 Presidential Elections Results (%) - Democratic Party (Kerry)
2004 Presidential Elections Results (%) - Republican Party (Bush)
2004 Presidential Elections Results (%) - Other
2008 Presidential Elections Results (%) - Democratic Party (Obama)
2008 Presidential Elections Results (%) - Republican Party (McCain)
2008 Presidential Elections Results (%) - Other
2012 Presidential Elections Results (%) - Democratic Party (Obama)
2012 Presidential Elections Results (%) - Republican Party (Romney)
2012 Presidential Elections Results (%) - Other
2016 Presidential Elections Results (%) - Democratic Party (Clinton)
2016 Presidential Elections Results (%) - Republican Party (Trump)
2016 Presidential Elections Results (%) - Other
2020 Presidential Elections Results (%) - Democratic Party (Biden)
2020 Presidential Elections Results (%) - Republican Party (Trump)
2020 Presidential Elections Results (%) - Other
Ancestries Reported - Arab (%)
Ancestries Reported - Czech (%)
Ancestries Reported - Danish (%)
Ancestries Reported - Dutch (%)
Ancestries Reported - English (%)
Ancestries Reported - French (%)
Ancestries Reported - French Canadian (%)
Ancestries Reported - German (%)
Ancestries Reported - Greek (%)
Ancestries Reported - Hungarian (%)
Ancestries Reported - Irish (%)
Ancestries Reported - Italian (%)
Ancestries Reported - Lithuanian (%)
Ancestries Reported - Norwegian (%)
Ancestries Reported - Polish (%)
Ancestries Reported - Portuguese (%)
Ancestries Reported - Russian (%)
Ancestries Reported - Scotch-Irish (%)
Ancestries Reported - Scottish (%)
Ancestries Reported - Slovak (%)
Ancestries Reported - Subsaharan African (%)
Ancestries Reported - Swedish (%)
Ancestries Reported - Swiss (%)
Ancestries Reported - Ukrainian (%)
Ancestries Reported - United States (%)
Ancestries Reported - Welsh (%)
Ancestries Reported - West Indian (%)
Ancestries Reported - Other (%)
Educational Attainment - No schooling completed (%)
Educational Attainment - Less than high school (%)
Educational Attainment - High school or equivalent (%)
Educational Attainment - Less than 1 year of college (%)
Educational Attainment - 1 or more years of college (%)
Educational Attainment - Associate degree (%)
Educational Attainment - Bachelor's degree (%)
Educational Attainment - Master's degree (%)
Educational Attainment - Professional school degree (%)
Educational Attainment - Doctorate degree (%)
School Enrollment - Nursery, preschool (%)
School Enrollment - Kindergarten (%)
School Enrollment - Grade 1 to 4 (%)
School Enrollment - Grade 5 to 8 (%)
School Enrollment - Grade 9 to 12 (%)
School Enrollment - College undergrad (%)
School Enrollment - Graduate or professional (%)
School Enrollment - Not enrolled in school (%)
School enrollment - Public schools (%)
School enrollment - Private schools (%)
School enrollment - Not enrolled (%)
Median number of rooms in houses and condos
Median number of rooms in apartments
Housing units lacking complete plumbing facilities (%)
Housing units lacking complete kitchen facilities (%)
Density of houses
Urban houses (%)
Rural houses (%)
Households with people 60 years and over (%)
Households with people 65 years and over (%)
Households with people 75 years and over (%)
Households with one or more nonrelatives (%)
Households with no nonrelatives (%)
Population in households (%)
Family households (%)
Nonfamily households (%)
Population in families (%)
Family households with own children (%)
Median number of bedrooms in owner occupied houses
Mean number of bedrooms in owner occupied houses
Median number of bedrooms in renter occupied houses
Mean number of bedrooms in renter occupied houses
Median number of vehichles in owner occupied houses
Mean number of vehichles in owner occupied houses
Median number of vehichles in renter occupied houses
Mean number of vehichles in renter occupied houses
Mortgage status - with mortgage (%)
Mortgage status - with second mortgage (%)
Mortgage status - with home equity loan (%)
Mortgage status - with both second mortgage and home equity loan (%)
Mortgage status - without a mortgage (%)
Average family size
Average family size - White
Average family size - Black or African American
Average family size - Asian
Average family size - Hispanic or Latino
Average family size - American Indian and Alaska Native
Average family size - Multirace
Average family size - Other Race
Geographical mobility - Same house 1 year ago (%)
Geographical mobility - Moved within same county (%)
Geographical mobility - Moved from different county within same state (%)
Geographical mobility - Moved from different state (%)
Geographical mobility - Moved from abroad (%)
Place of birth - Born in state of residence (%)
Place of birth - Born in other state (%)
Place of birth - Native, outside of US (%)
Place of birth - Foreign born (%)
Housing units in structures - 1, detached (%)
Housing units in structures - 1, attached (%)
Housing units in structures - 2 (%)
Housing units in structures - 3 or 4 (%)
Housing units in structures - 5 to 9 (%)
Housing units in structures - 10 to 19 (%)
Housing units in structures - 20 to 49 (%)
Housing units in structures - 50 or more (%)
Housing units in structures - Mobile home (%)
Housing units in structures - Boat, RV, van, etc. (%)
House/condo owner moved in on average (years ago)
Renter moved in on average (years ago)
Year householder moved into unit - Moved in 1999 to March 2000 (%)
Year householder moved into unit - Moved in 1995 to 1998 (%)
Year householder moved into unit - Moved in 1990 to 1994 (%)
Year householder moved into unit - Moved in 1980 to 1989 (%)
Year householder moved into unit - Moved in 1970 to 1979 (%)
Year householder moved into unit - Moved in 1969 or earlier (%)
Means of transportation to work - Drove car alone (%)
Means of transportation to work - Carpooled (%)
Means of transportation to work - Public transportation (%)
Means of transportation to work - Bus or trolley bus (%)
Means of transportation to work - Streetcar or trolley car (%)
Means of transportation to work - Subway or elevated (%)
Means of transportation to work - Railroad (%)
Means of transportation to work - Ferryboat (%)
Means of transportation to work - Taxicab (%)
Means of transportation to work - Motorcycle (%)
Means of transportation to work - Bicycle (%)
Means of transportation to work - Walked (%)
Means of transportation to work - Other means (%)
Working at home (%)
Industry diversity
Most Common Industries - Agriculture, forestry, fishing and hunting, and mining (%)
Most Common Industries - Agriculture, forestry, fishing and hunting (%)
Most Common Industries - Mining, quarrying, and oil and gas extraction (%)
Most Common Industries - Construction (%)
Most Common Industries - Manufacturing (%)
Most Common Industries - Wholesale trade (%)
Most Common Industries - Retail trade (%)
Most Common Industries - Transportation and warehousing, and utilities (%)
Most Common Industries - Transportation and warehousing (%)
Most Common Industries - Utilities (%)
Most Common Industries - Information (%)
Most Common Industries - Finance and insurance, and real estate and rental and leasing (%)
Most Common Industries - Finance and insurance (%)
Most Common Industries - Real estate and rental and leasing (%)
Most Common Industries - Professional, scientific, and management, and administrative and waste management services (%)
Most Common Industries - Professional, scientific, and technical services (%)
Most Common Industries - Management of companies and enterprises (%)
Most Common Industries - Administrative and support and waste management services (%)
Most Common Industries - Educational services, and health care and social assistance (%)
Most Common Industries - Educational services (%)
Most Common Industries - Health care and social assistance (%)
Most Common Industries - Arts, entertainment, and recreation, and accommodation and food services (%)
Most Common Industries - Arts, entertainment, and recreation (%)
Most Common Industries - Accommodation and food services (%)
Most Common Industries - Other services, except public administration (%)
Most Common Industries - Public administration (%)
Occupation diversity
Most Common Occupations - Management, business, science, and arts occupations (%)
Most Common Occupations - Management, business, and financial occupations (%)
Most Common Occupations - Management occupations (%)
Most Common Occupations - Business and financial operations occupations (%)
Most Common Occupations - Computer, engineering, and science occupations (%)
Most Common Occupations - Computer and mathematical occupations (%)
Most Common Occupations - Architecture and engineering occupations (%)
Most Common Occupations - Life, physical, and social science occupations (%)
Most Common Occupations - Education, legal, community service, arts, and media occupations (%)
Most Common Occupations - Community and social service occupations (%)
Most Common Occupations - Legal occupations (%)
Most Common Occupations - Education, training, and library occupations (%)
Most Common Occupations - Arts, design, entertainment, sports, and media occupations (%)
Most Common Occupations - Healthcare practitioners and technical occupations (%)
Most Common Occupations - Health diagnosing and treating practitioners and other technical occupations (%)
Most Common Occupations - Health technologists and technicians (%)
Most Common Occupations - Service occupations (%)
Most Common Occupations - Healthcare support occupations (%)
Most Common Occupations - Protective service occupations (%)
Most Common Occupations - Fire fighting and prevention, and other protective service workers including supervisors (%)
Most Common Occupations - Law enforcement workers including supervisors (%)
Most Common Occupations - Food preparation and serving related occupations (%)
Most Common Occupations - Building and grounds cleaning and maintenance occupations (%)
Most Common Occupations - Personal care and service occupations (%)
Most Common Occupations - Sales and office occupations (%)
Most Common Occupations - Sales and related occupations (%)
Most Common Occupations - Office and administrative support occupations (%)
Most Common Occupations - Natural resources, construction, and maintenance occupations (%)
Most Common Occupations - Farming, fishing, and forestry occupations (%)
Most Common Occupations - Construction and extraction occupations (%)
Most Common Occupations - Installation, maintenance, and repair occupations (%)
Most Common Occupations - Production, transportation, and material moving occupations (%)
Most Common Occupations - Production occupations (%)
Most Common Occupations - Transportation occupations (%)
Most Common Occupations - Material moving occupations (%)
People in Group quarters - Institutionalized population (%)
People in Group quarters - Correctional institutions (%)
People in Group quarters - Federal prisons and detention centers (%)
People in Group quarters - Halfway houses (%)
People in Group quarters - Local jails and other confinement facilities (including police lockups) (%)
People in Group quarters - Military disciplinary barracks (%)
People in Group quarters - State prisons (%)
People in Group quarters - Other types of correctional institutions (%)
People in Group quarters - Nursing homes (%)
People in Group quarters - Hospitals/wards, hospices, and schools for the handicapped (%)
People in Group quarters - Hospitals/wards and hospices for chronically ill (%)
People in Group quarters - Hospices or homes for chronically ill (%)
People in Group quarters - Military hospitals or wards for chronically ill (%)
People in Group quarters - Other hospitals or wards for chronically ill (%)
People in Group quarters - Hospitals or wards for drug/alcohol abuse (%)
People in Group quarters - Mental (Psychiatric) hospitals or wards (%)
People in Group quarters - Schools, hospitals, or wards for the mentally retarded (%)
People in Group quarters - Schools, hospitals, or wards for the physically handicapped (%)
People in Group quarters - Institutions for the deaf (%)
People in Group quarters - Institutions for the blind (%)
People in Group quarters - Orthopedic wards and institutions for the physically handicapped (%)
People in Group quarters - Wards in general hospitals for patients who have no usual home elsewhere (%)
People in Group quarters - Wards in military hospitals for patients who have no usual home elsewhere (%)
People in Group quarters - Juvenile institutions (%)
People in Group quarters - Long-term care (%)
People in Group quarters - Homes for abused, dependent, and neglected children (%)
People in Group quarters - Residential treatment centers for emotionally disturbed children (%)
People in Group quarters - Training schools for juvenile delinquents (%)
People in Group quarters - Short-term care, detention or diagnostic centers for delinquent children (%)
People in Group quarters - Type of juvenile institution unknown (%)
People in Group quarters - Noninstitutionalized population (%)
People in Group quarters - College dormitories (includes college quarters off campus) (%)
People in Group quarters - Military quarters (%)
People in Group quarters - On base (%)
People in Group quarters - Barracks, unaccompanied personnel housing (UPH), (Enlisted/Officer), ;and similar group living quarters for military personnel (%)
People in Group quarters - Transient quarters for temporary residents (%)
People in Group quarters - Military ships (%)
People in Group quarters - Group homes (%)
People in Group quarters - Homes or halfway houses for drug/alcohol abuse (%)
People in Group quarters - Homes for the mentally ill (%)
People in Group quarters - Homes for the mentally retarded (%)
People in Group quarters - Homes for the physically handicapped (%)
People in Group quarters - Other group homes (%)
People in Group quarters - Religious group quarters (%)
People in Group quarters - Dormitories (%)
People in Group quarters - Agriculture workers' dormitories on farms (%)
People in Group quarters - Job Corps and vocational training facilities (%)
People in Group quarters - Other workers' dormitories (%)
People in Group quarters - Crews of maritime vessels (%)
People in Group quarters - Other nonhousehold living situations (%)
People in Group quarters - Other noninstitutional group quarters (%)
Residents speaking English at home (%)
Residents speaking English at home - Born in the United States (%)
Residents speaking English at home - Native, born elsewhere (%)
Residents speaking English at home - Foreign born (%)
Residents speaking Spanish at home (%)
Residents speaking Spanish at home - Born in the United States (%)
Residents speaking Spanish at home - Native, born elsewhere (%)
Residents speaking Spanish at home - Foreign born (%)
Residents speaking other language at home (%)
Residents speaking other language at home - Born in the United States (%)
Residents speaking other language at home - Native, born elsewhere (%)
Residents speaking other language at home - Foreign born (%)
Class of Workers - Employee of private company (%)
Class of Workers - Self-employed in own incorporated business (%)
Class of Workers - Private not-for-profit wage and salary workers (%)
Class of Workers - Local government workers (%)
Class of Workers - State government workers (%)
Class of Workers - Federal government workers (%)
Class of Workers - Self-employed workers in own not incorporated business and Unpaid family workers (%)
House heating fuel used in houses and condos - Utility gas (%)
House heating fuel used in houses and condos - Bottled, tank, or LP gas (%)
House heating fuel used in houses and condos - Electricity (%)
House heating fuel used in houses and condos - Fuel oil, kerosene, etc. (%)
House heating fuel used in houses and condos - Coal or coke (%)
House heating fuel used in houses and condos - Wood (%)
House heating fuel used in houses and condos - Solar energy (%)
House heating fuel used in houses and condos - Other fuel (%)
House heating fuel used in houses and condos - No fuel used (%)
House heating fuel used in apartments - Utility gas (%)
House heating fuel used in apartments - Bottled, tank, or LP gas (%)
House heating fuel used in apartments - Electricity (%)
House heating fuel used in apartments - Fuel oil, kerosene, etc. (%)
House heating fuel used in apartments - Coal or coke (%)
House heating fuel used in apartments - Wood (%)
House heating fuel used in apartments - Solar energy (%)
House heating fuel used in apartments - Other fuel (%)
House heating fuel used in apartments - No fuel used (%)
Armed forces status - In Armed Forces (%)
Armed forces status - Civilian (%)
Armed forces status - Civilian - Veteran (%)
Armed forces status - Civilian - Nonveteran (%)
Fatal accidents locations in years 2005-2021
Fatal accidents locations in 2005
Fatal accidents locations in 2006
Fatal accidents locations in 2007
Fatal accidents locations in 2008
Fatal accidents locations in 2009
Fatal accidents locations in 2010
Fatal accidents locations in 2011
Fatal accidents locations in 2012
Fatal accidents locations in 2013
Fatal accidents locations in 2014
Fatal accidents locations in 2015
Fatal accidents locations in 2016
Fatal accidents locations in 2017
Fatal accidents locations in 2018
Fatal accidents locations in 2019
Fatal accidents locations in 2020
Fatal accidents locations in 2021
Alcohol use - People drinking some alcohol every month (%)
Alcohol use - People not drinking at all (%)
Alcohol use - Average days/month drinking alcohol
Alcohol use - Average drinks/week
Alcohol use - Average days/year people drink much
Audiometry - Average condition of hearing (%)
Audiometry - People that can hear a whisper from across a quiet room (%)
Audiometry - People that can hear normal voice from across a quiet room (%)
Audiometry - Ears ringing, roaring, buzzing (%)
Audiometry - Had a job exposure to loud noise (%)
Audiometry - Had off-work exposure to loud noise (%)
Blood Pressure & Cholesterol - Has high blood pressure (%)
Blood Pressure & Cholesterol - Checking blood pressure at home (%)
Blood Pressure & Cholesterol - Frequently checking blood cholesterol (%)
Blood Pressure & Cholesterol - Has high cholesterol level (%)
Consumer Behavior - Money monthly spent on food at supermarket/grocery store
Consumer Behavior - Money monthly spent on food at other stores
Consumer Behavior - Money monthly spent on eating out
Consumer Behavior - Money monthly spent on carryout/delivered foods
Consumer Behavior - Income spent on food at supermarket/grocery store (%)
Consumer Behavior - Income spent on food at other stores (%)
Consumer Behavior - Income spent on eating out (%)
Consumer Behavior - Income spent on carryout/delivered foods (%)
Current Health Status - General health condition (%)
Current Health Status - Blood donors (%)
Current Health Status - Has blood ever tested for HIV virus (%)
Current Health Status - Left-handed people (%)
Dermatology - People using sunscreen (%)
Diabetes - Diabetics (%)
Diabetes - Had a blood test for high blood sugar (%)
Diabetes - People taking insulin (%)
Diet Behavior & Nutrition - Diet health (%)
Diet Behavior & Nutrition - Milk product consumption (# of products/month)
Diet Behavior & Nutrition - Meals not home prepared (#/week)
Diet Behavior & Nutrition - Meals from fast food or pizza place (#/week)
Diet Behavior & Nutrition - Ready-to-eat foods (#/month)
Diet Behavior & Nutrition - Frozen meals/pizza (#/month)
Drug Use - People that ever used marijuana or hashish (%)
Drug Use - Ever used hard drugs (%)
Drug Use - Ever used any form of cocaine (%)
Drug Use - Ever used heroin (%)
Drug Use - Ever used methamphetamine (%)
Health Insurance - People covered by health insurance (%)
Kidney Conditions-Urology - Avg. # of times urinating at night
Medical Conditions - People with asthma (%)
Medical Conditions - People with anemia (%)
Medical Conditions - People with psoriasis (%)
Medical Conditions - People with overweight (%)
Medical Conditions - Elderly people having difficulties in thinking or remembering (%)
Medical Conditions - People who ever received blood transfusion (%)
Medical Conditions - People having trouble seeing even with glass/contacts (%)
Medical Conditions - People with arthritis (%)
Medical Conditions - People with gout (%)
Medical Conditions - People with congestive heart failure (%)
Medical Conditions - People with coronary heart disease (%)
Medical Conditions - People with angina pectoris (%)
Medical Conditions - People who ever had heart attack (%)
Medical Conditions - People who ever had stroke (%)
Medical Conditions - People with emphysema (%)
Medical Conditions - People with thyroid problem (%)
Medical Conditions - People with chronic bronchitis (%)
Medical Conditions - People with any liver condition (%)
Medical Conditions - People who ever had cancer or malignancy (%)
Mental Health - People who have little interest in doing things (%)
Mental Health - People feeling down, depressed, or hopeless (%)
Mental Health - People who have trouble sleeping or sleeping too much (%)
Mental Health - People feeling tired or having little energy (%)
Mental Health - People with poor appetite or overeating (%)
Mental Health - People feeling bad about themself (%)
Mental Health - People who have trouble concentrating on things (%)
Mental Health - People moving or speaking slowly or too fast (%)
Mental Health - People having thoughts they would be better off dead (%)
Oral Health - Average years since last visit a dentist
Oral Health - People embarrassed because of mouth (%)
Oral Health - People with gum disease (%)
Oral Health - General health of teeth and gums (%)
Oral Health - Average days a week using dental floss/device
Oral Health - Average days a week using mouthwash for dental problem
Oral Health - Average number of teeth
Pesticide Use - Households using pesticides to control insects (%)
Pesticide Use - Households using pesticides to kill weeds (%)
Physical Activity - People doing vigorous-intensity work activities (%)
Physical Activity - People doing moderate-intensity work activities (%)
Physical Activity - People walking or bicycling (%)
Physical Activity - People doing vigorous-intensity recreational activities (%)
Physical Activity - People doing moderate-intensity recreational activities (%)
Physical Activity - Average hours a day doing sedentary activities
Physical Activity - Average hours a day watching TV or videos
Physical Activity - Average hours a day using computer
Physical Functioning - People having limitations keeping them from working (%)
Physical Functioning - People limited in amount of work they can do (%)
Physical Functioning - People that need special equipment to walk (%)
Physical Functioning - People experiencing confusion/memory problems (%)
Physical Functioning - People requiring special healthcare equipment (%)
Prescription Medications - Average number of prescription medicines taking
Preventive Aspirin Use - Adults 40+ taking low-dose aspirin (%)
Reproductive Health - Vaginal deliveries (%)
Reproductive Health - Cesarean deliveries (%)
Reproductive Health - Deliveries resulted in a live birth (%)
Reproductive Health - Pregnancies resulted in a delivery (%)
Reproductive Health - Women breastfeeding newborns (%)
Reproductive Health - Women that had a hysterectomy (%)
Reproductive Health - Women that had both ovaries removed (%)
Reproductive Health - Women that have ever taken birth control pills (%)
Reproductive Health - Women taking birth control pills (%)
Reproductive Health - Women that have ever used Depo-Provera or injectables (%)
Reproductive Health - Women that have ever used female hormones (%)
Sexual Behavior - People 18+ that ever had sex (vaginal, anal, or oral) (%)
Sexual Behavior - Males 18+ that ever had vaginal sex with a woman (%)
Sexual Behavior - Males 18+ that ever performed oral sex on a woman (%)
Sexual Behavior - Males 18+ that ever had anal sex with a woman (%)
Sexual Behavior - Males 18+ that ever had any sex with a man (%)
Sexual Behavior - Females 18+ that ever had vaginal sex with a man (%)
Sexual Behavior - Females 18+ that ever performed oral sex on a man (%)
Sexual Behavior - Females 18+ that ever had anal sex with a man (%)
Sexual Behavior - Females 18+ that ever had any kind of sex with a woman (%)
Sexual Behavior - Average age people first had sex
Sexual Behavior - Average number of female sex partners in lifetime (males 18+)
Sexual Behavior - Average number of female vaginal sex partners in lifetime (males 18+)
Sexual Behavior - Average age people first performed oral sex on a woman (18+)
Sexual Behavior - Average number of woman performed oral sex on in lifetime (18+)
Sexual Behavior - Average number of male sex partners in lifetime (males 18+)
Sexual Behavior - Average number of male anal sex partners in lifetime (males 18+)
Sexual Behavior - Average age people first performed oral sex on a man (18+)
Sexual Behavior - Average number of male oral sex partners in lifetime (18+)
Sexual Behavior - People using protection when performing oral sex (%)
Sexual Behavior - Average number of times people have vaginal or anal sex a year
Sexual Behavior - People having sex without condom (%)
Sexual Behavior - Average number of male sex partners in lifetime (females 18+)
Sexual Behavior - Average number of male vaginal sex partners in lifetime (females 18+)
Sexual Behavior - Average number of female sex partners in lifetime (females 18+)
Sexual Behavior - Circumcised males 18+ (%)
Sleep Disorders - Average hours sleeping at night
Sleep Disorders - People that has trouble sleeping (%)
Smoking-Cigarette Use - People smoking cigarettes (%)
Taste & Smell - People 40+ having problems with smell (%)
Taste & Smell - People 40+ having problems with taste (%)
Taste & Smell - People 40+ that ever had wisdom teeth removed (%)
Taste & Smell - People 40+ that ever had tonsils teeth removed (%)
Taste & Smell - People 40+ that ever had a loss of consciousness because of a head injury (%)
Taste & Smell - People 40+ that ever had a broken nose or other serious injury to face or skull (%)
Taste & Smell - People 40+ that ever had two or more sinus infections (%)
Weight - Average height (inches)
Weight - Average weight (pounds)
Weight - Average BMI
Weight - People that are obese (%)
Weight - People that ever were obese (%)
Weight - People trying to lose weight (%)
100%
urban population.
Estimated median house/condo value in 2022: $201,748
49006:
$201,748Michigan:
$224,400
According to our research of Michigan and other state lists, there were 46 registered sex offenders living in 49006 zip code as of June 10, 2024 . The ratio of all residents to sex offenders in zip code 49006 is 629 to 1.The ratio of registered sex offenders to all residents in this zip code is lower than the state average.
Median resident age: This zip code:
23.1 yearsMichigan median age:
40.3 years
Average household size: This zip code:
2.2 peopleMichigan:
2.4 people
Averages for the 2020 tax year for zip code 49006, filed in 2021:
Average Adjusted Gross Income (AGI) in 2020: $50,101 (Individual Income Tax Returns) Here:
$50,101State:
$68,945
Salary/wage: $40,461 (reported on 82.6% of returns )Here:
$40,461State:
$57,142
(% of AGI for various income ranges: 1046.4% for AGIs below $25k , 3389.7% for AGIs $25k-50k , 6347.9% for AGIs $50k-75k , 9452.7% for AGIs $75k-100k , 16472.1% for AGIs $100k-200k , 58786.0% for AGIs over 200k ) Taxable interest for individuals: $922 (reported on 28.3% of returns )This zip code:
$922Michigan:
$1,630
(% of AGI for various income ranges: 9.8% for AGIs below $25k , 17.6% for AGIs $25k-50k , 44.2% for AGIs $50k-75k , 65.4% for AGIs $75k-100k , 140.6% for AGIs $100k-200k , 820.0% for AGIs over 200k ) Ordinary dividends: $5,593 (reported on 17.4% of returns )(% of AGI for various income ranges: 18.0% for AGIs below $25k , 38.5% for AGIs $25k-50k , 104.3% for AGIs $50k-75k , 206.0% for AGIs $75k-100k , 577.3% for AGIs $100k-200k , 6540.0% for AGIs over 200k ) Net capital gain/loss in AGI: +$8,779 (reported on 15.5% of returns )Here:
+$8,779State:
+$20,064
(% of AGI for various income ranges: 7.8% for AGIs below $25k , 30.1% for AGIs $25k-50k , 99.7% for AGIs $50k-75k , 199.2% for AGIs $75k-100k , 710.0% for AGIs $100k-200k , 14242.0% for AGIs over 200k ) Profit/loss from business: +$8,613 (reported on 13.2% of returns )Here:
+$8,613State:
+$11,172
(% of AGI for various income ranges: 38.9% for AGIs below $25k , 87.4% for AGIs $25k-50k , 217.8% for AGIs $50k-75k , 239.0% for AGIs $75k-100k , 593.7% for AGIs $100k-200k , 3578.0% for AGIs over 200k ) Taxable individual retirement arrangement distribution: $19,602 (reported on 9.5% of returns )49006:
$19,602Michigan:
$19,803
(% of AGI for various income ranges: 44.4% for AGIs below $25k , 102.5% for AGIs $25k-50k , 272.9% for AGIs $50k-75k , 582.5% for AGIs $75k-100k , 1246.3% for AGIs $100k-200k , 5630.0% for AGIs over 200k ) Self-employed (Keogh) retirement plans: $18,850 (reported on 0.2% of returns )49006:
$18,850Michigan:
$25,132
(% of AGI for various income ranges: 16.8% for AGIs $25k-50k ) Total itemized deductions: $32,833 (reported on 4.5% of returns )Here:
$32,833State:
$34,117
(% of AGI for various income ranges: 22.3% for AGIs below $25k , 66.2% for AGIs $25k-50k , 264.5% for AGIs $50k-75k , 373.7% for AGIs $75k-100k , 796.9% for AGIs $100k-200k , 8274.0% for AGIs over 200k ) Charity contributions: $12,387 (reported on 3.9% of returns )Here:
$12,387State:
$13,548
(% of AGI for various income ranges: 3.0% for AGIs below $25k , 11.9% for AGIs $25k-50k , 48.0% for AGIs $50k-75k , 101.0% for AGIs $75k-100k , 226.5% for AGIs $100k-200k , 4556.0% for AGIs over 200k ) Taxes paid: $6,872 (reported on 4.5% of returns )(% of AGI for various income ranges: 3.7% for AGIs below $25k , 9.6% for AGIs $25k-50k , 51.8% for AGIs $50k-75k , 87.9% for AGIs $75k-100k , 215.8% for AGIs $100k-200k , 1448.0% for AGIs over 200k ) Earned income credit: $2,197 (reported on 14.6% of returns )(% of AGI for various income ranges: 63.6% for AGIs below $25k , 52.9% for AGIs $25k-50k ) Percentage of individuals using paid preparers for their 2020 taxes: 93.4%(% for various income ranges: 93.6% for AGIs below $25k , 93.8% for AGIs $25k-50k , 93.5% for AGIs $50k-75k , 92.5% for AGIs $75k-100k , 91.7% for AGIs $100k-200k , 94.1% for AGIs over 200k )
Averages for the 2012 tax year for zip code 49006, filed in 2013:
Average Adjusted Gross Income (AGI) in 2012: $39,263 (Individual Income Tax Returns) Here:
$39,263State:
$55,609
Salary/wage: $33,034 (reported on 84.8% of returns )Here:
$33,034State:
$46,782
(% of AGI for various income ranges: 81.0% for AGIs below $25k , 80.7% for AGIs $25k-50k , 76.7% for AGIs $50k-75k , 70.2% for AGIs $75k-100k , 68.8% for AGIs $100k-200k , 38.3% for AGIs over 200k ) Taxable interest for individuals: $1,078 (reported on 27.9% of returns )This zip code:
$1,078Michigan:
$1,491
(% of AGI for various income ranges: 0.9% for AGIs below $25k , 0.7% for AGIs $25k-50k , 0.6% for AGIs $50k-75k , 0.7% for AGIs $75k-100k , 0.8% for AGIs $100k-200k , 0.9% for AGIs over 200k ) Ordinary dividends: $5,023 (reported on 17.7% of returns )(% of AGI for various income ranges: 1.2% for AGIs below $25k , 1.3% for AGIs $25k-50k , 1.7% for AGIs $50k-75k , 2.1% for AGIs $75k-100k , 2.8% for AGIs $100k-200k , 5.7% for AGIs over 200k ) Net capital gain/loss in AGI: +$6,157 (reported on 13.4% of returns )Here:
+$6,157State:
+$9,326
(% of AGI for various income ranges: 0.5% for AGIs $50k-75k , 1.0% for AGIs $75k-100k , 2.7% for AGIs $100k-200k , 12.2% for AGIs over 200k ) Profit/loss from business: +$9,496 (reported on 12.3% of returns )Here:
+$9,496State:
+$11,523
(% of AGI for various income ranges: 6.3% for AGIs below $25k , 2.1% for AGIs $25k-50k , 2.0% for AGIs $50k-75k , 1.8% for AGIs $75k-100k , 3.1% for AGIs $100k-200k , 3.1% for AGIs over 200k ) Taxable individual retirement arrangement distribution: $14,444 (reported on 10.4% of returns )49006:
$14,444Michigan:
$15,298
(% of AGI for various income ranges: 2.9% for AGIs below $25k , 2.8% for AGIs $25k-50k , 3.8% for AGIs $50k-75k , 5.9% for AGIs $75k-100k , 5.1% for AGIs $100k-200k , 1.5% for AGIs over 200k ) Self-employment retirement plans: $12,567 (reported on 0.3% of returns )49006:
$12,567Michigan:
$20,834
Total itemized deductions: $17,459 (20% of AGI, reported on 22.6% of returns )Here:
$17,459State:
$21,628
Here:
20.2% of AGIState:
18.4% of AGI
(% of AGI for various income ranges: 5.4% for AGIs below $25k , 8.2% for AGIs $25k-50k , 11.1% for AGIs $50k-75k , 11.0% for AGIs $75k-100k , 13.0% for AGIs $100k-200k , 10.9% for AGIs over 200k ) Charity contributions: $3,854 (reported on 18.7% of returns )(% of AGI for various income ranges: 0.6% for AGIs below $25k , 1.2% for AGIs $25k-50k , 1.9% for AGIs $50k-75k , 2.1% for AGIs $75k-100k , 2.7% for AGIs $100k-200k , 2.5% for AGIs over 200k ) Taxes paid: $6,267 (reported on 22.6% of returns )(% of AGI for various income ranges: 1.1% for AGIs below $25k , 2.5% for AGIs $25k-50k , 3.7% for AGIs $50k-75k , 3.8% for AGIs $75k-100k , 5.6% for AGIs $100k-200k , 4.7% for AGIs over 200k ) Earned income credit: $2,126 (reported on 16.4% of returns )(% of AGI for various income ranges: 5.0% for AGIs below $25k , 0.7% for AGIs $25k-50k ) Percentage of individuals using paid preparers for their 2012 taxes: 42.3%(% for various income ranges: 37.1% for AGIs below $25k , 43.6% for AGIs $25k-50k , 48.1% for AGIs $50k-75k , 52.2% for AGIs $75k-100k , 54.2% for AGIs $100k-200k , 77.8% for AGIs over 200k )
Averages for the 2004 tax year for zip code 49006, filed in 2005:
Average Adjusted Gross Income (AGI) in 2004: $34,211 (Individual Income Tax Returns) Here:
$34,211State:
$48,204
Salary/wage: $31,024 (reported on 83.3% of returns )Here:
$31,024State:
$42,791
(% of AGI for various income ranges: 89.3% for AGIs below $10k , 75.8% for AGIs $10k-25k , 80.5% for AGIs $25k-50k , 77.7% for AGIs $50k-75k , 73.6% for AGIs $75k-100k , 67.0% for AGIs over 100k ) Taxable interest for individuals: $1,405 (reported on 41.3% of returns )This zip code:
$1,405Michigan:
$1,725
(% of AGI for various income ranges: 2.7% for AGIs below $10k , 2.8% for AGIs $10k-25k , 1.6% for AGIs $25k-50k , 1.6% for AGIs $50k-75k , 1.4% for AGIs $75k-100k , 1.3% for AGIs over 100k ) Taxable dividends: $3,311 (reported on 23.5% of returns )(% of AGI for various income ranges: 2.5% for AGIs below $10k , 2.1% for AGIs $10k-25k , 1.4% for AGIs $25k-50k , 2.0% for AGIs $50k-75k , 2.0% for AGIs $75k-100k , 3.7% for AGIs over 100k ) Net capital gain/loss: +$3,616 (reported on 19.1% of returns )Here:
+$3,616State:
+$8,532
(% of AGI for various income ranges: -1.8% for AGIs below $10k , 0.1% for AGIs $10k-25k , 0.4% for AGIs $25k-50k , 0.8% for AGIs $50k-75k , 1.6% for AGIs $75k-100k , 6.9% for AGIs over 100k ) Profit/loss from business: +$8,734 (reported on 11.8% of returns )Here:
+$8,734State:
+$9,547
(% of AGI for various income ranges: 3.5% for AGIs below $10k , 3.2% for AGIs $10k-25k , 2.8% for AGIs $25k-50k , 2.0% for AGIs $50k-75k , 2.6% for AGIs $75k-100k , 4.4% for AGIs over 100k ) IRA payment deduction: $2,363 (reported on 2.1% of returns )49006:
$2,363Michigan:
$2,875
(% of AGI for various income ranges: 0.2% for AGIs $10k-25k , 0.2% for AGIs $25k-50k , 0.1% for AGIs $50k-75k , 0.1% for AGIs $75k-100k , 0.1% for AGIs over 100k ) Self-employed pension: $10,135 (reported on 0.4% of returns )Here:
$10,135Michigan:
$13,826
Total itemized deductions: $14,447 (22% of AGI, reported on 29.6% of returns )Here:
$14,447State:
$18,509
Here:
22.1% of AGIState:
20.7% of AGI
(% of AGI for various income ranges: 8.6% for AGIs below $10k , 9.8% for AGIs $10k-25k , 11.5% for AGIs $25k-50k , 14.3% for AGIs $50k-75k , 14.3% for AGIs $75k-100k , 12.8% for AGIs over 100k ) Charity contributions deductions: $3,459 (5% of AGI, reported on 25.1% of returns )Here:
4.9% of AGIState:
3.6% of AGI
(% of AGI for various income ranges: 0.4% for AGIs below $10k , 1.3% for AGIs $10k-25k , 2.0% for AGIs $25k-50k , 2.7% for AGIs $50k-75k , 3.1% for AGIs $75k-100k , 3.6% for AGIs over 100k ) Total tax: $4,979 (reported on 70.3% of returns )(% of AGI for various income ranges: 1.9% for AGIs below $10k , 4.2% for AGIs $10k-25k , 7.8% for AGIs $25k-50k , 9.7% for AGIs $50k-75k , 11.5% for AGIs $75k-100k , 17.2% for AGIs over 100k ) Earned income credit: $1,570 (reported on 12.2% of returns )Percentage of individuals using paid preparers for their 2004 taxes: 50.3%(% for various income ranges: 39.2% for AGIs below $10k , 56.7% for AGIs $10k-25k , 51.3% for AGIs $25k-50k , 54.7% for AGIs $50k-75k , 55.2% for AGIs $75k-100k , 62.4% for AGIs over 100k )
Estimated median household income in 2022: This zip code:
$45,740Michigan:
$66,986
Nearest zip codes: 49008 ,
49007 ,
49009 ,
49001 ,
49024 ,
49004 .
Kalamazoo Zip Code Map
Percentage of family households: This zip code:
26.4%Michigan:
43.3%
Percentage of households with unmarried partners: This zip code:
10.1%Michigan:
45.7%
Likely homosexual households (counted as self-reported same-sex unmarried-partner households)
Lesbian couples: 0.2% of all households Gay men: 0.4% of all households
Household received Food Stamps/SNAP in the past 12 months: 1,434Household did not receive Food Stamps/SNAP in the past 12 months: 9,555
Women who had a birth in the past 12 months: 234 (95 now married , 135 unmarried) Women who did not have a birth in the past 12 months: 9,389 (1,369 now married , 8,073 unmarried)
Housing units in zip code 49006 with a mortgage: 2,434 (116
second mortgage , 10
home equity loan , 85
both second mortgage and home equity loan )
Houses without a mortgage: 250
Median monthly owner costs for units with a mortgage: $1,203
Median monthly owner costs for units without a mortgage: $600
Residents with income below the poverty level in 2022:
This zip code:
35.4%Whole state:
13.4%
Residents with income below 50% of the poverty level in 2022:
This zip code:
14.5%Whole state:
6.9%
Median number of rooms in houses and condos: Median number of rooms in apartments: Notable locations in this zip code not listed on our city pages
Click to draw/clear zip code borders Notable locations in zip code 49006: (A) , Kalamazoo Township Fire Department Station 4 Westwood (B) , Miller Auditorium (C) , Knauss Hall (D) , Faunce Student Services Building (E) , Woodlawn Place (F) , Fetzer Center (G) . Display/hide their locations on the map
Shopping Center: (1) . Display/hide its location on the map
Churches in zip code 49006 include: (A) , Saint Thomas More Catholic Church (B) , Grace Fellowship Church (C) , Agape Christian Church (D) , Church of God Westwood (E) , Westwood Christian Reformed Church (F) , Westwood United Methodist Church (G) , Immanuel Lutheran Church (H) , Latvian Evangelical Lutheran Church (I) . Display/hide their locations on the map
Cemeteries: (1) , Mountain Home Cemetery (2) , Jewish Mountain Home Cemetery (3) , Mount Ever-Rest Memorial Park North (4) . Display/hide their locations on the map
Creek: (A) . Display/hide its location on the map
Parks in zip code 49006 include: (1) , Edward Israel Arctic Pioneer Historical Marker (2) , Kalamazoo College Historical Marker (3) , Stuart Neighborhood Historical Marker (4) , Henderson Park West Main Hill Historic District Historical Marker (5) , Jones Park (6) , Knollwood Park (7) . Display/hide their locations on the map
Year house built (houses)
38 2020 or later1,094 2010 to 2019927 2000 to 20091,367 1990 to 19991,518 1980 to 19892,195 1970 to 19791,666 1960 to 19691,344 1950 to 1959777 1940 to 19491,080 1939 or earlier
Zip code 49006 household income distribution in 2022 1,236 Less than $10,0001,040 $10,000 to $14,999707 $15,000 to $19,999555 $20,000 to $24,999468 $25,000 to $29,999619 $30,000 to $34,999503 $35,000 to $39,999440 $40,000 to $44,999314 $45,000 to $49,999933 $50,000 to $59,9991,151 $60,000 to $74,999971 $75,000 to $99,999950 $100,000 to $124,999313 $125,000 to $149,999364 $150,000 to $199,999517 $200,000 or moreEstimate of home value of owner-occupied houses/condos in 2022 in zip code 49006 13 Less than $10,00010 $10,000 to $14,99925 $30,000 to $34,99928 $40,000 to $49,9993 $50,000 to $59,99927 $60,000 to $69,99918 $70,000 to $79,99949 $80,000 to $89,99938 $90,000 to $99,999348 $100,000 to $124,999395 $125,000 to $149,999645 $150,000 to $174,999550 $175,000 to $199,999912 $200,000 to $249,999319 $250,000 to $299,999112 $300,000 to $399,99970 $400,000 to $499,99997 $500,000 to $749,999Rent paid by renters in 2022 in zip code 49006 171 Less than $10030 $150 to $19935 $200 to $24984 $250 to $29928 $300 to $349233 $350 to $399138 $400 to $449326 $450 to $499254 $500 to $549149 $550 to $599593 $600 to $649309 $650 to $699161 $700 to $749331 $750 to $799715 $800 to $899385 $900 to $9991,197 $1,000 to $1,249388 $1,250 to $1,4991,065 $1,500 to $1,999164 $2,000 to $2,499109 $3,500 or more93 No cash rent
Median gross rent in 2022: $986.
Median price asked for vacant for-sale houses and condos in 2022: $104,261.
Estimated median house (or condo) value in 2022 for: White Non-Hispanic householders: $205,995Black or African American householders: $204,296Asian householders: $201,747Some other race householders: $122,110Two or more races householders: $214,489Hispanic or Latino householders: $150,142Estimated median house or condo value in 2022: $201,748
49006:
$201,748Michigan:
$224,400
Lower value quartile - upper value quartile: $156,568 - $251,627
Mean price in 2022: Detached houses: $234,130Here:
$234,130State:
$280,038
Townhouses or other attached units: $171,482Here:
$171,482State:
$239,520
In 5-or-more-unit structures: $202,544Here:
$202,544State:
$192,733
Mobile homes: $37,759Here:
$37,759State:
$72,868
Housing units in structures:
One, detached: 4,473One, attached: 492Two: 1383 or 4: 7615 to 9: 1,74910 to 19: 1,74620 to 49: 1,74650 or more: 767Mobile homes: 101Unemployment : 5.3%
Means of transportation to work in zip code 49006 71.0% 10,553 Drove a car alone5.5% 824 Carpooled2.1% 309 Bus or trolley bus0.1% 16 Streetcar or trolley car0.3% 50 Taxi0.3% 45 Bicycle7.8% 1,161 Walked1.1% 164 Other means10.7% 1,584 Worked at homeTravel time to work (commute) in zip code 49006 396 Less than 5 minutes2,269 5 to 9 minutes2,842 10 to 14 minutes3,031 15 to 19 minutes1,617 20 to 24 minutes795 25 to 29 minutes993 30 to 34 minutes190 35 to 39 minutes175 40 to 44 minutes416 45 to 59 minutes378 60 to 89 minutes51 90 or more minutes
Neighborhoods in zip code 49006: Percentage of zip code residents living and working in this county: 92.9%
Household type by relationship:
Households: 26,666
Male householders: 4,606 (1,784 living alone ), Female householders: 6,415 (2,385 living alone )2,407 spouses (2,310 opposite-sex spouses ), 949 unmarried partners , (847 opposite-sex unmarried partners ), 3,998 children (3,606 natural , 153 adopted , 236 stepchildren ), 105 grandchildren , 252 brothers or sisters , 77 parents , 7 foster children , 124 other relatives , 4,961 non-relatives In group quarters: 2,590 (-1 institutionalized population )
Size of family households: 1,731 2-persons , 1,073 3-persons , 381 4-persons , 281 5-persons , 122 6-persons , 37 7-or-more-persons
Size of nonfamily households: 4,170 1-person , 1,608 2-persons , 744 3-persons , 778 4-persons , 92 5-persons , 88 6-persons , 56 7-or-more-persons
1,987 married couples with children. single-parent households (368 men , 903 women ).
88.0% of residents of 49006 zip code speak English at home. of residents speak Spanish at home (89% very well, 5% well, 5% not at all ).of residents speak other Indo-European language at home (88% very well, 9% well, 3% not well ).of residents speak Asian or Pacific Island language at home (62% very well, 35% well, 4% not well ).of residents speak other language at home (62% very well, 23% well, 15% not well ).
Foreign born population: 2,404 (9.0%)
(29.7%
of them are naturalized citizens )
This zip code:
9.0%Whole state:
6.9%
21% Bhutan 16% Honduras 9% Congo 6% Japan 5% Afghanistan 4% Nepal 4% El Salvador 10% American 7% German 6% English 6% Irish 5% Dutch 5% European 3% Polish
Year of entry for the foreign-born population
2,025 2010 or later 383 2000 to 2009 287 1990 to 1999 234 Before 1990
Facilities with environmental interests located in this zip code:
ARCADIA ELEMENTARY SCHOOL (932 BOSWELL LANE in KALAMAZOO, MI)
(National Center for Education Statistics) - STATE ID-00113 Organizations: KALAMAZOO PUBLIC SCHOOL DISTRICT (SCHOOL DISTRICT)
ANGELL FIELD WAREHOUSE (506 BURROWS in KALAMAZOO, MI)
(Resource Conservation and Recovery Act (tracking hazardous waste))
FROST WESTWOOD STANDARD (4702 W MAIN in KALAMAZOO, MI)
(Resource Conservation and Recovery Act (tracking hazardous waste))
EARLEY & ASSOCIATES INC (3917 RAVINE RD in KALAMAZOO, MI)
Small Quantity Generators, between 100 kg and 1000 kg of hazardous waste/month (Resource Conservation and Recovery Act (tracking hazardous waste)) - notification Organizations: TOM EARLEY (CONTACT/OWNER)
Alternative names: BLAYLOCK AND EARLEY CONSTRUCTION INC
Housing units lacking complete plumbing facilities: 0.2%
Housing units lacking complete kitchen facilities: 0.2%
66.5% Utility gas 30.5% Electricity 1.2% Bottled, tank, or LP gas 0.9% Fuel oil, kerosene, etc. 0.5% No fuel used
Place of birth for U.S.-born residents:
This state: 18,305Northeast: 653Midwest: 3,157South: 1,216West: 610
35% of the 49006 zip code residents lived in the same house 5 years ago.
Out of people who lived in different houses, 37% lived in this county.
Out of people who lived in different counties, 50% lived in Michigan.
84% of the 49006 zip code residents lived in the same house 1 year ago.
Out of people who lived in different houses, 60% moved from this county.
Out of people who lived in different houses, 20% moved from different county within same state.
Out of people who lived in different houses, 13% moved from different state.
Out of people who lived in different houses, 5% moved from abroad.
Private vs. public school enrollment:
Students in private schools in grades 1 to 8 (elementary and middle school): 64
Students in private schools in grades 9 to 12 (high school): 81
Students in private undergraduate colleges: 895
Occupation by median earnings in the past 12 months ($)
77,507 Computer and mathematical occupations 69,489 Architecture and engineering occupations 63,192 Life, physical, and social science occupations 62,091 Health diagnosing and treating practitioners and other technical occupations 61,350 Management occupations 56,218 Legal occupations
Companies with federal contracts located in this zip code:
PRECISION POLYMER MANUFACTURIN (3915 RAVINE RD in KALAMAZOO, MI; small business) in 79 contracts from 1999 to 2006
Contracts for Clothing, Special Purpose, Individual Equipment, , Boxes, Cartons, and Crates by Defense Logistics Agency, National Oceanic and Atmospheric Administration/Under Secretary for Oceans and Atmosphere, Federal Supply ServiceSigned by year: 2000: $0; 2001: $351,936; 2002: $122,457; 2003: $0; 2004: $231,723; 2005: $182,601; 2006: $165,216.
Biggest contracts: with Defense Logistics Agency for Clothing, Special Purpose. Signed on 2001-12-07. Completion date: 2003-03-29.
with Defense Logistics Agency for Individual Equipment. Signed on 1999-10-27. Completion date: 2000-01-25.
, same as above. Signed on 2001-04-25. Completion date: 2002-04-02.
, same as above. Signed on 2002-05-10. Completion date: 2003-02-17.
MULDER WATERPROOFING & SEALANT (3415 RAVINE ROAD in KALAMAZOO, MI; small business) in 2 contracts in 2001
$2,980 with Army for Maintenance, Repair or Alteration of Real Property -- Maintenance Buildings. Signed on 2001-03-01. Completion date: 2001-02-28.
, same as above. Signed on 2001-04-24. Completion date: 2001-02-28.
Top industries in this zip code by the number of employees in 2005:
Educational Services: Colleges, Universities, and Professional Schools (500-999 employees: 1 establishment)Health Care and Social Assistance: Continuing Care Retirement Communities (250-499: 1)Health Care and Social Assistance: Nursing Care Facilities (100-249: 2)Accommodation and Food Services: Limited-Service Restaurants (20-49: 7, 10-19: 3, 5-9: 2, 1-4: 1)Administrative and Support and Waste Management and Remediation Services: Security Guards and Patrol Services (100-249: 1)Health Care and Social Assistance: Offices of Dentists (10-19: 6, 5-9: 6, 1-4: 3)Health Care and Social Assistance: Offices of Physicians (except Mental Health Specialists) (50-99: 1, 10-19: 2, 5-9: 2, 1-4: 2)Accommodation and Food Services: Full-Service Restaurants (20-49: 2, 10-19: 1, 5-9: 5, 1-4: 2)Information: Radio Stations (50-99: 1, 20-49: 1)Health Care and Social Assistance: Child Day Care Services (20-49: 2, 5-9: 2, 1-4: 3)
People in group quarters in 2010:
3,999 people in college/university student housing
162 people in nursing facilities/skilled-nursing facilities
12 people in group homes intended for adults
8 people in workers' group living quarters and job corps centers
7 people in emergency and transitional shelters (with sleeping facilities) for people experiencing homelessness
2 people in other noninstitutional facilities
People in group quarters in 2000:
1,233 people in college dormitories (includes college quarters off campus)
309 people in nursing homes
93 people in other noninstitutional group quarters
14 people in other group homes
Fatal accident statistics in 2014:
Fatal accident count: 1Vehicles involved in fatal accidents: 2Fatal accidents caused by drunken drivers: 0Fatalities: 1Persons involved in fatal accidents: 2Pedestrians involved in fatal accidents: 0
Fatal accident statistics in 2013:
Fatal accident count: 1Vehicles involved in fatal accidents: 1Fatal accidents caused by drunken drivers: 0Fatalities: 1Persons involved in fatal accidents: 1Pedestrians involved in fatal accidents: 1
Home Mortgage Disclosure Act Aggregated Statistics For Year 2009(Based on 6 full and 6 partial tracts) A) FHA, FSA/RHS & VA B) Conventional C) Refinancings D) Home Improvement Loans E) Loans on Dwellings For 5+ Families F) Non-occupant Loans on G) Loans On Manufactured Number Average Value Number Average Value Number Average Value Number Average Value Number Average Value Number Average Value Number Average Value
LOANS ORIGINATED 215 $99,993 88 $92,002 456 $104,213 37 $37,258 2 $2,696,220 24 $115,341 4 $56,392 APPLICATIONS APPROVED, NOT ACCEPTED 6 $93,332 12 $88,418 35 $90,100 2 $21,185 0 $0 4 $65,908 0 $0 APPLICATIONS DENIED 24 $74,312 12 $89,901 138 $116,866 18 $39,916 0 $0 13 $130,974 2 $4,115 APPLICATIONS WITHDRAWN 19 $102,387 9 $72,996 88 $112,548 4 $12,948 0 $0 2 $55,715 0 $0 FILES CLOSED FOR INCOMPLETENESS 0 $0 3 $93,857 13 $115,320 0 $0 0 $0 0 $0 0 $0
Aggregated Statistics For Year 2008(Based on 6 full and 6 partial tracts) A) FHA, FSA/RHS & VA B) Conventional C) Refinancings D) Home Improvement Loans E) Loans on Dwellings For 5+ Families F) Non-occupant Loans on G) Loans On Manufactured Number Average Value Number Average Value Number Average Value Number Average Value Number Average Value Number Average Value Number Average Value
LOANS ORIGINATED 150 $101,776 159 $93,113 230 $97,943 28 $46,943 3 $477,283 60 $72,398 3 $112,483 APPLICATIONS APPROVED, NOT ACCEPTED 9 $95,150 13 $49,733 33 $100,634 4 $11,470 0 $0 3 $71,403 6 $26,832 APPLICATIONS DENIED 22 $104,910 23 $59,702 156 $125,498 19 $39,424 0 $0 18 $144,047 7 $30,180 APPLICATIONS WITHDRAWN 23 $110,012 15 $147,896 70 $114,308 6 $44,318 0 $0 13 $169,718 0 $0 FILES CLOSED FOR INCOMPLETENESS 2 $102,475 3 $32,407 12 $129,463 2 $95,865 0 $0 5 $143,300 0 $0
Aggregated Statistics For Year 2007(Based on 6 full and 6 partial tracts) A) FHA, FSA/RHS & VA B) Conventional C) Refinancings D) Home Improvement Loans E) Loans on Dwellings For 5+ Families F) Non-occupant Loans on G) Loans On Manufactured Number Average Value Number Average Value Number Average Value Number Average Value Number Average Value Number Average Value Number Average Value
LOANS ORIGINATED 54 $112,919 381 $92,670 364 $97,469 68 $42,588 10 $1,660,395 109 $99,793 4 $61,302 APPLICATIONS APPROVED, NOT ACCEPTED 4 $136,600 32 $104,042 89 $76,937 19 $36,382 0 $0 22 $73,799 2 $7,990 APPLICATIONS DENIED 6 $134,127 71 $92,814 283 $108,844 60 $39,909 2 $5,888,135 55 $72,363 3 $35,110 APPLICATIONS WITHDRAWN 7 $156,043 35 $97,933 111 $107,611 14 $44,342 3 $1,251,920 15 $91,104 0 $0 FILES CLOSED FOR INCOMPLETENESS 0 $0 7 $91,477 25 $129,655 0 $0 0 $0 3 $82,000 0 $0
Aggregated Statistics For Year 2006(Based on 6 full and 6 partial tracts) A) FHA, FSA/RHS & VA B) Conventional C) Refinancings D) Home Improvement Loans E) Loans on Dwellings For 5+ Families F) Non-occupant Loans on G) Loans On Manufactured Number Average Value Number Average Value Number Average Value Number Average Value Number Average Value Number Average Value Number Average Value
LOANS ORIGINATED 71 $118,905 684 $94,872 372 $94,130 105 $38,190 10 $2,171,251 203 $112,405 0 $0 APPLICATIONS APPROVED, NOT ACCEPTED 4 $97,998 86 $92,107 103 $90,503 9 $9,418 0 $0 14 $86,604 2 $32,915 APPLICATIONS DENIED 1 $116,090 114 $96,880 332 $100,341 84 $41,609 0 $0 52 $98,071 14 $30,345 APPLICATIONS WITHDRAWN 3 $109,773 60 $91,019 169 $102,015 16 $39,672 0 $0 23 $82,522 0 $0 FILES CLOSED FOR INCOMPLETENESS 2 $111,845 8 $94,018 76 $119,536 0 $0 0 $0 2 $64,910 1 $110,560
Aggregated Statistics For Year 2005(Based on 6 full and 6 partial tracts) A) FHA, FSA/RHS & VA B) Conventional C) Refinancings D) Home Improvement Loans E) Loans on Dwellings For 5+ Families F) Non-occupant Loans on G) Loans On Manufactured Number Average Value Number Average Value Number Average Value Number Average Value Number Average Value Number Average Value Number Average Value
LOANS ORIGINATED 76 $118,230 593 $98,301 545 $100,828 80 $37,703 24 $2,241,224 239 $125,351 3 $7,133 APPLICATIONS APPROVED, NOT ACCEPTED 0 $0 71 $76,079 78 $97,029 4 $66,055 0 $0 23 $100,777 7 $23,260 APPLICATIONS DENIED 1 $258,430 87 $84,110 347 $104,738 50 $66,063 3 $497,363 66 $103,316 11 $20,632 APPLICATIONS WITHDRAWN 3 $132,767 42 $74,708 235 $113,224 14 $119,209 0 $0 20 $108,193 2 $134,810 FILES CLOSED FOR INCOMPLETENESS 2 $125,175 25 $106,065 141 $112,049 0 $0 0 $0 15 $75,935 0 $0
Aggregated Statistics For Year 2004(Based on 6 full and 6 partial tracts) A) FHA, FSA/RHS & VA B) Conventional C) Refinancings D) Home Improvement Loans E) Loans on Dwellings For 5+ Families F) Non-occupant Loans on G) Loans On Manufactured Number Average Value Number Average Value Number Average Value Number Average Value Number Average Value Number Average Value Number Average Value
LOANS ORIGINATED 107 $109,159 519 $93,749 686 $99,748 74 $44,714 21 $1,107,646 182 $121,086 14 $34,950 APPLICATIONS APPROVED, NOT ACCEPTED 8 $103,194 39 $87,416 107 $83,030 6 $14,628 2 $828,660 10 $62,644 0 $0 APPLICATIONS DENIED 11 $91,342 88 $66,542 340 $102,812 50 $32,120 4 $236,668 34 $94,378 16 $56,906 APPLICATIONS WITHDRAWN 0 $0 36 $89,220 119 $95,008 9 $51,760 1 $187,950 13 $93,245 2 $126,350 FILES CLOSED FOR INCOMPLETENESS 2 $128,340 14 $77,444 79 $119,315 8 $33,660 0 $0 5 $72,288 0 $0
Aggregated Statistics For Year 2003(Based on 6 full and 6 partial tracts) A) FHA, FSA/RHS & VA B) Conventional C) Refinancings D) Home Improvement Loans E) Loans on Dwellings For 5+ Families F) Non-occupant Loans on Number Average Value Number Average Value Number Average Value Number Average Value Number Average Value Number Average Value
LOANS ORIGINATED 145 $115,046 439 $98,189 1,629 $89,167 68 $30,426 11 $3,235,828 248 $111,566 APPLICATIONS APPROVED, NOT ACCEPTED 6 $110,505 33 $84,007 222 $90,113 7 $12,766 2 $117,475 33 $90,376 APPLICATIONS DENIED 3 $90,283 84 $69,013 349 $94,548 39 $29,026 0 $0 48 $104,049 APPLICATIONS WITHDRAWN 12 $118,456 48 $95,231 227 $93,682 5 $60,346 0 $0 19 $73,932 FILES CLOSED FOR INCOMPLETENESS 4 $91,825 15 $92,893 48 $101,604 0 $0 0 $0 6 $164,815
Aggregated Statistics For Year 2002(Based on 6 full and 6 partial tracts) A) FHA, FSA/RHS & VA B) Conventional C) Refinancings D) Home Improvement Loans E) Loans on Dwellings For 5+ Families F) Non-occupant Loans on Number Average Value Number Average Value Number Average Value Number Average Value Number Average Value Number Average Value
LOANS ORIGINATED 109 $105,092 381 $97,990 1,107 $87,014 70 $21,835 20 $1,013,155 160 $101,405 APPLICATIONS APPROVED, NOT ACCEPTED 9 $120,817 32 $85,933 168 $79,202 18 $11,438 0 $0 9 $63,608 APPLICATIONS DENIED 5 $69,970 61 $53,662 246 $90,053 35 $20,267 2 $2,708,640 18 $92,824 APPLICATIONS WITHDRAWN 7 $148,251 24 $83,650 147 $84,920 2 $15,920 0 $0 13 $61,616 FILES CLOSED FOR INCOMPLETENESS 7 $102,040 10 $177,789 85 $91,456 0 $0 0 $0 4 $87,252
Aggregated Statistics For Year 2001(Based on 6 full and 6 partial tracts) A) FHA, FSA/RHS & VA B) Conventional C) Refinancings D) Home Improvement Loans E) Loans on Dwellings For 5+ Families F) Non-occupant Loans on Number Average Value Number Average Value Number Average Value Number Average Value Number Average Value Number Average Value
LOANS ORIGINATED 160 $102,350 440 $81,564 823 $81,283 125 $18,331 5 $805,024 160 $104,334 APPLICATIONS APPROVED, NOT ACCEPTED 9 $110,446 40 $72,048 83 $62,959 20 $36,073 0 $0 4 $43,078 APPLICATIONS DENIED 10 $75,391 122 $43,602 274 $82,990 77 $14,118 1 $152,020 29 $67,135 APPLICATIONS WITHDRAWN 4 $101,820 23 $69,597 136 $77,810 0 $0 0 $0 20 $80,140 FILES CLOSED FOR INCOMPLETENESS 1 $99,500 11 $103,485 41 $100,276 2 $27,855 0 $0 5 $81,422
Aggregated Statistics For Year 2000(Based on 6 full and 6 partial tracts) A) FHA, FSA/RHS & VA B) Conventional C) Refinancings D) Home Improvement Loans E) Loans on Dwellings For 5+ Families F) Non-occupant Loans on Number Average Value Number Average Value Number Average Value Number Average Value Number Average Value Number Average Value
LOANS ORIGINATED 110 $87,307 467 $77,213 309 $65,467 103 $17,612 9 $404,534 122 $67,886 APPLICATIONS APPROVED, NOT ACCEPTED 3 $85,197 46 $60,009 83 $62,325 39 $20,281 0 $0 10 $60,201 APPLICATIONS DENIED 3 $80,850 261 $44,106 208 $69,859 60 $17,091 0 $0 29 $63,330 APPLICATIONS WITHDRAWN 7 $94,054 42 $78,465 91 $62,780 13 $68,522 0 $0 18 $56,551 FILES CLOSED FOR INCOMPLETENESS 2 $89,540 7 $79,756 40 $71,873 0 $0 0 $0 0 $0
Aggregated Statistics For Year 1999(Based on 3 full and 4 partial tracts) A) FHA, FSA/RHS & VA B) Conventional C) Refinancings D) Home Improvement Loans E) Loans on Dwellings For 5+ Families F) Non-occupant Loans on Number Average Value Number Average Value Number Average Value Number Average Value Number Average Value Number Average Value
LOANS ORIGINATED 75 $90,903 215 $78,002 292 $64,154 69 $14,792 2 $651,985 56 $54,532 APPLICATIONS APPROVED, NOT ACCEPTED 3 $58,997 32 $44,527 36 $55,720 13 $18,774 0 $0 4 $60,228 APPLICATIONS DENIED 4 $61,165 117 $44,738 72 $58,149 30 $13,472 2 $140,975 12 $59,774 APPLICATIONS WITHDRAWN 6 $94,572 12 $73,708 57 $67,416 11 $56,368 0 $0 5 $30,968 FILES CLOSED FOR INCOMPLETENESS 0 $0 1 $44,280 18 $77,304 0 $0 0 $0 1 $44,990
Private Mortgage Insurance Companies Aggregated Statistics For Year 2009(Based on 6 full and 2 partial tracts) A) Conventional B) Refinancings Number Average Value Number Average Value
LOANS ORIGINATED 27 $113,070 19 $118,333 APPLICATIONS APPROVED, NOT ACCEPTED 7 $168,027 2 $99,490 APPLICATIONS DENIED 1 $69,100 8 $99,490 APPLICATIONS WITHDRAWN 0 $0 0 $0 FILES CLOSED FOR INCOMPLETENESS 0 $0 0 $0
Aggregated Statistics For Year 2008(Based on 6 full and 6 partial tracts) A) Conventional B) Refinancings C) Non-occupant Loans on Number Average Value Number Average Value Number Average Value
LOANS ORIGINATED 49 $97,046 28 $110,724 10 $62,937 APPLICATIONS APPROVED, NOT ACCEPTED 14 $122,532 18 $160,178 0 $0 APPLICATIONS DENIED 0 $0 0 $0 0 $0 APPLICATIONS WITHDRAWN 0 $0 1 $113,320 0 $0 FILES CLOSED FOR INCOMPLETENESS 0 $0 0 $0 0 $0
Aggregated Statistics For Year 2007(Based on 6 full and 4 partial tracts) A) Conventional B) Refinancings C) Non-occupant Loans on Number Average Value Number Average Value Number Average Value
LOANS ORIGINATED 150 $108,757 40 $144,403 10 $87,364 APPLICATIONS APPROVED, NOT ACCEPTED 19 $123,857 5 $114,508 2 $134,135 APPLICATIONS DENIED 2 $50,195 0 $0 0 $0 APPLICATIONS WITHDRAWN 8 $84,064 0 $0 0 $0 FILES CLOSED FOR INCOMPLETENESS 0 $0 2 $198,720 0 $0
Aggregated Statistics For Year 2006(Based on 6 full and 4 partial tracts) A) Conventional B) Refinancings C) Non-occupant Loans on Number Average Value Number Average Value Number Average Value
LOANS ORIGINATED 83 $117,800 39 $130,207 17 $109,406 APPLICATIONS APPROVED, NOT ACCEPTED 15 $125,575 15 $144,300 4 $110,110 APPLICATIONS DENIED 0 $0 0 $0 0 $0 APPLICATIONS WITHDRAWN 0 $0 1 $84,300 0 $0 FILES CLOSED FOR INCOMPLETENESS 2 $151,785 0 $0 0 $0
Aggregated Statistics For Year 2005(Based on 6 full and 4 partial tracts) A) Conventional B) Refinancings C) Non-occupant Loans on D) Loans On Manufactured Number Average Value Number Average Value Number Average Value Number Average Value
LOANS ORIGINATED 104 $105,113 46 $138,536 38 $101,507 0 $0 APPLICATIONS APPROVED, NOT ACCEPTED 14 $119,721 10 $104,688 4 $195,740 2 $109,770 APPLICATIONS DENIED 2 $120,830 0 $0 0 $0 0 $0 APPLICATIONS WITHDRAWN 1 $335,830 2 $114,585 0 $0 0 $0 FILES CLOSED FOR INCOMPLETENESS 0 $0 0 $0 0 $0 0 $0
Aggregated Statistics For Year 2004(Based on 6 full and 6 partial tracts) A) Conventional B) Refinancings C) Non-occupant Loans on Number Average Value Number Average Value Number Average Value
LOANS ORIGINATED 122 $98,076 38 $114,437 51 $95,956 APPLICATIONS APPROVED, NOT ACCEPTED 14 $73,797 18 $123,305 12 $113,327 APPLICATIONS DENIED 2 $61,625 4 $108,612 4 $79,245 APPLICATIONS WITHDRAWN 0 $0 2 $96,865 0 $0 FILES CLOSED FOR INCOMPLETENESS 3 $103,687 0 $0 3 $103,687
Aggregated Statistics For Year 2003(Based on 6 full and 6 partial tracts) A) Conventional B) Refinancings C) Non-occupant Loans on Number Average Value Number Average Value Number Average Value
LOANS ORIGINATED 147 $102,539 107 $106,943 37 $81,949 APPLICATIONS APPROVED, NOT ACCEPTED 16 $103,987 27 $123,488 3 $99,043 APPLICATIONS DENIED 6 $75,033 4 $90,535 6 $75,033 APPLICATIONS WITHDRAWN 5 $123,544 3 $117,917 0 $0 FILES CLOSED FOR INCOMPLETENESS 0 $0 0 $0 0 $0
Aggregated Statistics For Year 2002(Based on 6 full and 6 partial tracts) A) Conventional B) Refinancings C) Non-occupant Loans on Number Average Value Number Average Value Number Average Value
LOANS ORIGINATED 106 $99,778 109 $99,401 33 $80,122 APPLICATIONS APPROVED, NOT ACCEPTED 15 $93,025 15 $104,564 3 $48,027 APPLICATIONS DENIED 4 $59,928 1 $223,880 3 $92,183 APPLICATIONS WITHDRAWN 8 $92,739 4 $102,358 4 $62,918 FILES CLOSED FOR INCOMPLETENESS 0 $0 0 $0 0 $0
Aggregated Statistics For Year 2001(Based on 6 full and 6 partial tracts) A) Conventional B) Refinancings C) Non-occupant Loans on Number Average Value Number Average Value Number Average Value
LOANS ORIGINATED 109 $95,479 74 $98,650 26 $78,687 APPLICATIONS APPROVED, NOT ACCEPTED 14 $88,203 6 $116,302 1 $98,120 APPLICATIONS DENIED 4 $85,685 3 $81,077 7 $83,710 APPLICATIONS WITHDRAWN 4 $122,010 2 $158,880 0 $0 FILES CLOSED FOR INCOMPLETENESS 2 $152,235 0 $0 0 $0
Aggregated Statistics For Year 2000(Based on 6 full and 4 partial tracts) A) Conventional B) Refinancings C) Non-occupant Loans on Number Average Value Number Average Value Number Average Value
LOANS ORIGINATED 141 $87,721 18 $86,718 9 $56,277 APPLICATIONS APPROVED, NOT ACCEPTED 12 $73,402 3 $120,797 0 $0 APPLICATIONS DENIED 5 $65,214 0 $0 1 $35,930 APPLICATIONS WITHDRAWN 2 $57,605 2 $111,695 0 $0 FILES CLOSED FOR INCOMPLETENESS 0 $0 0 $0 0 $0
Aggregated Statistics For Year 1999(Based on 3 full and 3 partial tracts) A) Conventional B) Refinancings C) Non-occupant Loans on Number Average Value Number Average Value Number Average Value
LOANS ORIGINATED 78 $87,104 11 $92,125 5 $64,920 APPLICATIONS APPROVED, NOT ACCEPTED 5 $80,414 3 $78,677 0 $0 APPLICATIONS DENIED 1 $31,530 1 $80,440 1 $24,980 APPLICATIONS WITHDRAWN 1 $157,900 0 $0 0 $0 FILES CLOSED FOR INCOMPLETENESS 0 $0 0 $0 0 $0
2002 - 2018 National Fire Incident Reporting System (NFIRS) incidents See full 2006 National Fire Incident Reporting System statistics for zip code 49006, Michigan
Most common first names in zip code 49006 among deceased individuals Name Count Lived (average)
John 76 78.3 years Mary 64 80.1 years Robert 59 74.5 years William 58 78.2 years James 40 75.8 years Helen 38 84.4 years Ruth 34 83.6 years Charles 34 77.5 years Margaret 34 86.3 years Dorothy 31 84.5 years
Most common last names in zip code 49006 among deceased individuals Last name Count Lived (average)
Smith 28 79.5 years Williams 18 71.7 years Brown 18 77.9 years Miller 16 81.9 years Davis 14 76.5 years Devries 11 76.3 years Thomas 11 73.2 years Scott 11 77.5 years Clark 10 84.6 years Johnson 10 78.7 years
Businesses in zip code 49006
Name Count Name Count
7-Eleven 1 Panda Express 1 Cold Stone Creamery 1 Papa John's Pizza 1 Dairy Queen 1 Pizza Hut 1 Domino's Pizza 1 Qdoba Mexican Grill 1 FedEx 1 Subway 1 KFC 1 UPS 1 Little Caesars Pizza 1 Walgreens 1 McDonald's 1

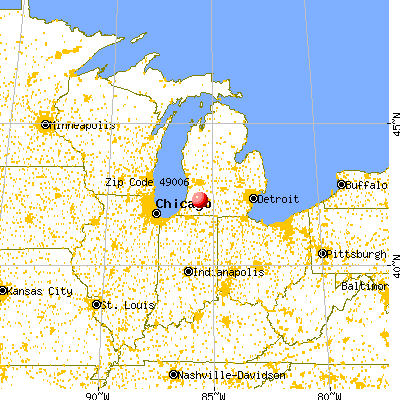


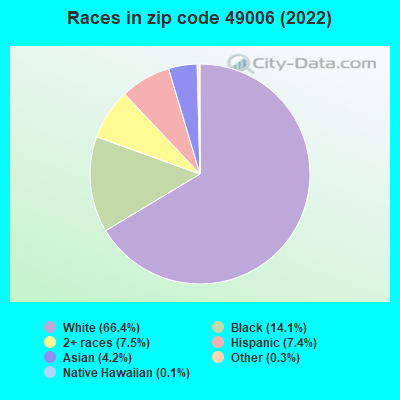


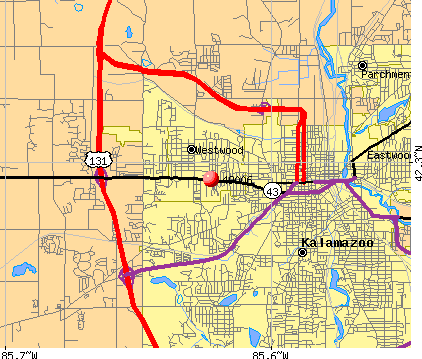 Nearest zip codes: 49008, 49007, 49009, 49001, 49024, 49004.
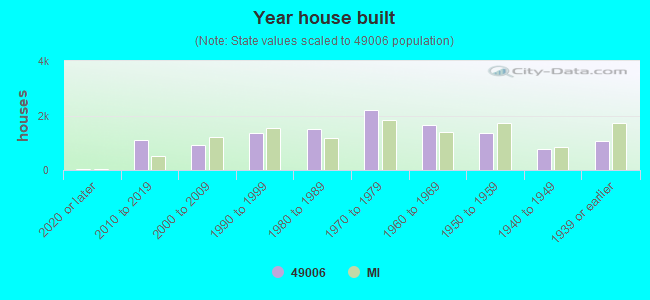

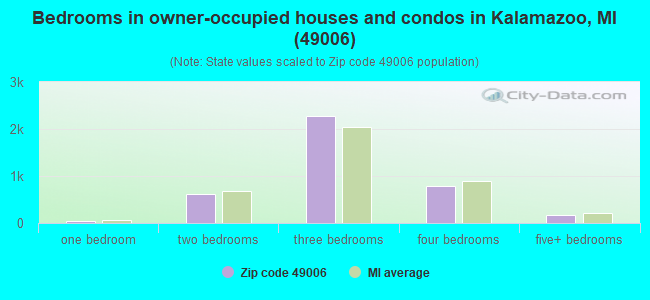
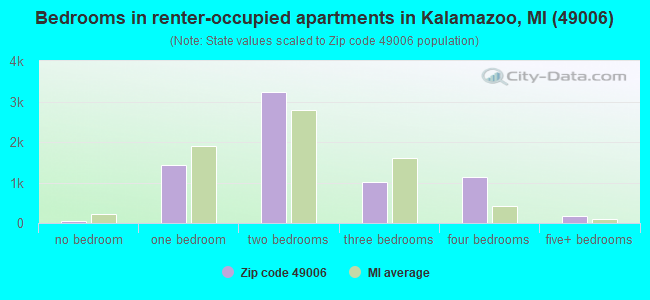
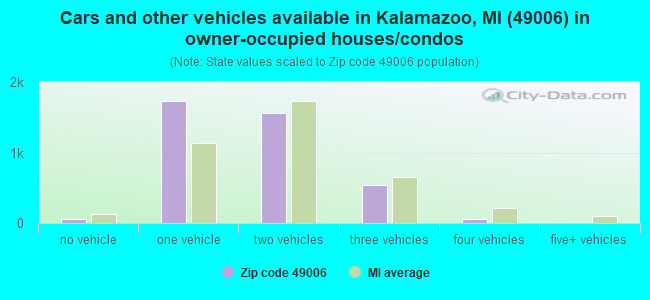
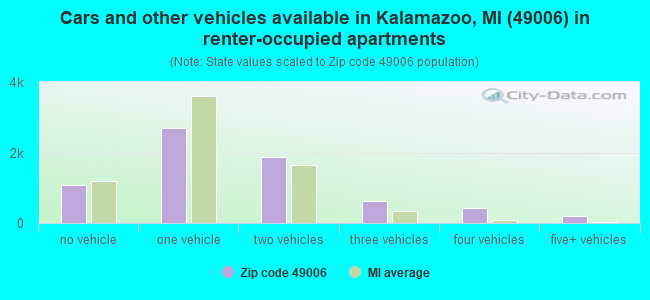


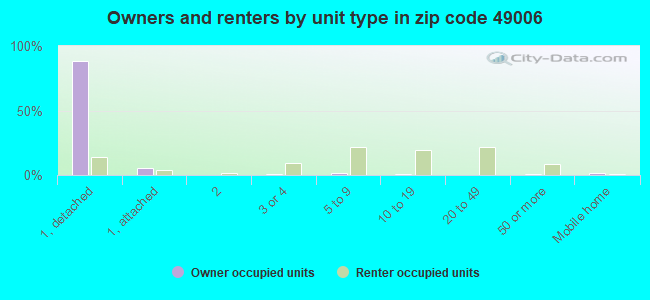
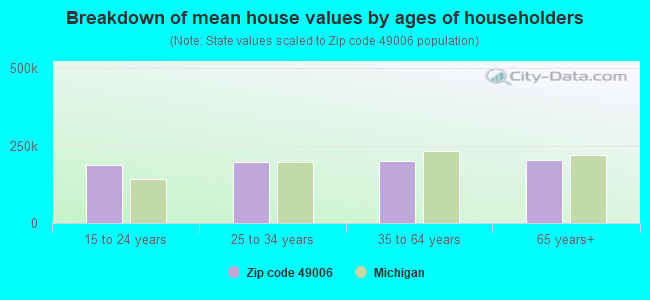


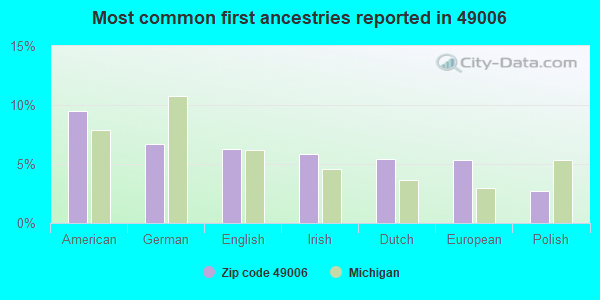
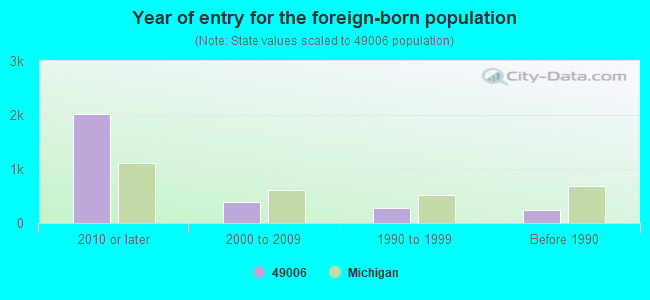


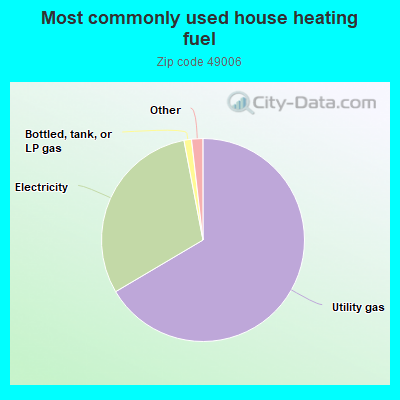
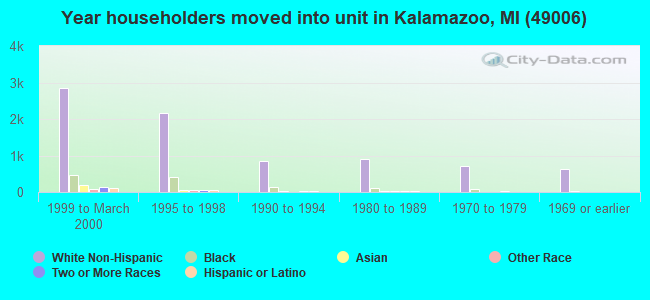
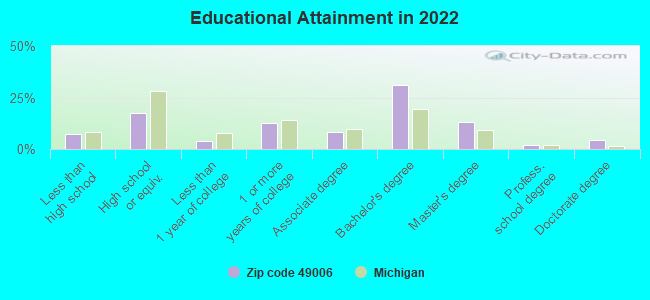
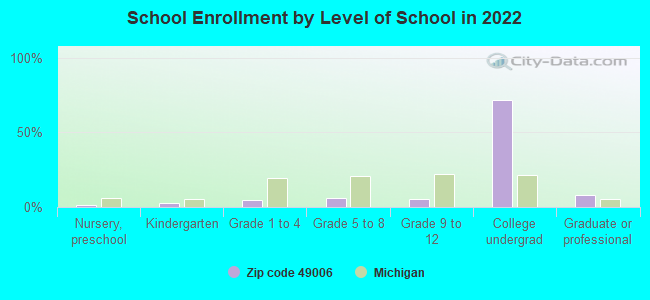
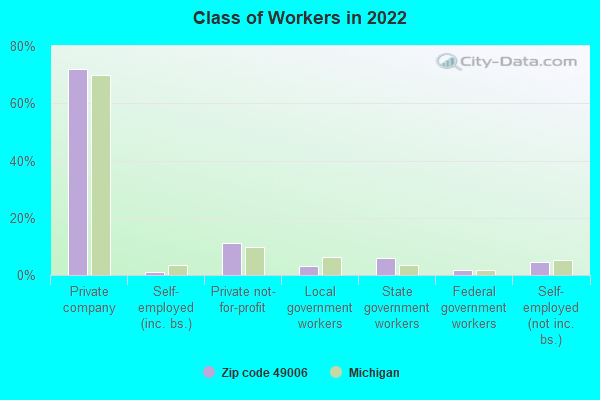
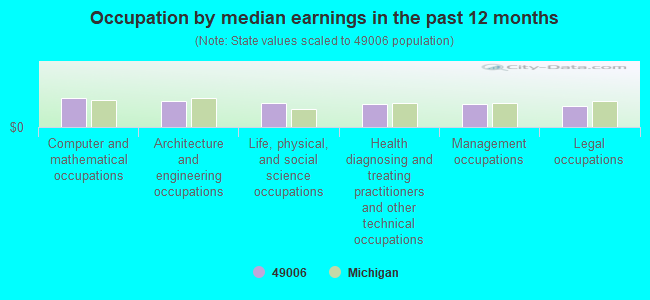
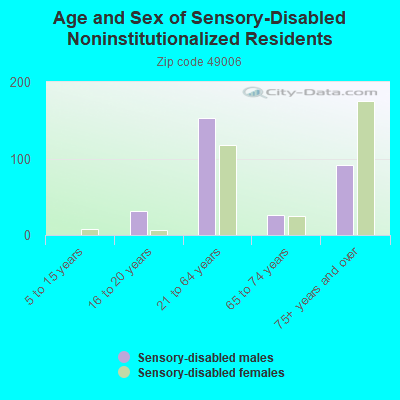
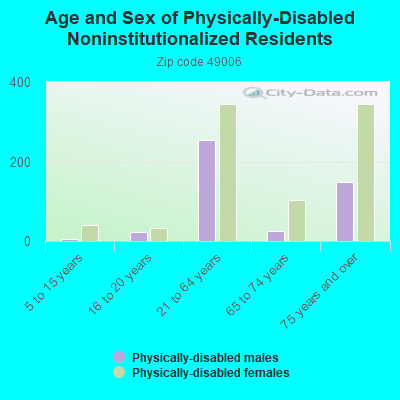
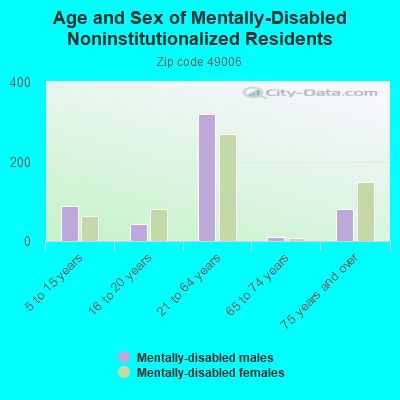
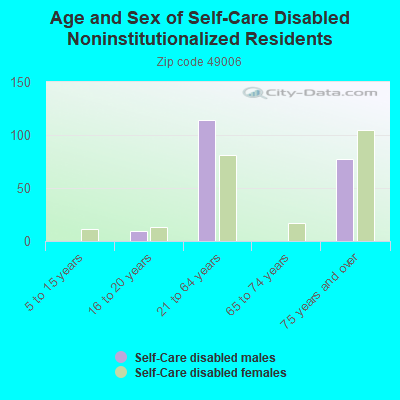
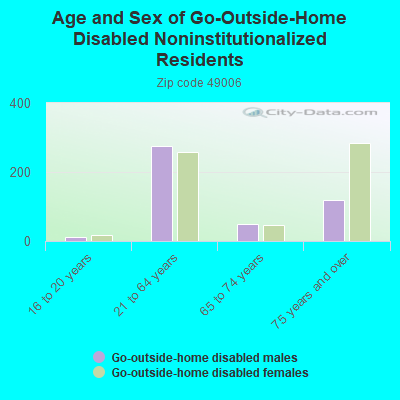
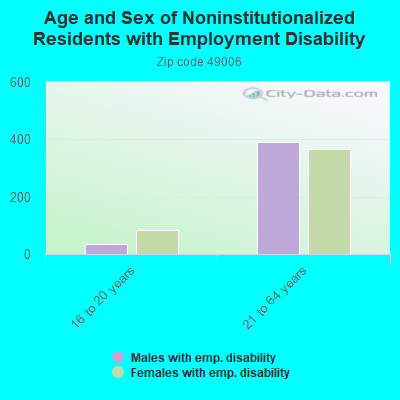
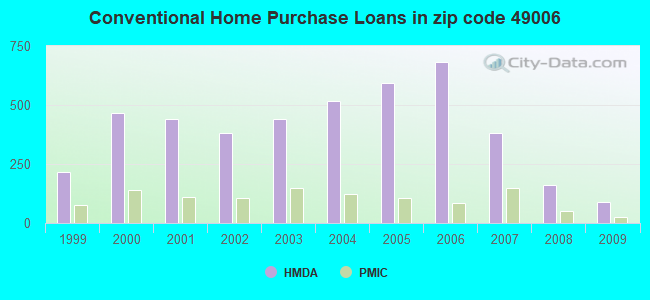
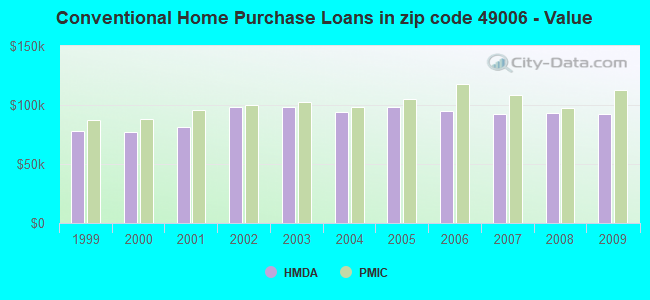
 Based on the data from the years 2002 - 2018 the average number of fire incidents per year is 55. The highest number of reported fires - 95 took place in 2015, and the least - 19 in 2004. The data has a rising trend.
 When looking into fire subcategories, the most incidents belonged to: Structure Fires (49.5%), and Outside Fires (34.9%).