Estimated zip code population in 2022: 24,441 Zip code population in 2010: 20,970 Zip code population in 2000: 18,802
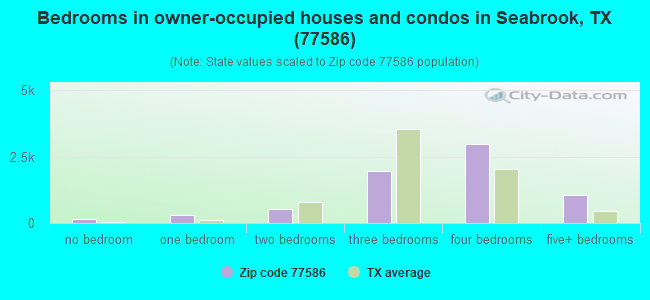
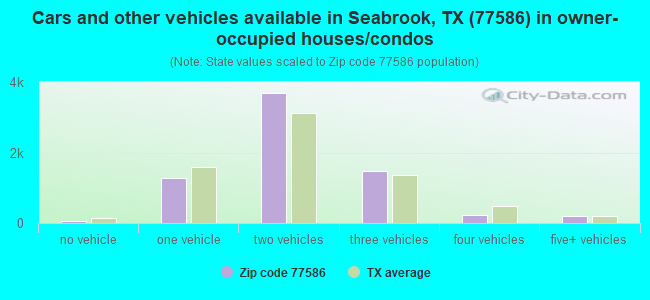
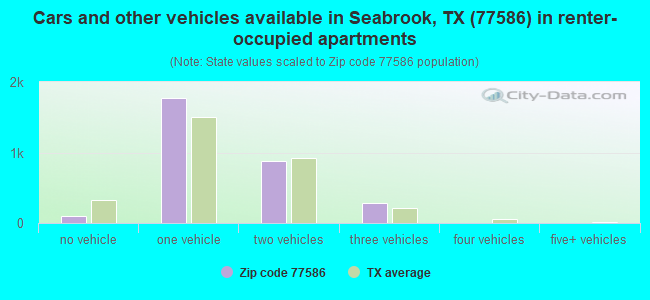
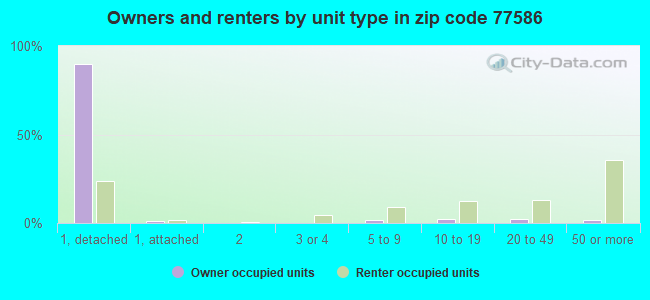
Houses and condos: 10,515 Renter-occupied apartments: 3,036
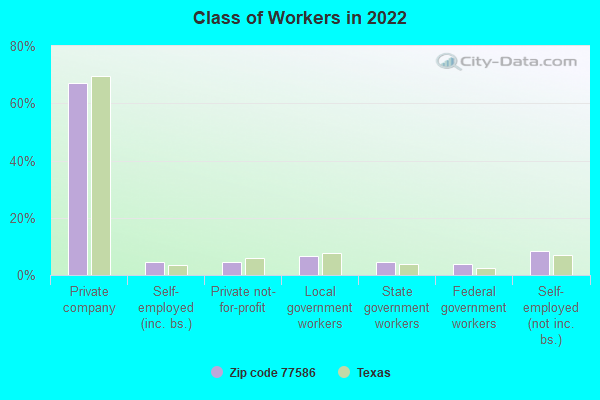
% of renters here:
31%
State:
38%
March 2022 cost of living index in zip code 77586: 96.6 (near average, U.S. average is 100)
Land area: 13.0 sq. mi. Water area: 2.4 sq. mi.
Population density: 1,882 people per square mile
(low).
OSM Map
General Map
Google Map
MSN Map
OSM Map
General Map
Google Map
MSN Map
OSM Map
General Map
Google Map
MSN Map
OSM Map
General Map
Google Map
MSN Map
Please wait while loading the map...
Real estate property taxes paid for housing units in 2022:
This zip code:
1.5% ($5,377)
Texas:
1.5% ($4,050)
Median real estate property taxes paid for housing units with mortgages in 2022: $6,056 (1.6%) Median real estate property taxes paid for housing units with no mortgage in 2022: $4,057 (1.3%)
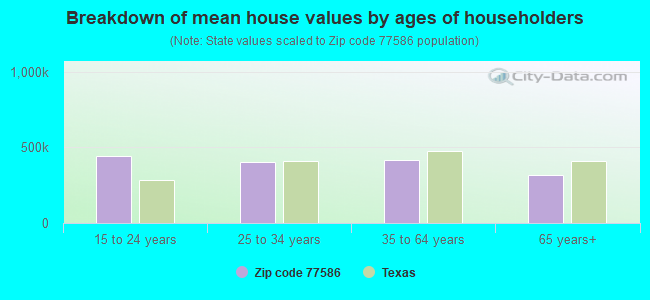
Estimated median house/condo value in 2022: $353,044
77586:
$353,044
Texas:
$275,400
According to our research of Texas and other state lists, there were 15 registered sex offenders living in 77586 zip code as of June 10, 2024. The ratio of all residents to sex offenders in zip code 77586 is 1,507 to 1. The ratio of registered sex offenders to all residents in this zip code is much lower than the state average.
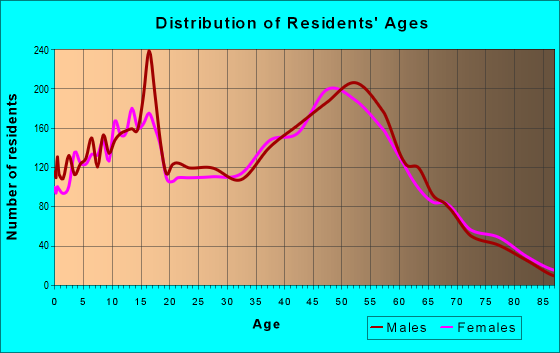
Median resident age:
This zip code:
42.3 years
Texas median age:
35.6 years
Average household size:
This zip code:
2.4 people
Texas:
2.6 people
Averages for the 2020 tax year for zip code 77586, filed in 2021:
Average Adjusted Gross Income (AGI) in 2020: $110,083 (Individual Income Tax Returns)
Here:
$110,083
State:
$77,054
Salary/wage: $85,860 (reported on 82.1% of returns)
Here:
$85,860
State:
$62,766
(% of AGI for various income ranges: 1149.4% for AGIs below $25k, 3597.7% for AGIs $25k-50k, 6435.8% for AGIs $50k-75k, 9299.1% for AGIs $75k-100k, 18173.5% for AGIs $100k-200k, 66859.5% for AGIs over 200k)
Taxable interest for individuals: $2,725 (reported on 33.9% of returns)
This zip code:
$2,725
Texas:
$2,665
(% of AGI for various income ranges: 15.6% for AGIs below $25k, 23.5% for AGIs $25k-50k, 34.1% for AGIs $50k-75k, 78.6% for AGIs $75k-100k, 98.2% for AGIs $100k-200k, 1674.0% for AGIs over 200k)
Ordinary dividends: $12,912 (reported on 25.1% of returns)
Here:
$12,912
State:
$10,044
(% of AGI for various income ranges: 29.7% for AGIs below $25k, 63.3% for AGIs $25k-50k, 112.2% for AGIs $50k-75k, 190.1% for AGIs $75k-100k, 374.7% for AGIs $100k-200k, 6136.5% for AGIs over 200k)
Net capital gain/loss in AGI: +$26,486 (reported on 23.2% of returns)
Here:
+$26,486
State:
+$39,590
(% of AGI for various income ranges: 17.2% for AGIs below $25k, 35.3% for AGIs $25k-50k, 86.5% for AGIs $50k-75k, 219.1% for AGIs $75k-100k, 471.8% for AGIs $100k-200k, 13539.8% for AGIs over 200k)
Profit/loss from business: +$12,673 (reported on 19.3% of returns)
Here:
+$12,673
State:
+$10,888
(% of AGI for various income ranges: 76.0% for AGIs below $25k, 53.6% for AGIs $25k-50k, 172.8% for AGIs $50k-75k, 131.0% for AGIs $75k-100k, 397.1% for AGIs $100k-200k, 3707.7% for AGIs over 200k)
Taxable individual retirement arrangement distribution: $34,002 (reported on 10.9% of returns)
77586:
$34,002
Texas:
$24,740
(% of AGI for various income ranges: 47.6% for AGIs below $25k, 149.1% for AGIs $25k-50k, 290.2% for AGIs $50k-75k, 642.1% for AGIs $75k-100k, 905.7% for AGIs $100k-200k, 3778.1% for AGIs over 200k)
Self-employed (Keogh) retirement plans: $27,157 (reported on 0.6% of returns)
77586:
$27,157
Texas:
$29,298
(% of AGI for various income ranges: 23.6% for AGIs $100k-200k, 356.5% for AGIs over 200k)
Total itemized deductions: $40,873 (reported on 10.9% of returns)
Here:
$40,873
State:
$40,428
(% of AGI for various income ranges: 48.9% for AGIs below $25k, 135.2% for AGIs $25k-50k, 343.4% for AGIs $50k-75k, 481.2% for AGIs $75k-100k, 914.9% for AGIs $100k-200k, 5907.4% for AGIs over 200k)
Charity contributions: $17,608 (reported on 9.0% of returns)
Here:
$17,608
State:
$18,201
(% of AGI for various income ranges: 4.9% for AGIs below $25k, 19.6% for AGIs $25k-50k, 61.3% for AGIs $50k-75k, 79.7% for AGIs $75k-100k, 245.5% for AGIs $100k-200k, 2851.9% for AGIs over 200k)
Taxes paid: $7,984 (reported on 10.6% of returns)
77586:
$7,984
State:
$7,821
(% of AGI for various income ranges: 9.0% for AGIs below $25k, 24.3% for AGIs $25k-50k, 69.3% for AGIs $50k-75k, 119.6% for AGIs $75k-100k, 221.7% for AGIs $100k-200k, 882.6% for AGIs over 200k)
Earned income credit: $2,032 (reported on 10.4% of returns)
Here:
$2,032
State:
$2,584
(% of AGI for various income ranges: 75.1% for AGIs below $25k, 48.8% for AGIs $25k-50k)
Percentage of individuals using paid preparers for their 2020 taxes: 90.8%
Here:
91%
State:
92%
(% for various income ranges: 90.9% for AGIs below $25k, 92.5% for AGIs $25k-50k, 91.8% for AGIs $50k-75k, 90.2% for AGIs $75k-100k, 89.6% for AGIs $100k-200k, 89.3% for AGIs over 200k)
Averages for the 2012 tax year for zip code 77586, filed in 2013:
Average Adjusted Gross Income (AGI) in 2012: $95,988 (Individual Income Tax Returns)
Here:
$95,988
State:
$65,384
Salary/wage: $78,169 (reported on 85.3% of returns)
Here:
$78,169
State:
$52,524
(% of AGI for various income ranges: 80.0% for AGIs below $25k, 80.3% for AGIs $25k-50k, 79.4% for AGIs $50k-75k, 78.3% for AGIs $75k-100k, 80.5% for AGIs $100k-200k, 54.6% for AGIs over 200k)
Taxable interest for individuals: $1,582 (reported on 39.5% of returns)
This zip code:
$1,582
Texas:
$2,372
(% of AGI for various income ranges: 1.0% for AGIs below $25k, 0.5% for AGIs $25k-50k, 0.7% for AGIs $50k-75k, 0.5% for AGIs $75k-100k, 0.4% for AGIs $100k-200k, 0.9% for AGIs over 200k)
Ordinary dividends: $10,055 (reported on 25.2% of returns)
Here:
$10,055
State:
$9,721
(% of AGI for various income ranges: 2.2% for AGIs below $25k, 1.3% for AGIs $25k-50k, 1.5% for AGIs $50k-75k, 1.4% for AGIs $75k-100k, 1.3% for AGIs $100k-200k, 4.5% for AGIs over 200k)
Net capital gain/loss in AGI: +$19,400 (reported on 21.2% of returns)
Here:
+$19,400
State:
+$35,319
(% of AGI for various income ranges: 0.5% for AGIs $50k-75k, 0.5% for AGIs $75k-100k, 1.0% for AGIs $100k-200k, 9.5% for AGIs over 200k)
Profit/loss from business: +$17,915 (reported on 17.7% of returns)
Here:
+$17,915
State:
+$13,732
(% of AGI for various income ranges: 8.5% for AGIs below $25k, 4.0% for AGIs $25k-50k, 3.4% for AGIs $50k-75k, 2.4% for AGIs $75k-100k, 2.7% for AGIs $100k-200k, 3.4% for AGIs over 200k)
Taxable individual retirement arrangement distribution: $25,502 (reported on 11.1% of returns)
77586:
$25,502
Texas:
$19,511
(% of AGI for various income ranges: 3.1% for AGIs below $25k, 3.0% for AGIs $25k-50k, 3.2% for AGIs $50k-75k, 3.7% for AGIs $75k-100k, 3.6% for AGIs $100k-200k, 2.2% for AGIs over 200k)
Self-employment retirement plans: $23,283 (reported on 1.1% of returns)
77586:
$23,283
Texas:
$23,938
Total itemized deductions: $23,331 (14% of AGI, reported on 38.4% of returns)
Here:
$23,331
State:
$24,724
Here:
13.5% of AGI
State:
15.9% of AGI
(% of AGI for various income ranges: 10.1% for AGIs below $25k, 10.4% for AGIs $25k-50k, 12.0% for AGIs $50k-75k, 11.3% for AGIs $75k-100k, 11.1% for AGIs $100k-200k, 6.8% for AGIs over 200k)
Charity contributions: $4,991 (reported on 31.0% of returns)
Here:
$4,991
State:
$6,808
(% of AGI for various income ranges: 0.7% for AGIs below $25k, 0.9% for AGIs $25k-50k, 1.4% for AGIs $50k-75k, 1.6% for AGIs $75k-100k, 1.8% for AGIs $100k-200k, 1.7% for AGIs over 200k)
Taxes paid: $7,446 (reported on 37.8% of returns)
77586:
$7,446
State:
$6,921
(% of AGI for various income ranges: 2.2% for AGIs below $25k, 2.3% for AGIs $25k-50k, 3.1% for AGIs $50k-75k, 3.1% for AGIs $75k-100k, 3.6% for AGIs $100k-200k, 2.5% for AGIs over 200k)
Earned income credit: $1,932 (reported on 10.5% of returns)
Here:
$1,932
State:
$2,570
(% of AGI for various income ranges: 4.7% for AGIs below $25k, 0.7% for AGIs $25k-50k)
Percentage of individuals using paid preparers for their 2012 taxes: 42.2%
Here:
42%
State:
51%
(% for various income ranges: 36.7% for AGIs below $25k, 37.3% for AGIs $25k-50k, 43.1% for AGIs $50k-75k, 44.4% for AGIs $75k-100k, 44.7% for AGIs $100k-200k, 60.9% for AGIs over 200k)
Averages for the 2004 tax year for zip code 77586, filed in 2005:
Average Adjusted Gross Income (AGI) in 2004: $75,360 (Individual Income Tax Returns)
Here:
$75,360
State:
$47,881
Salary/wage: $65,483 (reported on 85.9% of returns)
Here:
$65,483
State:
$41,947
(% of AGI for various income ranges: 176.2% for AGIs below $10k, 79.9% for AGIs $10k-25k, 83.1% for AGIs $25k-50k, 81.1% for AGIs $50k-75k, 83.9% for AGIs $75k-100k, 68.7% for AGIs over 100k)
Taxable interest for individuals: $1,690 (reported on 51.7% of returns)
This zip code:
$1,690
Texas:
$2,255
(% of AGI for various income ranges: 10.5% for AGIs below $10k, 2.0% for AGIs $10k-25k, 1.3% for AGIs $25k-50k, 1.4% for AGIs $50k-75k, 1.0% for AGIs $75k-100k, 1.0% for AGIs over 100k)
Taxable dividends: $3,012 (reported on 31.3% of returns)
Here:
$3,012
State:
$4,261
(% of AGI for various income ranges: 6.7% for AGIs below $10k, 2.6% for AGIs $10k-25k, 1.0% for AGIs $25k-50k, 1.1% for AGIs $50k-75k, 0.9% for AGIs $75k-100k, 1.3% for AGIs over 100k)
Net capital gain/loss: +$9,248 (reported on 27.4% of returns)
Here:
+$9,248
State:
+$16,110
(% of AGI for various income ranges: -2.7% for AGIs below $10k, -0.1% for AGIs $10k-25k, 0.2% for AGIs $25k-50k, 0.6% for AGIs $50k-75k, 0.7% for AGIs $75k-100k, 5.3% for AGIs over 100k)
Profit/loss from business: +$12,080 (reported on 17.1% of returns)
Here:
+$12,080
State:
+$11,013
(% of AGI for various income ranges: -16.4% for AGIs below $10k, 5.4% for AGIs $10k-25k, 3.6% for AGIs $25k-50k, 2.3% for AGIs $50k-75k, 2.5% for AGIs $75k-100k, 2.8% for AGIs over 100k)
IRA payment deduction: $3,354 (reported on 3.0% of returns)
77586:
$3,354
Texas:
$3,120
(% of AGI for various income ranges: 0.3% for AGIs $10k-25k, 0.2% for AGIs $25k-50k, 0.2% for AGIs $50k-75k, 0.2% for AGIs $75k-100k, 0.1% for AGIs over 100k)
Self-employed pension: $13,959 (reported on 1.5% of returns)
Here:
$13,959
Texas:
$16,401
(% of AGI for various income ranges: 0.1% for AGIs $25k-50k, 0.1% for AGIs $50k-75k, 0.2% for AGIs $75k-100k, 0.4% for AGIs over 100k)
Total itemized deductions: $19,734 (16% of AGI, reported on 42.8% of returns)
Here:
$19,734
State:
$19,631
Here:
16.3% of AGI
State:
18.9% of AGI
(% of AGI for various income ranges: 24.2% for AGIs below $10k, 10.6% for AGIs $10k-25k, 11.1% for AGIs $25k-50k, 13.2% for AGIs $50k-75k, 15.3% for AGIs $75k-100k, 9.8% for AGIs over 100k)
Charity contributions deductions: $3,856 (3% of AGI, reported on 36.3% of returns)
Here:
$3,856
State:
$4,753
Here:
3.2% of AGI
State:
4.2% of AGI
(% of AGI for various income ranges: 0.9% for AGIs below $10k, 0.8% for AGIs $10k-25k, 1.2% for AGIs $25k-50k, 1.7% for AGIs $50k-75k, 2.1% for AGIs $75k-100k, 2.0% for AGIs over 100k)
Total tax: $13,857 (reported on 82.3% of returns)
77586:
$13,857
State:
$9,058
(% of AGI for various income ranges: 4.7% for AGIs below $10k, 4.7% for AGIs $10k-25k, 8.2% for AGIs $25k-50k, 10.2% for AGIs $50k-75k, 11.0% for AGIs $75k-100k, 18.9% for AGIs over 100k)
Earned income credit: $1,542 (reported on 8.1% of returns)
Here:
$1,542
State:
$2,024
Percentage of individuals using paid preparers for their 2004 taxes: 43.5%
Here:
44%
State:
57%
(% for various income ranges: 37.9% for AGIs below $10k, 48.1% for AGIs $10k-25k, 42.0% for AGIs $25k-50k, 45.3% for AGIs $50k-75k, 41.4% for AGIs $75k-100k, 45.8% for AGIs over 100k)
Likely homosexual households (counted as self-reported same-sex unmarried-partner households)
Lesbian couples: 0.7% of all households
Gay men: 0.0% of all households
Household received Food Stamps/SNAP in the past 12 months: 402 Household did not receive Food Stamps/SNAP in the past 12 months: 9,511
Women who had a birth in the past 12 months: 419 (159 now married, 253 unmarried) Women who did not have a birth in the past 12 months: 5,003 (2,142 now married, 2,862 unmarried)
Housing units in zip code 77586 with a mortgage: 3,963 (285 second mortgage, 10 home equity loan, 275 both second mortgage and home equity loan) Houses without a mortgage: 111
Median monthly owner costs for units with a mortgage: $2,396 Median monthly owner costs for units without a mortgage: $884
Residents with income below the poverty level in 2022:
This zip code:
5.9%
Whole state:
14.0%
Residents with income below 50% of the poverty level in 2022:
This zip code:
2.3%
Whole state:
7.4%
Median number of rooms in houses and condos:
Here:
7.5
State:
6.3
Median number of rooms in apartments:
Here:
3.7
State:
4.0
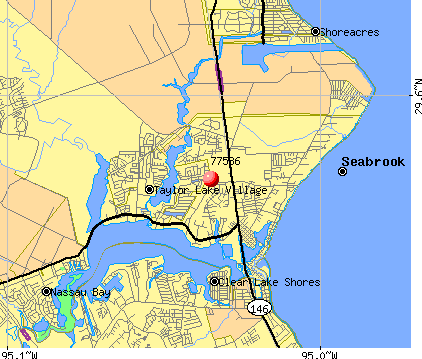
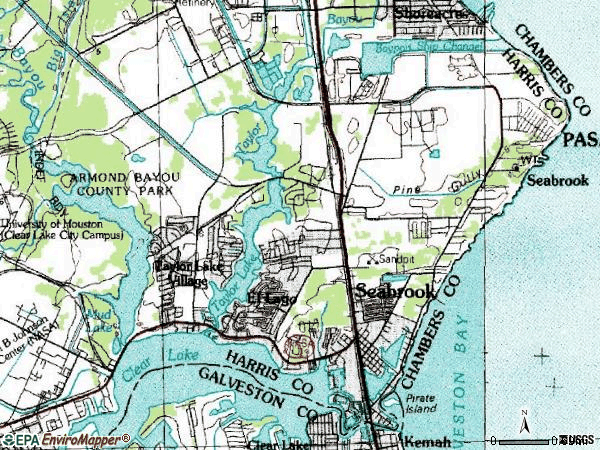
Notable locations in this zip code not listed on our city pages
Notable locations in zip code 77586: Seabrook Shipyard Marina (A), The Landing Marina (B), Lakeside Yachting Center Marina (C), Lakewood Yacht Club Marina (D), Marina Bay (E), Parkside Marina (F), Blue Dolphin Yachting Center Marina (G), El Lago Marina (H), Seabrook Volunteer Fire Department Station 1 (I), Seabrook Volunteer Fire Department Station 2 (J), Pasadena Volunteer Fire Department Station 6 (K), Pasadena Volunteer Fire Department Station 9 (L), Taylor Lake Village City Hall (M), El Lago Police Department (N), Seabrook Police Department - Administration (O), Seabrook Police Department (P), Bay Area Museum (Q), City of Seabrook Fire Department (R), Port of Houston Authority Fire Department Station 4 (S). Display/hide their locations on the map
Parks in zip code 77586 include: Rex L Meador Park (1), Miramar Park (2), Friendship Park (3), Community Park (4), Clear Lake Park (5), Bay Area Park (6). Display/hide their locations on the map
3,600 married couples with children.
1,189 single-parent households (297 men, 892 women).
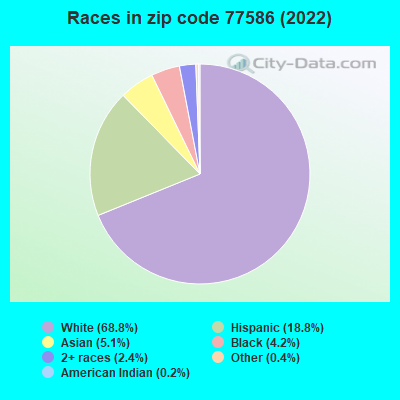
83.0% of residents of 77586 zip code speak English at home.
11.3% of residents speak Spanish at home (86% very well, 11% well, 3% not well, 1% not at all).
1.8% of residents speak other Indo-European language at home (80% very well, 16% well, 4% not well).
2.8% of residents speak Asian or Pacific Island language at home (54% very well, 42% well, 4% not well).
1.3% of residents speak other language at home (82% very well, 14% well, 3% not well).
Foreign born population: 2,626 (10.7%) (58.0% of them are naturalized citizens)
This zip code:
10.7%
Whole state:
17.2%
18%Honduras
11%Malaysia
10%Costa Rica
4%France
4%Thailand
4%Indonesia
3%Bhutan
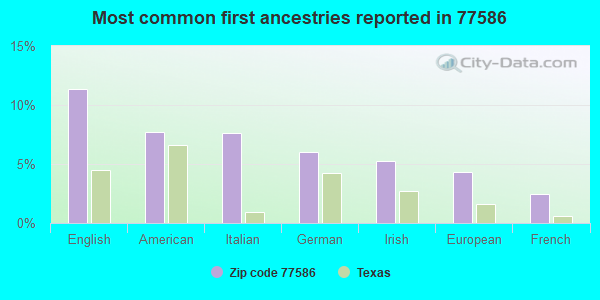
11%English
8%American
8%Italian
6%German
5%Irish
4%European
2%French
Year of entry for the foreign-born population
6642010 or later
6982000 to 2009
6701990 to 1999
971Before 1990
Housing units lacking complete plumbing facilities: 0.6% Housing units lacking complete kitchen facilities: 0.8%
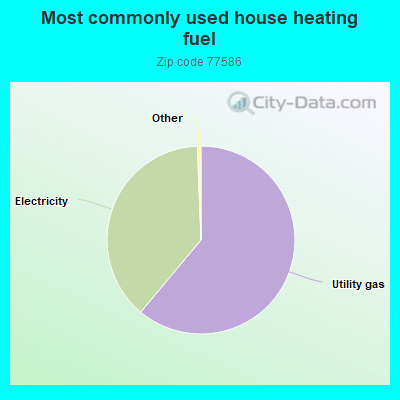
61.1%Utility gas
38.3%Electricity
Population in 1990: 9,490. Population change in the 1990s: +9,312 (+98.1%).
Place of birth for U.S.-born residents:
This state: 12,217
Northeast: 1,748
Midwest: 2,587
South: 2,838
West: 2,033
49% of the 77586 zip code residents lived in the same house 5 years ago. Out of people who lived in different houses, 52% lived in this county. Out of people who lived in different counties, 50% lived in Texas.
86% of the 77586 zip code residents lived in the same house 1 year ago. Out of people who lived in different houses, 49% moved from this county. Out of people who lived in different houses, 37% moved from different county within same state. Out of people who lived in different houses, 8% moved from different state. Out of people who lived in different houses, 4% moved from abroad.
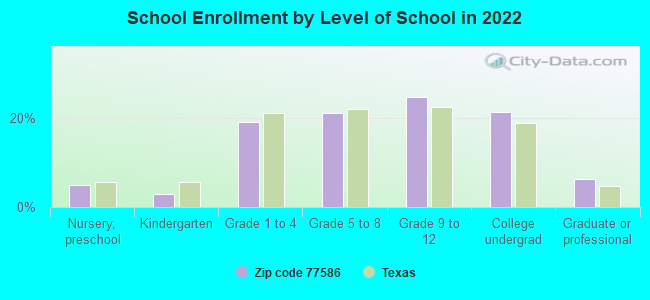
Private vs. public school enrollment:
Students in private schools in grades 1 to 8 (elementary and middle school): 119
Here:
5.0%
Texas:
8.8%
Students in private schools in grades 9 to 12 (high school): 85
Here:
5.7%
Texas:
8.0%
Students in private undergraduate colleges: 100
Here:
7.8%
Texas:
16.2%
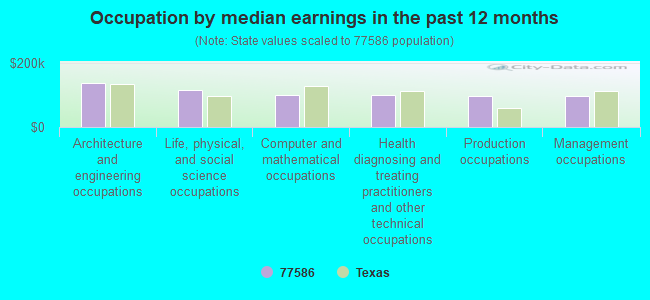
Occupation by median earnings in the past 12 months ($)
137,160Architecture and engineering occupations
115,826Life, physical, and social science occupations
99,980Computer and mathematical occupations
98,504Health diagnosing and treating practitioners and other technical occupations
96,860Production occupations
95,401Management occupations
Companies with federal contracts located in this zip code:
MARITIME BERTHING INC (1219 WOODLAND DR in SEABROOK, TX; small business) : $6,656,891 in 8 contractsfrom 2003 to 2006
Contracts for Lease or Rental of Facilities -- Ship Construction and Repair Facilities by Navy Signed by year:2000: $0; 2001: $0; 2002: $0; 2003: $3,108,734; 2004: $335,965; 2005: $941,380; 2006: $2,270,812.
Biggest contracts:
$2,260,040 with Navy for Lease or Rental of Facilities -- Ship Construction and Repair Facilities. Signed on 2006-04-12. Completion date: 2006-04-30.
$1,852,805, same as above.Signed on 2003-03-05. Completion date: 2003-02-11.
$1,255,929, same as above.Signed on 2003-10-27. Completion date: 2003-02-11.
$931,380, same as above.Signed on 2005-11-29. Completion date: 2003-02-11.
LBC HOUSTON, L P (11666 PORT ROAD in SEABROOK, TX) : $1,581,797 in 14 contractsfrom 2003 to 2006
Contracts for Lease or Rental of Facilities -- Fuel Storage Buildings by Defense Logistics Agency Signed by year:2000: $0; 2001: $0; 2002: $0; 2003: $37,188; 2004: $898,956; 2005: $642,153; 2006: $3,500.
Biggest contracts:
$675,828 with Defense Logistics Agency for Lease or Rental of Facilities -- Fuel Storage Buildings. Signed on 2004-04-15. Completion date: 2009-06-30.
$628,228, same as above.Signed on 2005-06-08. Completion date: 2006-06-30.
$37,188, same as above.Signed on 2004-06-25. Completion date: 2004-07-31.
$37,188, same as above.Signed on 2004-04-19. Completion date: 2004-05-31.
HOUSTON LBC L P (11666 PORT RD in SEABROOK, TX) : $851,651 in 6 contractsfrom 2000 to 2002
Contracts for Liquid Propellants and Fuels, Petroleum Base by Air Force, Defense Logistics Agency Signed by year:2000: $624,871; 2001: $0; 2002: $226,780; 2003: $0; 2004: $0; 2005: $0; 2006: $0.
Biggest contracts:
$272,256 with Air Force for Liquid Propellants and Fuels, Petroleum Base. Signed on 2000-12-20. Completion date: 2001-03-30.
$226,780 with Defense Logistics Agency for Liquid Propellants and Fuels, Petroleum Base. Signed on 2002-06-21. Completion date: 2003-02-01.
$208,432 with Air Force for Liquid Propellants and Fuels, Petroleum Base. Signed on 2000-01-31. Completion date: 2001-01-31.
$170,160, same as above.Signed on 2000-08-28. Completion date: 2001-01-31.
Top industries in this zip code by the number of employees in 2005:
2002 - 2018 National Fire Incident Reporting System (NFIRS) incidents
Based on the data from the years 2002 - 2018 the average number of fires per year is 42. The highest number of fire incidents - 83 took place in 2011, and the least - 16 in 2007. The data has a rising trend.
When looking into fire subcategories, the most incidents belonged to: Structure Fires (50.9%), and Outside Fires (23.8%).
Fire incident types reported to NFIRS in Zip Code 77586
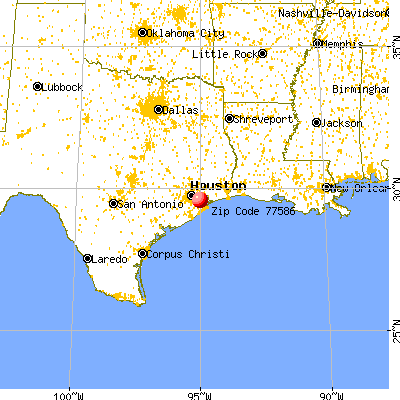


 Nearest zip codes: 77565, 77507, 77058, 77059, 77518, 77573.


 : $6,656,891 in 8 contracts from 2003 to 2006

 Based on the data from the years 2002 - 2018 the average number of fires per year is 42. The highest number of fire incidents - 83 took place in 2011, and the least - 16 in 2007. The data has a rising trend.
 When looking into fire subcategories, the most incidents belonged to: Structure Fires (50.9%), and Outside Fires (23.8%).