Estimated zip code population in 2022: 34,998 Zip code population in 2010: 28,804 Zip code population in 2000: 27,585
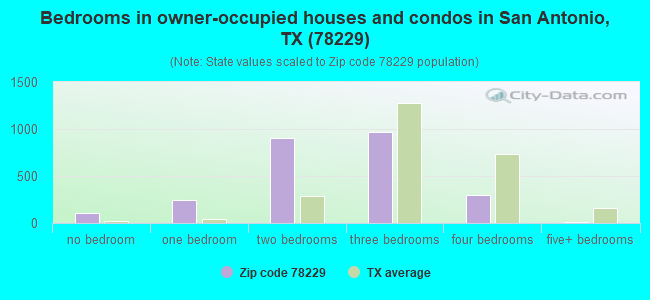
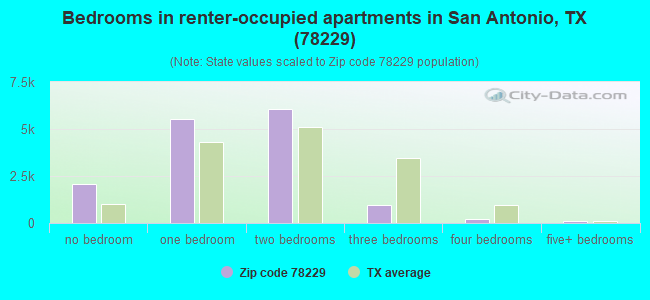
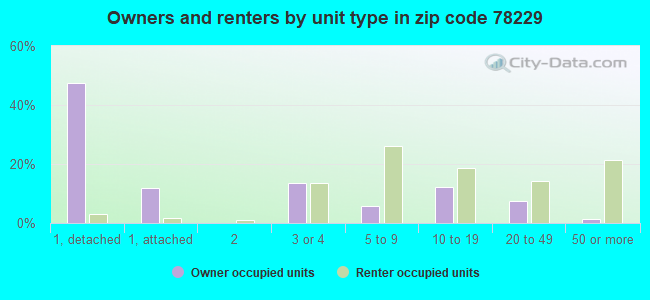
Houses and condos: 19,755 Renter-occupied apartments: 14,688
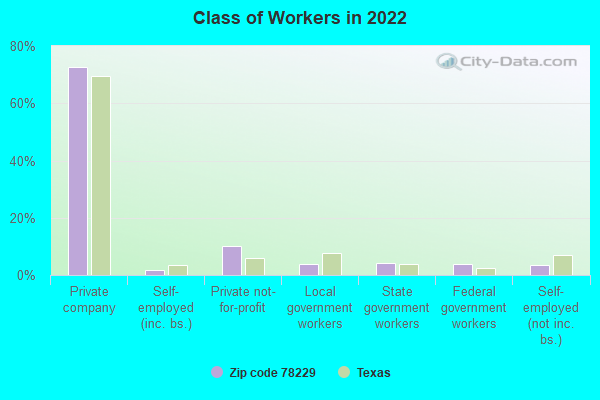
% of renters here:
85%
State:
38%
March 2022 cost of living index in zip code 78229: 88.7 (less than average, U.S. average is 100)
Land area: 5.7 sq. mi. Water area: 0.0 sq. mi.
Population density: 6,089 people per square mile
(high).
OSM Map
General Map
Google Map
MSN Map
OSM Map
General Map
Google Map
MSN Map
OSM Map
General Map
Google Map
MSN Map
OSM Map
General Map
Google Map
MSN Map
Please wait while loading the map...
Real estate property taxes paid for housing units in 2022:
This zip code:
1.8% ($3,625)
Texas:
1.5% ($4,050)
Median real estate property taxes paid for housing units with mortgages in 2022: $4,621 (2.0%) Median real estate property taxes paid for housing units with no mortgage in 2022: $3,217 (1.6%)
Estimated median house/condo value in 2022: $206,550
78229:
$206,550
Texas:
$275,400
According to our research of Texas and other state lists, there were 40 registered sex offenders living in 78229 zip code as of June 02, 2024. The ratio of all residents to sex offenders in zip code 78229 is 782 to 1. The ratio of registered sex offenders to all residents in this zip code is lower than the state average.
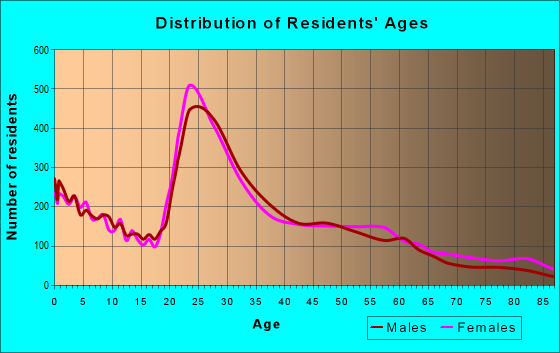
Median resident age:
This zip code:
30.1 years
Texas median age:
35.6 years
Average household size:
This zip code:
2.0 people
Texas:
2.6 people
Averages for the 2020 tax year for zip code 78229, filed in 2021:
Average Adjusted Gross Income (AGI) in 2020: $46,327 (Individual Income Tax Returns)
Here:
$46,327
State:
$77,054
Salary/wage: $39,680 (reported on 86.7% of returns)
Here:
$39,680
State:
$62,766
(% of AGI for various income ranges: 1185.6% for AGIs below $25k, 3548.0% for AGIs $25k-50k, 6635.8% for AGIs $50k-75k, 9957.6% for AGIs $75k-100k, 17349.1% for AGIs $100k-200k, 67196.7% for AGIs over 200k)
Taxable interest for individuals: $2,035 (reported on 13.9% of returns)
This zip code:
$2,035
Texas:
$2,665
(% of AGI for various income ranges: 5.3% for AGIs below $25k, 5.8% for AGIs $25k-50k, 15.2% for AGIs $50k-75k, 50.3% for AGIs $75k-100k, 231.1% for AGIs $100k-200k, 2367.8% for AGIs over 200k)
Ordinary dividends: $9,379 (reported on 8.7% of returns)
Here:
$9,379
State:
$10,044
(% of AGI for various income ranges: 6.8% for AGIs below $25k, 9.0% for AGIs $25k-50k, 38.6% for AGIs $50k-75k, 104.9% for AGIs $75k-100k, 248.9% for AGIs $100k-200k, 10075.6% for AGIs over 200k)
Net capital gain/loss in AGI: +$20,969 (reported on 9.2% of returns)
Here:
+$20,969
State:
+$39,590
(% of AGI for various income ranges: 4.5% for AGIs below $25k, 12.0% for AGIs $25k-50k, 37.0% for AGIs $50k-75k, 133.9% for AGIs $75k-100k, 775.7% for AGIs $100k-200k, 25561.1% for AGIs over 200k)
Profit/loss from business: +$9,730 (reported on 16.2% of returns)
Here:
+$9,730
State:
+$10,888
(% of AGI for various income ranges: 89.7% for AGIs below $25k, 83.7% for AGIs $25k-50k, 85.2% for AGIs $50k-75k, 164.1% for AGIs $75k-100k, 715.5% for AGIs $100k-200k, 10865.6% for AGIs over 200k)
Taxable individual retirement arrangement distribution: $19,091 (reported on 3.6% of returns)
78229:
$19,091
Texas:
$24,740
(% of AGI for various income ranges: 14.0% for AGIs below $25k, 25.9% for AGIs $25k-50k, 78.0% for AGIs $50k-75k, 206.4% for AGIs $75k-100k, 679.8% for AGIs $100k-200k, 3215.6% for AGIs over 200k)
Self-employed (Keogh) retirement plans: $30,667 (reported on 0.2% of returns)
78229:
$30,667
Texas:
$29,298
(% of AGI for various income ranges: 1022.2% for AGIs over 200k)
Total itemized deductions: $29,565 (reported on 2.9% of returns)
Here:
$29,565
State:
$40,428
(% of AGI for various income ranges: 12.7% for AGIs below $25k, 52.0% for AGIs $25k-50k, 117.0% for AGIs $50k-75k, 235.8% for AGIs $75k-100k, 641.4% for AGIs $100k-200k, 4245.6% for AGIs over 200k)
Charity contributions: $10,819 (reported on 2.2% of returns)
Here:
$10,819
State:
$18,201
(% of AGI for various income ranges: 9.0% for AGIs $25k-50k, 31.3% for AGIs $50k-75k, 54.6% for AGIs $75k-100k, 195.2% for AGIs $100k-200k, 1570.0% for AGIs over 200k)
Taxes paid: $6,719 (reported on 2.8% of returns)
78229:
$6,719
State:
$7,821
(% of AGI for various income ranges: 2.8% for AGIs below $25k, 8.7% for AGIs $25k-50k, 25.6% for AGIs $50k-75k, 70.5% for AGIs $75k-100k, 160.0% for AGIs $100k-200k, 885.6% for AGIs over 200k)
Earned income credit: $2,365 (reported on 24.5% of returns)
Here:
$2,365
State:
$2,584
(% of AGI for various income ranges: 116.6% for AGIs below $25k, 62.1% for AGIs $25k-50k, 0.9% for AGIs $50k-75k)
Percentage of individuals using paid preparers for their 2020 taxes: 93.7%
Here:
94%
State:
92%
(% for various income ranges: 93.4% for AGIs below $25k, 95.3% for AGIs $25k-50k, 93.3% for AGIs $50k-75k, 91.6% for AGIs $75k-100k, 91.0% for AGIs $100k-200k, 90.0% for AGIs over 200k)
Averages for the 2012 tax year for zip code 78229, filed in 2013:
Average Adjusted Gross Income (AGI) in 2012: $39,592 (Individual Income Tax Returns)
Here:
$39,592
State:
$65,384
Salary/wage: $33,554 (reported on 87.8% of returns)
Here:
$33,554
State:
$52,524
(% of AGI for various income ranges: 86.0% for AGIs below $25k, 89.1% for AGIs $25k-50k, 80.6% for AGIs $50k-75k, 75.0% for AGIs $75k-100k, 64.8% for AGIs $100k-200k, 42.0% for AGIs over 200k)
Taxable interest for individuals: $1,697 (reported on 17.2% of returns)
This zip code:
$1,697
Texas:
$2,372
(% of AGI for various income ranges: 0.5% for AGIs below $25k, 0.4% for AGIs $25k-50k, 0.7% for AGIs $50k-75k, 0.8% for AGIs $75k-100k, 1.5% for AGIs $100k-200k, 1.0% for AGIs over 200k)
Ordinary dividends: $6,110 (reported on 9.2% of returns)
Here:
$6,110
State:
$9,721
(% of AGI for various income ranges: 0.8% for AGIs below $25k, 0.5% for AGIs $25k-50k, 0.9% for AGIs $50k-75k, 1.5% for AGIs $75k-100k, 1.8% for AGIs $100k-200k, 3.7% for AGIs over 200k)
Net capital gain/loss in AGI: +$14,903 (reported on 7.8% of returns)
Here:
+$14,903
State:
+$35,319
(% of AGI for various income ranges: 0.1% for AGIs $25k-50k, 0.7% for AGIs $75k-100k, 3.0% for AGIs $100k-200k, 14.1% for AGIs over 200k)
Profit/loss from business: +$15,861 (reported on 11.8% of returns)
Here:
+$15,861
State:
+$13,732
(% of AGI for various income ranges: 6.0% for AGIs below $25k, 1.5% for AGIs $25k-50k, 2.5% for AGIs $50k-75k, 3.2% for AGIs $75k-100k, 6.2% for AGIs $100k-200k, 10.2% for AGIs over 200k)
Taxable individual retirement arrangement distribution: $15,412 (reported on 5.1% of returns)
78229:
$15,412
Texas:
$19,511
(% of AGI for various income ranges: 0.8% for AGIs below $25k, 0.9% for AGIs $25k-50k, 2.0% for AGIs $50k-75k, 2.1% for AGIs $75k-100k, 4.2% for AGIs $100k-200k, 2.9% for AGIs over 200k)
Self-employment retirement plans: $21,200 (reported on 0.4% of returns)
78229:
$21,200
Texas:
$23,938
Total itemized deductions: $20,532 (19% of AGI, reported on 11.4% of returns)
Here:
$20,532
State:
$24,724
Here:
18.7% of AGI
State:
15.9% of AGI
(% of AGI for various income ranges: 3.2% for AGIs below $25k, 4.1% for AGIs $25k-50k, 6.6% for AGIs $50k-75k, 7.5% for AGIs $75k-100k, 9.1% for AGIs $100k-200k, 7.6% for AGIs over 200k)
Charity contributions: $5,197 (reported on 8.6% of returns)
Here:
$5,197
State:
$6,808
(% of AGI for various income ranges: 0.3% for AGIs below $25k, 0.8% for AGIs $25k-50k, 0.9% for AGIs $50k-75k, 1.3% for AGIs $75k-100k, 1.7% for AGIs $100k-200k, 2.1% for AGIs over 200k)
Taxes paid: $5,853 (reported on 10.6% of returns)
78229:
$5,853
State:
$6,921
(% of AGI for various income ranges: 0.5% for AGIs below $25k, 0.7% for AGIs $25k-50k, 1.6% for AGIs $50k-75k, 1.9% for AGIs $75k-100k, 3.0% for AGIs $100k-200k, 2.6% for AGIs over 200k)
Earned income credit: $2,316 (reported on 27.5% of returns)
Here:
$2,316
State:
$2,570
(% of AGI for various income ranges: 7.8% for AGIs below $25k, 1.1% for AGIs $25k-50k)
Percentage of individuals using paid preparers for their 2012 taxes: 41.3%
Here:
41%
State:
51%
(% for various income ranges: 41.2% for AGIs below $25k, 35.9% for AGIs $25k-50k, 43.8% for AGIs $50k-75k, 47.4% for AGIs $75k-100k, 58.6% for AGIs $100k-200k, 75.0% for AGIs over 200k)
Averages for the 2004 tax year for zip code 78229, filed in 2005:
Average Adjusted Gross Income (AGI) in 2004: $35,777 (Individual Income Tax Returns)
Here:
$35,777
State:
$47,881
Salary/wage: $29,984 (reported on 87.2% of returns)
Here:
$29,984
State:
$41,947
(% of AGI for various income ranges: 117.7% for AGIs below $10k, 88.4% for AGIs $10k-25k, 87.0% for AGIs $25k-50k, 79.4% for AGIs $50k-75k, 69.8% for AGIs $75k-100k, 47.1% for AGIs over 100k)
Taxable interest for individuals: $2,585 (reported on 24.7% of returns)
This zip code:
$2,585
Texas:
$2,255
(% of AGI for various income ranges: 3.6% for AGIs below $10k, 1.1% for AGIs $10k-25k, 1.1% for AGIs $25k-50k, 2.4% for AGIs $50k-75k, 2.3% for AGIs $75k-100k, 2.2% for AGIs over 100k)
Taxable dividends: $4,393 (reported on 12.2% of returns)
Here:
$4,393
State:
$4,261
(% of AGI for various income ranges: 1.6% for AGIs below $10k, 0.6% for AGIs $10k-25k, 0.6% for AGIs $25k-50k, 1.0% for AGIs $50k-75k, 1.9% for AGIs $75k-100k, 2.9% for AGIs over 100k)
Net capital gain/loss: +$18,821 (reported on 10.8% of returns)
Here:
+$18,821
State:
+$16,110
(% of AGI for various income ranges: -1.1% for AGIs below $10k, -0.2% for AGIs $10k-25k, 0.3% for AGIs $25k-50k, 0.6% for AGIs $50k-75k, 1.5% for AGIs $75k-100k, 17.5% for AGIs over 100k)
Profit/loss from business: +$15,357 (reported on 11.3% of returns)
Here:
+$15,357
State:
+$11,013
(% of AGI for various income ranges: 7.2% for AGIs below $10k, 3.2% for AGIs $10k-25k, 1.6% for AGIs $25k-50k, 3.4% for AGIs $50k-75k, 3.4% for AGIs $75k-100k, 9.5% for AGIs over 100k)
IRA payment deduction: $2,706 (reported on 1.4% of returns)
78229:
$2,706
Texas:
$3,120
(% of AGI for various income ranges: 0.1% for AGIs $10k-25k, 0.1% for AGIs $25k-50k, 0.1% for AGIs $50k-75k, 0.1% for AGIs $75k-100k, 0.1% for AGIs over 100k)
Self-employed pension: $19,043 (reported on 0.6% of returns)
Here:
$19,043
Texas:
$16,401
Total itemized deductions: $17,112 (20% of AGI, reported on 12.4% of returns)
Here:
$17,112
State:
$19,631
Here:
19.8% of AGI
State:
18.9% of AGI
(% of AGI for various income ranges: 4.5% for AGIs below $10k, 2.9% for AGIs $10k-25k, 4.7% for AGIs $25k-50k, 7.3% for AGIs $50k-75k, 9.3% for AGIs $75k-100k, 7.4% for AGIs over 100k)
Charity contributions deductions: $4,136 (4% of AGI, reported on 10.1% of returns)
Here:
$4,136
State:
$4,753
Here:
4.4% of AGI
State:
4.2% of AGI
(% of AGI for various income ranges: 0.2% for AGIs below $10k, 0.3% for AGIs $10k-25k, 0.8% for AGIs $25k-50k, 1.3% for AGIs $50k-75k, 1.8% for AGIs $75k-100k, 1.8% for AGIs over 100k)
Total tax: $5,662 (reported on 70.1% of returns)
78229:
$5,662
State:
$9,058
(% of AGI for various income ranges: 2.7% for AGIs below $10k, 3.8% for AGIs $10k-25k, 7.9% for AGIs $25k-50k, 11.5% for AGIs $50k-75k, 13.3% for AGIs $75k-100k, 17.9% for AGIs over 100k)
Earned income credit: $1,819 (reported on 23.7% of returns)
Here:
$1,819
State:
$2,024
Percentage of individuals using paid preparers for their 2004 taxes: 50.2%
Here:
50%
State:
57%
(% for various income ranges: 48.2% for AGIs below $10k, 53.6% for AGIs $10k-25k, 44.7% for AGIs $25k-50k, 48.4% for AGIs $50k-75k, 53.5% for AGIs $75k-100k, 69.7% for AGIs over 100k)
Likely homosexual households (counted as self-reported same-sex unmarried-partner households)
Lesbian couples: 0.3% of all households
Gay men: 0.2% of all households
Household received Food Stamps/SNAP in the past 12 months: 2,882 Household did not receive Food Stamps/SNAP in the past 12 months: 14,401
Women who had a birth in the past 12 months: 881 (335 now married, 530 unmarried) Women who did not have a birth in the past 12 months: 10,402 (2,820 now married, 7,637 unmarried)
Housing units in zip code 78229 with a mortgage: 936 (22 second mortgage, 24 both second mortgage and home equity loan) Median monthly owner costs for units with a mortgage: $1,575 Median monthly owner costs for units without a mortgage: $639
Residents with income below the poverty level in 2022:
This zip code:
23.2%
Whole state:
14.0%
Residents with income below 50% of the poverty level in 2022:
This zip code:
12.0%
Whole state:
7.4%
Median number of rooms in houses and condos:
Here:
5.2
State:
6.3
Median number of rooms in apartments:
Here:
3.5
State:
4.0
Notable locations in this zip code not listed on our city pages
Notable locations in zip code 78229: Oak Hills Country Club (A), Oak Hills Golf Course (B), Oak Park Nursing and Rehabilitation Center (C), Children's Enrichment Center (D), Country Home Learning Center (E), Kids Campus (F), Methodist Plaza (G), Oak Hills Child Development and Learning Center (H), Oak Hills Presbyterian Church Day Care Center (I), San Antonio Fire Department Station 32 (J), San Antonio AirLIFE (K), Medical Reliance Ambulance Service (L), Emerald Ambulance (M). Display/hide their locations on the map
Churches in zip code 78229 include: Communion Chapel Sanctuary Church (A), Ambassador Baptist Church (B), Baruch Hashem Messianic Congregation (C), Community Unitarian Universalist Church (D), Oak Hills Presbyterian Church (E), Verbo Church (F). Display/hide their locations on the map
3,433 married couples with children.
2,858 single-parent households (724 men, 2,134 women).
57.8% of residents of 78229 zip code speak English at home.
24.8% of residents speak Spanish at home (80% very well, 11% well, 8% not well, 2% not at all).
9.0% of residents speak other Indo-European language at home (41% very well, 38% well, 11% not well, 10% not at all).
7.5% of residents speak Asian or Pacific Island language at home (60% very well, 28% well, 11% not well, 1% not at all).
2.1% of residents speak other language at home (54% very well, 33% well, 13% not well).
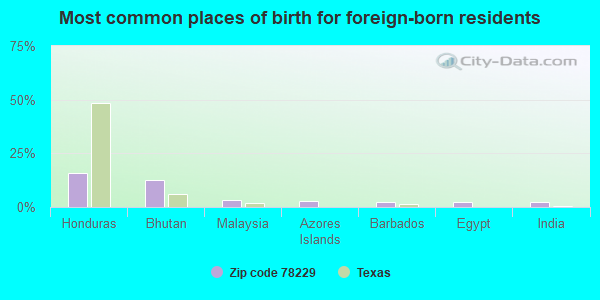
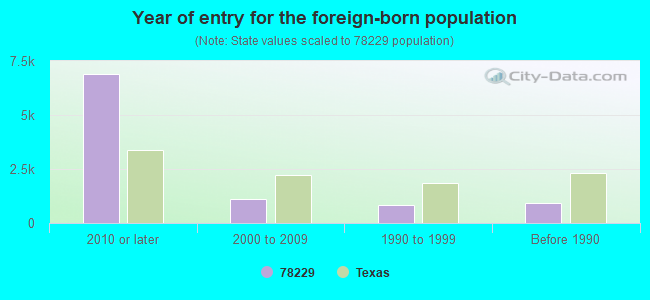
Foreign born population: 8,205 (23.4%) (30.2% of them are naturalized citizens)
Housing units lacking complete plumbing facilities: 1.6% Housing units lacking complete kitchen facilities: 2.0%
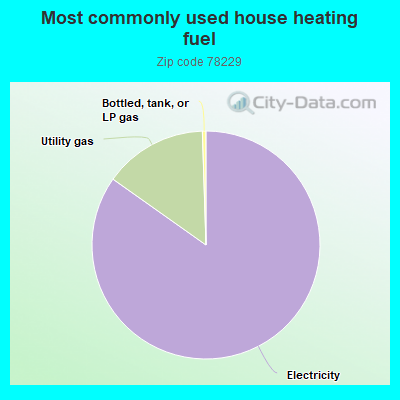
84.3%Electricity
14.6%Utility gas
0.5%Bottled, tank, or LP gas
Population in 1990: 22,681. Population change in the 1990s: +4,904 (+21.6%).
Place of birth for U.S.-born residents:
This state: 18,686
Northeast: 1,392
Midwest: 1,481
South: 1,972
West: 2,612
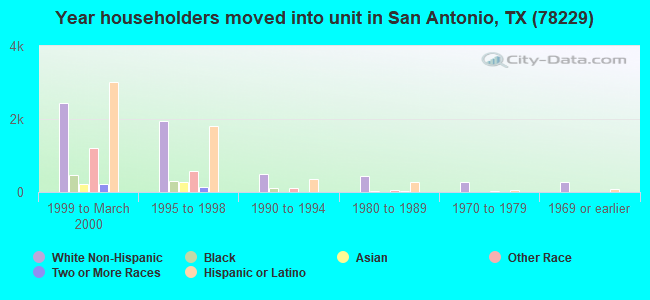
26% of the 78229 zip code residents lived in the same house 5 years ago. Out of people who lived in different houses, 60% lived in this county. Out of people who lived in different counties, 50% lived in Texas.
74% of the 78229 zip code residents lived in the same house 1 year ago. Out of people who lived in different houses, 52% moved from this county. Out of people who lived in different houses, 22% moved from different county within same state. Out of people who lived in different houses, 15% moved from different state. Out of people who lived in different houses, 8% moved from abroad.
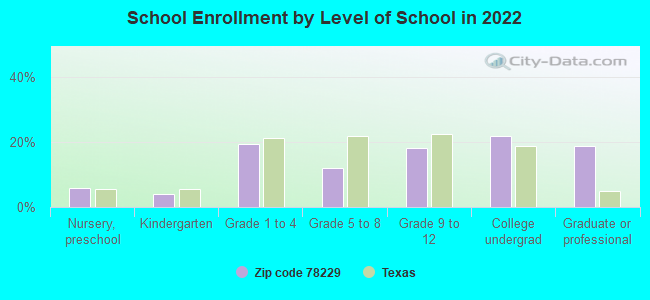
Private vs. public school enrollment:
Students in private schools in grades 1 to 8 (elementary and middle school): 174
Here:
6.7%
Texas:
8.8%
Students in private schools in grades 9 to 12 (high school): 64
Here:
4.3%
Texas:
8.0%
Students in private undergraduate colleges: 485
Here:
26.7%
Texas:
16.2%
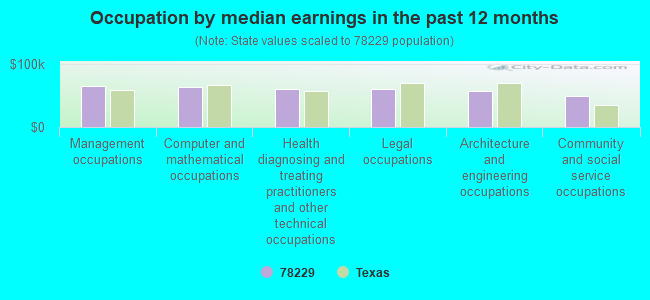
Occupation by median earnings in the past 12 months ($)
64,733Management occupations
63,144Computer and mathematical occupations
61,147Health diagnosing and treating practitioners and other technical occupations
60,717Legal occupations
57,333Architecture and engineering occupations
49,776Community and social service occupations
Companies with biggest federal contracts located in this zip code (SAN ANTONIO, TX):
THE UNIVERSITY OF TEXAS HEALTH (7703 FLOYD CURL DR) : $77,429,049 in 523 contractsfrom 1999 to 2006
Contracts for Other Medical -- Basic Research (R&D), Surgery Services, Biomedical -- Basic Research (R&D), Radiology Services, and moreby Army, Department of Veterans Affairs, National Institutes of Health, Health Resources and Services Administration, and others Signed by year:2000: $18,634,096; 2001: $14,841,344; 2002: $12,522,763; 2003: $11,149,325; 2004: $10,390,760; 2005: $6,824,508; 2006: $3,026,253.
Biggest contracts:
$9,495,096 with Army for Other Medical -- Basic Research (R&D). Signed on 2000-05-18. Completion date: 2002-01-01.
$3,811,000, same as above.Signed on 2001-12-06. Completion date: 2002-01-01.
$2,153,000 with Department of Veterans Affairs for Surgery Services. Signed on 2000-03-15. Completion date: 2000-03-15.
$1,814,528 with Army for Biomedical -- Basic Research (R&D). Signed on 2003-05-22. Completion date: 2005-10-25.
OPERATIONAL TECHNOLOGIES CORP (4100 NW LOOP 410 STE 230) : $23,261,074 in 187 contractsfrom 1999 to 2006
Contracts for ADP Systems Analysis Services, Other ADP and Telecommunications Services (includes data storage on tapes, compact disks, etc.), Installation of Equipment -- Automatic Data Processing Equipment (Including Firmware), Software, Supplies and Support Equipment, ADP Facility Operation and Maintenance Services, and moreby Minerals Management Service, Air Force, Office of Policy, Management and Budget/Chief Financial Officer, Army, and others Signed by year:2000: $7,961,202; 2001: $3,026,513; 2002: $2,253,035; 2003: $2,155,518; 2004: $2,549,504; 2005: $1,503,725; 2006: $961,960.
Biggest contracts:
$1,049,234 with Minerals Management Service for ADP Systems Analysis Services. Taking place in VA. Signed on 2003-07-15. Completion date: 2004-06-15.
$971,160, same as above.Signed on 2004-06-22. Completion date: 2005-06-30.
$868,423 with Air Force for ADP Systems Analysis Services. Signed on 2000-08-02. Completion date: 2000-12-19.
$818,347 with Minerals Management Service for ADP Systems Analysis Services. Taking place in VA. Signed on 2005-06-16. Completion date: 2006-06-30.
RADIOLOGICAL PHYSICS ASSOCIATE (7711 LOUIS PASTEUR DR STE; small business) : $9,867,592 in 29 contractsfrom 1999 to 2006
Contracts for Radiology Services, Quality Control Services -- Instruments and Laboratory Equipment, Other Professional Services, Inspection Services (including commercial testing and lab services, except medical/dental) -- Instruments and Laboratory Equipment, and moreby Army, Department of Veterans Affairs Signed by year:2000: $1,187,000; 2001: $1,286,003; 2002: $1,102,453; 2003: $1,408,444; 2004: $1,553,524; 2005: $1,442,871; 2006: -$609.
Biggest contracts:
$1,521,402 with Army for Radiology Services. Signed on 2005-10-05. Completion date: 2004-09-30.
$1,467,531, same as above.Signed on 2004-10-06. Completion date: 2004-09-30.
$1,415,721, same as above.Signed on 2003-10-28. Completion date: 2004-09-30.
$1,214,275 with Army for Quality Control Services -- Instruments and Laboratory Equipment. Signed on 2002-08-27. Completion date: 2003-09-30.
HISPANIC ASSOCIATION OF COLLEG (8415 DATAPOINT DRIVE, SUIT; small business) : $6,409,377 in 177 contractsfrom 1999 to 2006
Contracts for Educational Services, Certifications and Accreditations for Educational Institutions, Education Services, Program Management/Support Services, and moreby Department of Veterans Affairs, Office of Personnel Management, Departmental Offices, Financial Management Service, and others Signed by year:2000: $397,500; 2001: $733,550; 2002: $125,288; 2003: $215,066; 2004: $1,091,850; 2005: $1,871,235; 2006: $1,618,888.
Biggest contracts:
$592,100 with Department of Veterans Affairs for Educational Services. Taking place in LA. Signed on 2006-04-26. Completion date: 2006-04-26.
$522,000 with Department of Veterans Affairs for Certifications and Accreditations for Educational Institutions. Signed on 2001-06-15. Completion date: 2002-04-15.
$492,810 with Department of Veterans Affairs for Educational Services. Taking place in LA. Signed on 2004-07-13. Completion date: 2004-09-30.
$444,000 with Department of Veterans Affairs for Education Services. Taking place in LA. Signed on 2005-04-06. Effective on 2005-05-01. Completion date: 2005-09-30.
ANGEL STAFFING INC (7959 FREDERICKSBURG RD # 1; small business) : $5,729,071 in 18 contractsfrom 2005 to 2006
Contracts for Nursing Services, Surgery Services, Ophthalmology Services, Pulmonary Services by Army Signed by year:2000: $0; 2001: $0; 2002: $0; 2003: $0; 2004: $0; 2005: $5,298,136; 2006: $430,935.
Biggest contracts:
$2,449,750 with Army for Nursing Services. Signed on 2005-10-05. Completion date: 2005-09-30.
$656,549 with Army for Surgery Services. Signed on 2005-10-19. Completion date: 2005-09-30.
$512,800 with Army for Nursing Services. Signed on 2005-12-09. Completion date: 2006-04-07.
$492,941, same as above.Signed on 2005-11-30. Completion date: 2006-02-28.
DOCUCON INCORPORATED (7461 CALLAGHAN RD; small business) : $5,051,314 in 48 contractsfrom 1999 to 2003
Contracts for ADP Optical Scanning Services, Other ADP and Telecommunications Services (includes data storage on tapes, compact disks, etc.) by Navy Signed by year:2000: $4,169,852; 2001: $215,137; 2002: $72,359; 2003: $31,734; 2004: $0; 2005: $0; 2006: $0.
Biggest contracts:
$2,000,002 with Navy for ADP Optical Scanning Services. Signed on 2000-03-22. Completion date: 2000-12-18.
$975,000, same as above.Signed on 2000-08-28. Completion date: 2001-11-28.
$562,590, same as above.Signed on 1999-10-06. Completion date: 1999-12-18.
$368,550, same as above.Signed on 2000-09-29. Completion date: 2000-10-01.
THE CANCER THERAPY & RESEARCH (7979 WORDSWORTH) : $2,508,000 in 9 contractsfrom 2001 to 2002
Contracts for Nuclear Medicine by Department of Veterans Affairs Signed by year:2000: $0; 2001: $698,000; 2002: $1,810,000; 2003: $0; 2004: $0; 2005: $0; 2006: $0.
Biggest contracts:
$1,500,000 with Department of Veterans Affairs for Nuclear Medicine. Signed on 2002-12-15. Completion date: 2003-09-15.
$310,000, same as above.Signed on 2002-06-15. Completion date: 2002-09-15.
$233,000, same as above.Signed on 2001-09-15. Completion date: 2001-09-15.
$171,000, same as above.Signed on 2001-06-15. Completion date: 2001-09-15.
AMERICAN NURSING SERVICES OF T (3838 MEDICAL DRIVE SUITE 1; small business) : $1,399,745 in 23 contractsfrom 1999 to 2005
Contracts for Pulmonary Services, Nursing Services, Otolaryngology Services by Army, Air Force Signed by year:2000: $63,725; 2001: $136,618; 2002: $103,994; 2003: $573,250; 2004: $320,476; 2005: $171,674; 2006: $0.
Biggest contracts:
$195,464 with Army for Pulmonary Services. Signed on 2004-11-03. Completion date: 2005-09-30.
$143,105, same as above.Signed on 2003-11-30. Completion date: 2005-09-30.
$110,864 with Air Force for Nursing Services. Taking place in AK. Signed on 2003-10-01. Completion date: 2004-09-30.
$107,702, same as above.Signed on 2003-10-01. Completion date: 2004-09-30.
HAROLD TINSLEY JR (4400 HORIZON HILL BLVD SUI; small business) : $1,307,876 in 10 contractsfrom 2002 to 2006
Contracts for Other Social Services, Chaplain Services, Other Professional Services by Air Force Signed by year:2000: $0; 2001: $0; 2002: $441,095; 2003: $309,756; 2004: $296,112; 2005: $306,459; 2006: -$45,546.
Biggest contracts:
$316,510 with Air Force for Other Social Services. Signed on 2005-10-01. Completion date: 2006-09-30.
$296,112 with Air Force for Chaplain Services. Signed on 2004-10-01. Completion date: 2005-09-30.
$289,716 with Air Force for Other Professional Services. Signed on 2003-10-01. Completion date: 2004-09-30.
$239,895, same as above.Signed on 2002-10-01. Completion date: 2003-09-01.
MDI SECURITY SYSTEMS (9725 DATAPOINT DR; small business) : $1,134,739 in 12 contractsfrom 2000 to 2005
Contracts for Miscellaneous Alarm, Signal and Security Detection Systems, Miscellaneous Communication Equipment, Other ADP and Telecommunications Services (includes data storage on tapes, compact disks, etc.), ADPE System Configuration, and moreby Offices, Boards and Divisions (includes Attorney General, Deputy Attorney General, etc.), Navy, Federal Technology Service, Department of Defense, and others Signed by year:2000: $747,935; 2001: $0; 2002: $61,492; 2003: $165,706; 2004: $160,794; 2005: -$1,188; 2006: $0.
Biggest contracts:
$448,000 with Offices, Boards and Divisions (includes Attorney General, Deputy Attorney General, etc.) for Miscellaneous Alarm, Signal and Security Detection Systems. Taking place in DC. Signed on 2000-04-15. Completion date: 2000-09-15.
$242,935 with Navy for Miscellaneous Alarm, Signal and Security Detection Systems. Taking place in CA. Signed on 2000-09-19. Completion date: 2000-09-19.
$157,634 with Navy for Miscellaneous Communication Equipment. Signed on 2004-03-12. Completion date: 2004-04-23.
$77,610 with Navy for Miscellaneous Alarm, Signal and Security Detection Systems. Taking place in CA. Signed on 2003-09-15. Completion date: 2003-10-09.
Top industries in this zip code by the number of employees in 2005:
Health Care and Social Assistance: General Medical and Surgical Hospitals (over 1000 employees: 4 establishments, 500-999 employees: 1 establishment, 250-499 employees: 1 establishment)
Health Care and Social Assistance: Offices of Physicians (except Mental Health Specialists) (250-499: 1, 100-249: 4, 50-99: 9, 20-49: 29, 10-19: 62, 5-9: 82, 1-4: 184)
Health Care and Social Assistance: Home Health Care Services (over 1000: 1, 500-999: 1, 250-499: 3, 100-249: 4, 50-99: 1, 20-49: 6, 10-19: 3, 1-4: 11)
Management of Companies and Enterprises: Corporate, Subsidiary, and Regional Managing Offices (over 1000: 1, 50-99: 2, 20-49: 1, 10-19: 1, 1-4: 1)
Finance and Insurance: Direct Health and Medical Insurance Carriers (250-499: 3, 100-249: 1, 10-19: 1, 5-9: 1, 1-4: 2)
2002 - 2018 National Fire Incident Reporting System (NFIRS) incidents
Based on the data from the years 2002 - 2018 the average number of fires per year is 79. The highest number of fire incidents - 111 took place in 2006, and the least - 0 in 2008. The data has a dropping trend.
When looking into fire subcategories, the most reports belonged to: Outside Fires (36.9%), and Mobile Property/Vehicle Fires (27.5%).
Fire incident types reported to NFIRS in Zip Code 78229
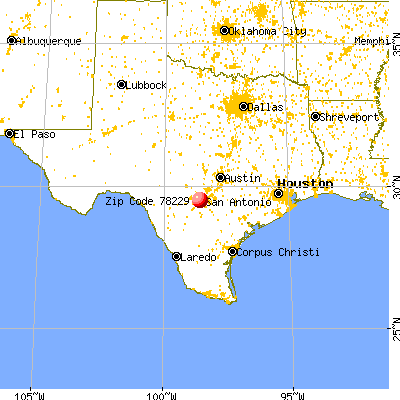


 Nearest zip codes: 78228, 78240, 78230, 78213, 78201, 78238.
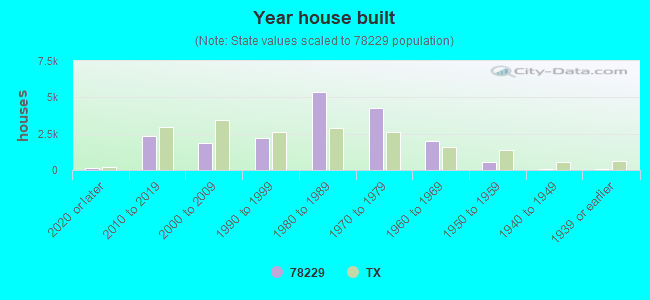


 : $77,429,049 in 523 contracts from 1999 to 2006


 Based on the data from the years 2002 - 2018 the average number of fires per year is 79. The highest number of fire incidents - 111 took place in 2006, and the least - 0 in 2008. The data has a dropping trend.
 When looking into fire subcategories, the most reports belonged to: Outside Fires (36.9%), and Mobile Property/Vehicle Fires (27.5%).