Cities: San Benito, TX (8.75%) ,
Brownsville, TX (7.40%) ,
Laureles, TX (2.42%) ,
Green Valley Farms, TX (2.15%) ,
Rangerville, TX (1.92%) ,
Arroyo Gardens, TX (1.69%) ,
Encantada-Ranchito El Calaboz, TX (1.59%) ,
La Paloma, TX (1.17%) ,
Bluetown, TX (0.65%) ,
Harlingen, TX (0.62%) ,
Arroyo Colorado Estates, TX (0.59%) ,
Los Indios, TX (0.48%) ,
El Camino Angosto, TX (0.18%) ,
Villa del Sol, TX (0.10%) ,
Lozano, TX (0.06%) ,
Lago, TX (0.03%) ,
Rancho Viejo, TX (0.02%) County: Cameron County, TX Estimated zip code population in 2022: 50,834
Zip code population in 2010: 55,878
Zip code population in 2000: 45,717
Houses and condos: 17,008
Renter-occupied apartments: 3,607
% of renters here:
23%State:
38%
March 2022 cost of living index in zip code 78586: 78.6
(low, U.S. average is 100)
Land area: 176.3
sq. mi.
Water area: 7.9
sq. mi.
Population density: 288 people per square mile (very low).
OSM Map
General Map
Google Map
MSN Map
OSM Map
General Map
Google Map
MSN Map
OSM Map
General Map
Google Map
MSN Map
OSM Map
General Map
Google Map
MSN Map
Please wait while loading the map...
Real estate property taxes paid for housing units in 2022:
This zip code:
1.4% ($1,196)Texas:
1.5% ($4,050)
Median real estate property taxes paid for housing units with mortgages in 2022: $1,955 (1.5%)
Median real estate property taxes paid for housing units with no mortgage in 2022: $1,042 (1.4%)
Profiles of local businesses
Business Search - 14 Million verified businesses
Males: 25,113 Females: 25,720
For population 25 years and over in 78586:
High school or higher: 64.9%Bachelor's degree or higher: 13.1%Graduate or professional degree: 4.7%Unemployed: 3.6%Mean travel time to work (commute): 21.0 minutes
For population 15 years and over in 78586:
Never married: 31.6%Now married: 52.4%Separated: 3.3%Widowed: 5.2%Divorced: 7.5%
Zip code 78586 compared to state average:
Median household income below state average. Median house value significantly below state average. Black race population percentage significantly below state average. Hispanic race population percentage above state average. Median age below state average. Renting percentage below state average. Length of stay since moving in significantly above state average. Percentage of population with a bachelor's degree or higher significantly below state average. 48,038 94.5% Hispanic or Latino 2,564 5.0% White 120 0.2% Two or more races 64 0.1% Black 32 0.06% Asian 14 0.03% Native Hawaiian and Other
Data:
Median household income ($)
Median household income (% change since 2000)
Household income diversity
Ratio of average income to average house value (%)
Ratio of average income to average rent
Median household income ($) - White
Median household income ($) - Black or African American
Median household income ($) - Asian
Median household income ($) - Hispanic or Latino
Median household income ($) - American Indian and Alaska Native
Median household income ($) - Multirace
Median household income ($) - Other Race
Median household income for houses/condos with a mortgage ($)
Median household income for apartments without a mortgage ($)
Races - White alone (%)
Races - White alone (% change since 2000)
Races - Black alone (%)
Races - Black alone (% change since 2000)
Races - American Indian alone (%)
Races - American Indian alone (% change since 2000)
Races - Asian alone (%)
Races - Asian alone (% change since 2000)
Races - Hispanic (%)
Races - Hispanic (% change since 2000)
Races - Native Hawaiian and Other Pacific Islander alone (%)
Races - Native Hawaiian and Other Pacific Islander alone (% change since 2000)
Races - Two or more races (%)
Races - Two or more races (% change since 2000)
Races - Other race alone (%)
Races - Other race alone (% change since 2000)
Racial diversity
Unemployment (%)
Unemployment (% change since 2000)
Unemployment (%) - White
Unemployment (%) - Black or African American
Unemployment (%) - Asian
Unemployment (%) - Hispanic or Latino
Unemployment (%) - American Indian and Alaska Native
Unemployment (%) - Multirace
Unemployment (%) - Other Race
Population density (people per square mile)
Population - Males (%)
Population - Females (%)
Population - Males (%) - White
Population - Males (%) - Black or African American
Population - Males (%) - Asian
Population - Males (%) - Hispanic or Latino
Population - Males (%) - American Indian and Alaska Native
Population - Males (%) - Multirace
Population - Males (%) - Other Race
Population - Females (%) - White
Population - Females (%) - Black or African American
Population - Females (%) - Asian
Population - Females (%) - Hispanic or Latino
Population - Females (%) - American Indian and Alaska Native
Population - Females (%) - Multirace
Population - Females (%) - Other Race
Coronavirus confirmed cases (Jun 10, 2024)
Deaths caused by coronavirus (Jun 10, 2024)
Coronavirus confirmed cases (per 100k population) (Jun 10, 2024)
Deaths caused by coronavirus (per 100k population) (Jun 10, 2024)
Daily increase in number of cases (Jun 10, 2024)
Weekly increase in number of cases (Jun 10, 2024)
Cases doubled (in days) (Jun 10, 2024)
Hospitalized patients (Apr 18, 2022)
Negative test results (Apr 18, 2022)
Total test results (Apr 18, 2022)
COVID Vaccine doses distributed (per 100k population) (Sep 19, 2023)
COVID Vaccine doses administered (per 100k population) (Sep 19, 2023)
COVID Vaccine doses distributed (Sep 19, 2023)
COVID Vaccine doses administered (Sep 19, 2023)
Likely homosexual households (%)
Likely homosexual households (% change since 2000)
Likely homosexual households - Lesbian couples (%)
Likely homosexual households - Lesbian couples (% change since 2000)
Likely homosexual households - Gay men (%)
Likely homosexual households - Gay men (% change since 2000)
Cost of living index
Median gross rent ($)
Median contract rent ($)
Median monthly housing costs ($)
Median house or condo value ($)
Median house or condo value ($ change since 2000)
Mean house or condo value by units in structure - 1, detached ($)
Mean house or condo value by units in structure - 1, attached ($)
Mean house or condo value by units in structure - 2 ($)
Mean house or condo value by units in structure by units in structure - 3 or 4 ($)
Mean house or condo value by units in structure - 5 or more ($)
Mean house or condo value by units in structure - Boat, RV, van, etc. ($)
Mean house or condo value by units in structure - Mobile home ($)
Median house or condo value ($) - White
Median house or condo value ($) - Black or African American
Median house or condo value ($) - Asian
Median house or condo value ($) - Hispanic or Latino
Median house or condo value ($) - American Indian and Alaska Native
Median house or condo value ($) - Multirace
Median house or condo value ($) - Other Race
Median resident age
Resident age diversity
Median resident age - Males
Median resident age - Females
Median resident age - White
Median resident age - Black or African American
Median resident age - Asian
Median resident age - Hispanic or Latino
Median resident age - American Indian and Alaska Native
Median resident age - Multirace
Median resident age - Other Race
Median resident age - Males - White
Median resident age - Males - Black or African American
Median resident age - Males - Asian
Median resident age - Males - Hispanic or Latino
Median resident age - Males - American Indian and Alaska Native
Median resident age - Males - Multirace
Median resident age - Males - Other Race
Median resident age - Females - White
Median resident age - Females - Black or African American
Median resident age - Females - Asian
Median resident age - Females - Hispanic or Latino
Median resident age - Females - American Indian and Alaska Native
Median resident age - Females - Multirace
Median resident age - Females - Other Race
Commute - mean travel time to work (minutes)
Travel time to work - Less than 5 minutes (%)
Travel time to work - Less than 5 minutes (% change since 2000)
Travel time to work - 5 to 9 minutes (%)
Travel time to work - 5 to 9 minutes (% change since 2000)
Travel time to work - 10 to 19 minutes (%)
Travel time to work - 10 to 19 minutes (% change since 2000)
Travel time to work - 20 to 29 minutes (%)
Travel time to work - 20 to 29 minutes (% change since 2000)
Travel time to work - 30 to 39 minutes (%)
Travel time to work - 30 to 39 minutes (% change since 2000)
Travel time to work - 40 to 59 minutes (%)
Travel time to work - 40 to 59 minutes (% change since 2000)
Travel time to work - 60 to 89 minutes (%)
Travel time to work - 60 to 89 minutes (% change since 2000)
Travel time to work - 90 or more minutes (%)
Travel time to work - 90 or more minutes (% change since 2000)
Marital status - Never married (%)
Marital status - Now married (%)
Marital status - Separated (%)
Marital status - Widowed (%)
Marital status - Divorced (%)
Median family income ($)
Median family income (% change since 2000)
Median non-family income ($)
Median non-family income (% change since 2000)
Median per capita income ($)
Median per capita income (% change since 2000)
Median family income ($) - White
Median family income ($) - Black or African American
Median family income ($) - Asian
Median family income ($) - Hispanic or Latino
Median family income ($) - American Indian and Alaska Native
Median family income ($) - Multirace
Median family income ($) - Other Race
Median year house/condo built
Median year apartment built
Year house built - Built 2005 or later (%)
Year house built - Built 2000 to 2004 (%)
Year house built - Built 1990 to 1999 (%)
Year house built - Built 1980 to 1989 (%)
Year house built - Built 1970 to 1979 (%)
Year house built - Built 1960 to 1969 (%)
Year house built - Built 1950 to 1959 (%)
Year house built - Built 1940 to 1949 (%)
Year house built - Built 1939 or earlier (%)
Average household size
Household density (households per square mile)
Average household size - White
Average household size - Black or African American
Average household size - Asian
Average household size - Hispanic or Latino
Average household size - American Indian and Alaska Native
Average household size - Multirace
Average household size - Other Race
Occupied housing units (%)
Vacant housing units (%)
Owner occupied housing units (%)
Renter occupied housing units (%)
Vacancy status - For rent (%)
Vacancy status - For sale only (%)
Vacancy status - Rented or sold, not occupied (%)
Vacancy status - For seasonal, recreational, or occasional use (%)
Vacancy status - For migrant workers (%)
Vacancy status - Other vacant (%)
Residents with income below the poverty level (%)
Residents with income below 50% of the poverty level (%)
Children below poverty level (%)
Poor families by family type - Married-couple family (%)
Poor families by family type - Male, no wife present (%)
Poor families by family type - Female, no husband present (%)
Poverty status for native-born residents (%)
Poverty status for foreign-born residents (%)
Poverty among high school graduates not in families (%)
Poverty among people who did not graduate high school not in families (%)
Residents with income below the poverty level (%) - White
Residents with income below the poverty level (%) - Black or African American
Residents with income below the poverty level (%) - Asian
Residents with income below the poverty level (%) - Hispanic or Latino
Residents with income below the poverty level (%) - American Indian and Alaska Native
Residents with income below the poverty level (%) - Multirace
Residents with income below the poverty level (%) - Other Race
Air pollution - Air Quality Index (AQI)
Air pollution - CO
Air pollution - NO2
Air pollution - SO2
Air pollution - Ozone
Air pollution - PM10
Air pollution - PM25
Air pollution - Pb
Crime - Murders per 100,000 population
Crime - Rapes per 100,000 population
Crime - Robberies per 100,000 population
Crime - Assaults per 100,000 population
Crime - Burglaries per 100,000 population
Crime - Thefts per 100,000 population
Crime - Auto thefts per 100,000 population
Crime - Arson per 100,000 population
Crime - City-data.com crime index
Crime - Violent crime index
Crime - Property crime index
Crime - Murders per 100,000 population (5 year average)
Crime - Rapes per 100,000 population (5 year average)
Crime - Robberies per 100,000 population (5 year average)
Crime - Assaults per 100,000 population (5 year average)
Crime - Burglaries per 100,000 population (5 year average)
Crime - Thefts per 100,000 population (5 year average)
Crime - Auto thefts per 100,000 population (5 year average)
Crime - Arson per 100,000 population (5 year average)
Crime - City-data.com crime index (5 year average)
Crime - Violent crime index (5 year average)
Crime - Property crime index (5 year average)
1996 Presidential Elections Results (%) - Democratic Party (Clinton)
1996 Presidential Elections Results (%) - Republican Party (Dole)
1996 Presidential Elections Results (%) - Other
2000 Presidential Elections Results (%) - Democratic Party (Gore)
2000 Presidential Elections Results (%) - Republican Party (Bush)
2000 Presidential Elections Results (%) - Other
2004 Presidential Elections Results (%) - Democratic Party (Kerry)
2004 Presidential Elections Results (%) - Republican Party (Bush)
2004 Presidential Elections Results (%) - Other
2008 Presidential Elections Results (%) - Democratic Party (Obama)
2008 Presidential Elections Results (%) - Republican Party (McCain)
2008 Presidential Elections Results (%) - Other
2012 Presidential Elections Results (%) - Democratic Party (Obama)
2012 Presidential Elections Results (%) - Republican Party (Romney)
2012 Presidential Elections Results (%) - Other
2016 Presidential Elections Results (%) - Democratic Party (Clinton)
2016 Presidential Elections Results (%) - Republican Party (Trump)
2016 Presidential Elections Results (%) - Other
2020 Presidential Elections Results (%) - Democratic Party (Biden)
2020 Presidential Elections Results (%) - Republican Party (Trump)
2020 Presidential Elections Results (%) - Other
Ancestries Reported - Arab (%)
Ancestries Reported - Czech (%)
Ancestries Reported - Danish (%)
Ancestries Reported - Dutch (%)
Ancestries Reported - English (%)
Ancestries Reported - French (%)
Ancestries Reported - French Canadian (%)
Ancestries Reported - German (%)
Ancestries Reported - Greek (%)
Ancestries Reported - Hungarian (%)
Ancestries Reported - Irish (%)
Ancestries Reported - Italian (%)
Ancestries Reported - Lithuanian (%)
Ancestries Reported - Norwegian (%)
Ancestries Reported - Polish (%)
Ancestries Reported - Portuguese (%)
Ancestries Reported - Russian (%)
Ancestries Reported - Scotch-Irish (%)
Ancestries Reported - Scottish (%)
Ancestries Reported - Slovak (%)
Ancestries Reported - Subsaharan African (%)
Ancestries Reported - Swedish (%)
Ancestries Reported - Swiss (%)
Ancestries Reported - Ukrainian (%)
Ancestries Reported - United States (%)
Ancestries Reported - Welsh (%)
Ancestries Reported - West Indian (%)
Ancestries Reported - Other (%)
Educational Attainment - No schooling completed (%)
Educational Attainment - Less than high school (%)
Educational Attainment - High school or equivalent (%)
Educational Attainment - Less than 1 year of college (%)
Educational Attainment - 1 or more years of college (%)
Educational Attainment - Associate degree (%)
Educational Attainment - Bachelor's degree (%)
Educational Attainment - Master's degree (%)
Educational Attainment - Professional school degree (%)
Educational Attainment - Doctorate degree (%)
School Enrollment - Nursery, preschool (%)
School Enrollment - Kindergarten (%)
School Enrollment - Grade 1 to 4 (%)
School Enrollment - Grade 5 to 8 (%)
School Enrollment - Grade 9 to 12 (%)
School Enrollment - College undergrad (%)
School Enrollment - Graduate or professional (%)
School Enrollment - Not enrolled in school (%)
School enrollment - Public schools (%)
School enrollment - Private schools (%)
School enrollment - Not enrolled (%)
Median number of rooms in houses and condos
Median number of rooms in apartments
Housing units lacking complete plumbing facilities (%)
Housing units lacking complete kitchen facilities (%)
Density of houses
Urban houses (%)
Rural houses (%)
Households with people 60 years and over (%)
Households with people 65 years and over (%)
Households with people 75 years and over (%)
Households with one or more nonrelatives (%)
Households with no nonrelatives (%)
Population in households (%)
Family households (%)
Nonfamily households (%)
Population in families (%)
Family households with own children (%)
Median number of bedrooms in owner occupied houses
Mean number of bedrooms in owner occupied houses
Median number of bedrooms in renter occupied houses
Mean number of bedrooms in renter occupied houses
Median number of vehichles in owner occupied houses
Mean number of vehichles in owner occupied houses
Median number of vehichles in renter occupied houses
Mean number of vehichles in renter occupied houses
Mortgage status - with mortgage (%)
Mortgage status - with second mortgage (%)
Mortgage status - with home equity loan (%)
Mortgage status - with both second mortgage and home equity loan (%)
Mortgage status - without a mortgage (%)
Average family size
Average family size - White
Average family size - Black or African American
Average family size - Asian
Average family size - Hispanic or Latino
Average family size - American Indian and Alaska Native
Average family size - Multirace
Average family size - Other Race
Geographical mobility - Same house 1 year ago (%)
Geographical mobility - Moved within same county (%)
Geographical mobility - Moved from different county within same state (%)
Geographical mobility - Moved from different state (%)
Geographical mobility - Moved from abroad (%)
Place of birth - Born in state of residence (%)
Place of birth - Born in other state (%)
Place of birth - Native, outside of US (%)
Place of birth - Foreign born (%)
Housing units in structures - 1, detached (%)
Housing units in structures - 1, attached (%)
Housing units in structures - 2 (%)
Housing units in structures - 3 or 4 (%)
Housing units in structures - 5 to 9 (%)
Housing units in structures - 10 to 19 (%)
Housing units in structures - 20 to 49 (%)
Housing units in structures - 50 or more (%)
Housing units in structures - Mobile home (%)
Housing units in structures - Boat, RV, van, etc. (%)
House/condo owner moved in on average (years ago)
Renter moved in on average (years ago)
Year householder moved into unit - Moved in 1999 to March 2000 (%)
Year householder moved into unit - Moved in 1995 to 1998 (%)
Year householder moved into unit - Moved in 1990 to 1994 (%)
Year householder moved into unit - Moved in 1980 to 1989 (%)
Year householder moved into unit - Moved in 1970 to 1979 (%)
Year householder moved into unit - Moved in 1969 or earlier (%)
Means of transportation to work - Drove car alone (%)
Means of transportation to work - Carpooled (%)
Means of transportation to work - Public transportation (%)
Means of transportation to work - Bus or trolley bus (%)
Means of transportation to work - Streetcar or trolley car (%)
Means of transportation to work - Subway or elevated (%)
Means of transportation to work - Railroad (%)
Means of transportation to work - Ferryboat (%)
Means of transportation to work - Taxicab (%)
Means of transportation to work - Motorcycle (%)
Means of transportation to work - Bicycle (%)
Means of transportation to work - Walked (%)
Means of transportation to work - Other means (%)
Working at home (%)
Industry diversity
Most Common Industries - Agriculture, forestry, fishing and hunting, and mining (%)
Most Common Industries - Agriculture, forestry, fishing and hunting (%)
Most Common Industries - Mining, quarrying, and oil and gas extraction (%)
Most Common Industries - Construction (%)
Most Common Industries - Manufacturing (%)
Most Common Industries - Wholesale trade (%)
Most Common Industries - Retail trade (%)
Most Common Industries - Transportation and warehousing, and utilities (%)
Most Common Industries - Transportation and warehousing (%)
Most Common Industries - Utilities (%)
Most Common Industries - Information (%)
Most Common Industries - Finance and insurance, and real estate and rental and leasing (%)
Most Common Industries - Finance and insurance (%)
Most Common Industries - Real estate and rental and leasing (%)
Most Common Industries - Professional, scientific, and management, and administrative and waste management services (%)
Most Common Industries - Professional, scientific, and technical services (%)
Most Common Industries - Management of companies and enterprises (%)
Most Common Industries - Administrative and support and waste management services (%)
Most Common Industries - Educational services, and health care and social assistance (%)
Most Common Industries - Educational services (%)
Most Common Industries - Health care and social assistance (%)
Most Common Industries - Arts, entertainment, and recreation, and accommodation and food services (%)
Most Common Industries - Arts, entertainment, and recreation (%)
Most Common Industries - Accommodation and food services (%)
Most Common Industries - Other services, except public administration (%)
Most Common Industries - Public administration (%)
Occupation diversity
Most Common Occupations - Management, business, science, and arts occupations (%)
Most Common Occupations - Management, business, and financial occupations (%)
Most Common Occupations - Management occupations (%)
Most Common Occupations - Business and financial operations occupations (%)
Most Common Occupations - Computer, engineering, and science occupations (%)
Most Common Occupations - Computer and mathematical occupations (%)
Most Common Occupations - Architecture and engineering occupations (%)
Most Common Occupations - Life, physical, and social science occupations (%)
Most Common Occupations - Education, legal, community service, arts, and media occupations (%)
Most Common Occupations - Community and social service occupations (%)
Most Common Occupations - Legal occupations (%)
Most Common Occupations - Education, training, and library occupations (%)
Most Common Occupations - Arts, design, entertainment, sports, and media occupations (%)
Most Common Occupations - Healthcare practitioners and technical occupations (%)
Most Common Occupations - Health diagnosing and treating practitioners and other technical occupations (%)
Most Common Occupations - Health technologists and technicians (%)
Most Common Occupations - Service occupations (%)
Most Common Occupations - Healthcare support occupations (%)
Most Common Occupations - Protective service occupations (%)
Most Common Occupations - Fire fighting and prevention, and other protective service workers including supervisors (%)
Most Common Occupations - Law enforcement workers including supervisors (%)
Most Common Occupations - Food preparation and serving related occupations (%)
Most Common Occupations - Building and grounds cleaning and maintenance occupations (%)
Most Common Occupations - Personal care and service occupations (%)
Most Common Occupations - Sales and office occupations (%)
Most Common Occupations - Sales and related occupations (%)
Most Common Occupations - Office and administrative support occupations (%)
Most Common Occupations - Natural resources, construction, and maintenance occupations (%)
Most Common Occupations - Farming, fishing, and forestry occupations (%)
Most Common Occupations - Construction and extraction occupations (%)
Most Common Occupations - Installation, maintenance, and repair occupations (%)
Most Common Occupations - Production, transportation, and material moving occupations (%)
Most Common Occupations - Production occupations (%)
Most Common Occupations - Transportation occupations (%)
Most Common Occupations - Material moving occupations (%)
People in Group quarters - Institutionalized population (%)
People in Group quarters - Correctional institutions (%)
People in Group quarters - Federal prisons and detention centers (%)
People in Group quarters - Halfway houses (%)
People in Group quarters - Local jails and other confinement facilities (including police lockups) (%)
People in Group quarters - Military disciplinary barracks (%)
People in Group quarters - State prisons (%)
People in Group quarters - Other types of correctional institutions (%)
People in Group quarters - Nursing homes (%)
People in Group quarters - Hospitals/wards, hospices, and schools for the handicapped (%)
People in Group quarters - Hospitals/wards and hospices for chronically ill (%)
People in Group quarters - Hospices or homes for chronically ill (%)
People in Group quarters - Military hospitals or wards for chronically ill (%)
People in Group quarters - Other hospitals or wards for chronically ill (%)
People in Group quarters - Hospitals or wards for drug/alcohol abuse (%)
People in Group quarters - Mental (Psychiatric) hospitals or wards (%)
People in Group quarters - Schools, hospitals, or wards for the mentally retarded (%)
People in Group quarters - Schools, hospitals, or wards for the physically handicapped (%)
People in Group quarters - Institutions for the deaf (%)
People in Group quarters - Institutions for the blind (%)
People in Group quarters - Orthopedic wards and institutions for the physically handicapped (%)
People in Group quarters - Wards in general hospitals for patients who have no usual home elsewhere (%)
People in Group quarters - Wards in military hospitals for patients who have no usual home elsewhere (%)
People in Group quarters - Juvenile institutions (%)
People in Group quarters - Long-term care (%)
People in Group quarters - Homes for abused, dependent, and neglected children (%)
People in Group quarters - Residential treatment centers for emotionally disturbed children (%)
People in Group quarters - Training schools for juvenile delinquents (%)
People in Group quarters - Short-term care, detention or diagnostic centers for delinquent children (%)
People in Group quarters - Type of juvenile institution unknown (%)
People in Group quarters - Noninstitutionalized population (%)
People in Group quarters - College dormitories (includes college quarters off campus) (%)
People in Group quarters - Military quarters (%)
People in Group quarters - On base (%)
People in Group quarters - Barracks, unaccompanied personnel housing (UPH), (Enlisted/Officer), ;and similar group living quarters for military personnel (%)
People in Group quarters - Transient quarters for temporary residents (%)
People in Group quarters - Military ships (%)
People in Group quarters - Group homes (%)
People in Group quarters - Homes or halfway houses for drug/alcohol abuse (%)
People in Group quarters - Homes for the mentally ill (%)
People in Group quarters - Homes for the mentally retarded (%)
People in Group quarters - Homes for the physically handicapped (%)
People in Group quarters - Other group homes (%)
People in Group quarters - Religious group quarters (%)
People in Group quarters - Dormitories (%)
People in Group quarters - Agriculture workers' dormitories on farms (%)
People in Group quarters - Job Corps and vocational training facilities (%)
People in Group quarters - Other workers' dormitories (%)
People in Group quarters - Crews of maritime vessels (%)
People in Group quarters - Other nonhousehold living situations (%)
People in Group quarters - Other noninstitutional group quarters (%)
Residents speaking English at home (%)
Residents speaking English at home - Born in the United States (%)
Residents speaking English at home - Native, born elsewhere (%)
Residents speaking English at home - Foreign born (%)
Residents speaking Spanish at home (%)
Residents speaking Spanish at home - Born in the United States (%)
Residents speaking Spanish at home - Native, born elsewhere (%)
Residents speaking Spanish at home - Foreign born (%)
Residents speaking other language at home (%)
Residents speaking other language at home - Born in the United States (%)
Residents speaking other language at home - Native, born elsewhere (%)
Residents speaking other language at home - Foreign born (%)
Class of Workers - Employee of private company (%)
Class of Workers - Self-employed in own incorporated business (%)
Class of Workers - Private not-for-profit wage and salary workers (%)
Class of Workers - Local government workers (%)
Class of Workers - State government workers (%)
Class of Workers - Federal government workers (%)
Class of Workers - Self-employed workers in own not incorporated business and Unpaid family workers (%)
House heating fuel used in houses and condos - Utility gas (%)
House heating fuel used in houses and condos - Bottled, tank, or LP gas (%)
House heating fuel used in houses and condos - Electricity (%)
House heating fuel used in houses and condos - Fuel oil, kerosene, etc. (%)
House heating fuel used in houses and condos - Coal or coke (%)
House heating fuel used in houses and condos - Wood (%)
House heating fuel used in houses and condos - Solar energy (%)
House heating fuel used in houses and condos - Other fuel (%)
House heating fuel used in houses and condos - No fuel used (%)
House heating fuel used in apartments - Utility gas (%)
House heating fuel used in apartments - Bottled, tank, or LP gas (%)
House heating fuel used in apartments - Electricity (%)
House heating fuel used in apartments - Fuel oil, kerosene, etc. (%)
House heating fuel used in apartments - Coal or coke (%)
House heating fuel used in apartments - Wood (%)
House heating fuel used in apartments - Solar energy (%)
House heating fuel used in apartments - Other fuel (%)
House heating fuel used in apartments - No fuel used (%)
Armed forces status - In Armed Forces (%)
Armed forces status - Civilian (%)
Armed forces status - Civilian - Veteran (%)
Armed forces status - Civilian - Nonveteran (%)
Fatal accidents locations in years 2005-2021
Fatal accidents locations in 2005
Fatal accidents locations in 2006
Fatal accidents locations in 2007
Fatal accidents locations in 2008
Fatal accidents locations in 2009
Fatal accidents locations in 2010
Fatal accidents locations in 2011
Fatal accidents locations in 2012
Fatal accidents locations in 2013
Fatal accidents locations in 2014
Fatal accidents locations in 2015
Fatal accidents locations in 2016
Fatal accidents locations in 2017
Fatal accidents locations in 2018
Fatal accidents locations in 2019
Fatal accidents locations in 2020
Fatal accidents locations in 2021
Alcohol use - People drinking some alcohol every month (%)
Alcohol use - People not drinking at all (%)
Alcohol use - Average days/month drinking alcohol
Alcohol use - Average drinks/week
Alcohol use - Average days/year people drink much
Audiometry - Average condition of hearing (%)
Audiometry - People that can hear a whisper from across a quiet room (%)
Audiometry - People that can hear normal voice from across a quiet room (%)
Audiometry - Ears ringing, roaring, buzzing (%)
Audiometry - Had a job exposure to loud noise (%)
Audiometry - Had off-work exposure to loud noise (%)
Blood Pressure & Cholesterol - Has high blood pressure (%)
Blood Pressure & Cholesterol - Checking blood pressure at home (%)
Blood Pressure & Cholesterol - Frequently checking blood cholesterol (%)
Blood Pressure & Cholesterol - Has high cholesterol level (%)
Consumer Behavior - Money monthly spent on food at supermarket/grocery store
Consumer Behavior - Money monthly spent on food at other stores
Consumer Behavior - Money monthly spent on eating out
Consumer Behavior - Money monthly spent on carryout/delivered foods
Consumer Behavior - Income spent on food at supermarket/grocery store (%)
Consumer Behavior - Income spent on food at other stores (%)
Consumer Behavior - Income spent on eating out (%)
Consumer Behavior - Income spent on carryout/delivered foods (%)
Current Health Status - General health condition (%)
Current Health Status - Blood donors (%)
Current Health Status - Has blood ever tested for HIV virus (%)
Current Health Status - Left-handed people (%)
Dermatology - People using sunscreen (%)
Diabetes - Diabetics (%)
Diabetes - Had a blood test for high blood sugar (%)
Diabetes - People taking insulin (%)
Diet Behavior & Nutrition - Diet health (%)
Diet Behavior & Nutrition - Milk product consumption (# of products/month)
Diet Behavior & Nutrition - Meals not home prepared (#/week)
Diet Behavior & Nutrition - Meals from fast food or pizza place (#/week)
Diet Behavior & Nutrition - Ready-to-eat foods (#/month)
Diet Behavior & Nutrition - Frozen meals/pizza (#/month)
Drug Use - People that ever used marijuana or hashish (%)
Drug Use - Ever used hard drugs (%)
Drug Use - Ever used any form of cocaine (%)
Drug Use - Ever used heroin (%)
Drug Use - Ever used methamphetamine (%)
Health Insurance - People covered by health insurance (%)
Kidney Conditions-Urology - Avg. # of times urinating at night
Medical Conditions - People with asthma (%)
Medical Conditions - People with anemia (%)
Medical Conditions - People with psoriasis (%)
Medical Conditions - People with overweight (%)
Medical Conditions - Elderly people having difficulties in thinking or remembering (%)
Medical Conditions - People who ever received blood transfusion (%)
Medical Conditions - People having trouble seeing even with glass/contacts (%)
Medical Conditions - People with arthritis (%)
Medical Conditions - People with gout (%)
Medical Conditions - People with congestive heart failure (%)
Medical Conditions - People with coronary heart disease (%)
Medical Conditions - People with angina pectoris (%)
Medical Conditions - People who ever had heart attack (%)
Medical Conditions - People who ever had stroke (%)
Medical Conditions - People with emphysema (%)
Medical Conditions - People with thyroid problem (%)
Medical Conditions - People with chronic bronchitis (%)
Medical Conditions - People with any liver condition (%)
Medical Conditions - People who ever had cancer or malignancy (%)
Mental Health - People who have little interest in doing things (%)
Mental Health - People feeling down, depressed, or hopeless (%)
Mental Health - People who have trouble sleeping or sleeping too much (%)
Mental Health - People feeling tired or having little energy (%)
Mental Health - People with poor appetite or overeating (%)
Mental Health - People feeling bad about themself (%)
Mental Health - People who have trouble concentrating on things (%)
Mental Health - People moving or speaking slowly or too fast (%)
Mental Health - People having thoughts they would be better off dead (%)
Oral Health - Average years since last visit a dentist
Oral Health - People embarrassed because of mouth (%)
Oral Health - People with gum disease (%)
Oral Health - General health of teeth and gums (%)
Oral Health - Average days a week using dental floss/device
Oral Health - Average days a week using mouthwash for dental problem
Oral Health - Average number of teeth
Pesticide Use - Households using pesticides to control insects (%)
Pesticide Use - Households using pesticides to kill weeds (%)
Physical Activity - People doing vigorous-intensity work activities (%)
Physical Activity - People doing moderate-intensity work activities (%)
Physical Activity - People walking or bicycling (%)
Physical Activity - People doing vigorous-intensity recreational activities (%)
Physical Activity - People doing moderate-intensity recreational activities (%)
Physical Activity - Average hours a day doing sedentary activities
Physical Activity - Average hours a day watching TV or videos
Physical Activity - Average hours a day using computer
Physical Functioning - People having limitations keeping them from working (%)
Physical Functioning - People limited in amount of work they can do (%)
Physical Functioning - People that need special equipment to walk (%)
Physical Functioning - People experiencing confusion/memory problems (%)
Physical Functioning - People requiring special healthcare equipment (%)
Prescription Medications - Average number of prescription medicines taking
Preventive Aspirin Use - Adults 40+ taking low-dose aspirin (%)
Reproductive Health - Vaginal deliveries (%)
Reproductive Health - Cesarean deliveries (%)
Reproductive Health - Deliveries resulted in a live birth (%)
Reproductive Health - Pregnancies resulted in a delivery (%)
Reproductive Health - Women breastfeeding newborns (%)
Reproductive Health - Women that had a hysterectomy (%)
Reproductive Health - Women that had both ovaries removed (%)
Reproductive Health - Women that have ever taken birth control pills (%)
Reproductive Health - Women taking birth control pills (%)
Reproductive Health - Women that have ever used Depo-Provera or injectables (%)
Reproductive Health - Women that have ever used female hormones (%)
Sexual Behavior - People 18+ that ever had sex (vaginal, anal, or oral) (%)
Sexual Behavior - Males 18+ that ever had vaginal sex with a woman (%)
Sexual Behavior - Males 18+ that ever performed oral sex on a woman (%)
Sexual Behavior - Males 18+ that ever had anal sex with a woman (%)
Sexual Behavior - Males 18+ that ever had any sex with a man (%)
Sexual Behavior - Females 18+ that ever had vaginal sex with a man (%)
Sexual Behavior - Females 18+ that ever performed oral sex on a man (%)
Sexual Behavior - Females 18+ that ever had anal sex with a man (%)
Sexual Behavior - Females 18+ that ever had any kind of sex with a woman (%)
Sexual Behavior - Average age people first had sex
Sexual Behavior - Average number of female sex partners in lifetime (males 18+)
Sexual Behavior - Average number of female vaginal sex partners in lifetime (males 18+)
Sexual Behavior - Average age people first performed oral sex on a woman (18+)
Sexual Behavior - Average number of woman performed oral sex on in lifetime (18+)
Sexual Behavior - Average number of male sex partners in lifetime (males 18+)
Sexual Behavior - Average number of male anal sex partners in lifetime (males 18+)
Sexual Behavior - Average age people first performed oral sex on a man (18+)
Sexual Behavior - Average number of male oral sex partners in lifetime (18+)
Sexual Behavior - People using protection when performing oral sex (%)
Sexual Behavior - Average number of times people have vaginal or anal sex a year
Sexual Behavior - People having sex without condom (%)
Sexual Behavior - Average number of male sex partners in lifetime (females 18+)
Sexual Behavior - Average number of male vaginal sex partners in lifetime (females 18+)
Sexual Behavior - Average number of female sex partners in lifetime (females 18+)
Sexual Behavior - Circumcised males 18+ (%)
Sleep Disorders - Average hours sleeping at night
Sleep Disorders - People that has trouble sleeping (%)
Smoking-Cigarette Use - People smoking cigarettes (%)
Taste & Smell - People 40+ having problems with smell (%)
Taste & Smell - People 40+ having problems with taste (%)
Taste & Smell - People 40+ that ever had wisdom teeth removed (%)
Taste & Smell - People 40+ that ever had tonsils teeth removed (%)
Taste & Smell - People 40+ that ever had a loss of consciousness because of a head injury (%)
Taste & Smell - People 40+ that ever had a broken nose or other serious injury to face or skull (%)
Taste & Smell - People 40+ that ever had two or more sinus infections (%)
Weight - Average height (inches)
Weight - Average weight (pounds)
Weight - Average BMI
Weight - People that are obese (%)
Weight - People that ever were obese (%)
Weight - People trying to lose weight (%)
Urban population: 32,084
Rural population: 18,749
Estimated median house/condo value in 2022: $87,711
78586:
$87,711Texas:
$275,400
According to our research of Texas and other state lists, there were 123 registered sex offenders living in 78586 zip code as of June 10, 2024 . The ratio of all residents to sex offenders in zip code 78586 is 464 to 1.The ratio of registered sex offenders to all residents in this zip code is near the state average.
Median resident age: This zip code:
30.5 yearsTexas median age:
35.6 years
Average household size: This zip code:
3.3 peopleTexas:
2.6 people
Averages for the 2020 tax year for zip code 78586, filed in 2021:
Average Adjusted Gross Income (AGI) in 2020: $35,087 (Individual Income Tax Returns) Here:
$35,087State:
$77,054
Salary/wage: $32,488 (reported on 85.2% of returns )Here:
$32,488State:
$62,766
(% of AGI for various income ranges: 1194.1% for AGIs below $25k , 3369.2% for AGIs $25k-50k , 6276.0% for AGIs $50k-75k , 9033.6% for AGIs $75k-100k , 16248.0% for AGIs $100k-200k , 54010.0% for AGIs over 200k ) Taxable interest for individuals: $1,315 (reported on 8.5% of returns )This zip code:
$1,315Texas:
$2,665
(% of AGI for various income ranges: 3.8% for AGIs below $25k , 6.8% for AGIs $25k-50k , 24.6% for AGIs $50k-75k , 38.0% for AGIs $75k-100k , 79.0% for AGIs $100k-200k , 1117.5% for AGIs over 200k ) Ordinary dividends: $4,425 (reported on 2.7% of returns )(% of AGI for various income ranges: 2.0% for AGIs below $25k , 4.6% for AGIs $25k-50k , 14.2% for AGIs $50k-75k , 26.1% for AGIs $75k-100k , 120.3% for AGIs $100k-200k , 2190.0% for AGIs over 200k ) Net capital gain/loss in AGI: +$9,213 (reported on 3.3% of returns )Here:
+$9,213State:
+$39,590
(% of AGI for various income ranges: 3.2% for AGIs below $25k , 5.9% for AGIs $25k-50k , 18.3% for AGIs $50k-75k , 82.3% for AGIs $75k-100k , 307.5% for AGIs $100k-200k , 7375.0% for AGIs over 200k ) Profit/loss from business: +$7,138 (reported on 20.0% of returns )Here:
+$7,138State:
+$10,888
(% of AGI for various income ranges: 196.6% for AGIs below $25k , 74.9% for AGIs $25k-50k , 76.3% for AGIs $50k-75k , 141.1% for AGIs $75k-100k , 414.1% for AGIs $100k-200k , 9047.5% for AGIs over 200k ) Taxable individual retirement arrangement distribution: $13,778 (reported on 2.6% of returns )78586:
$13,778Texas:
$24,740
(% of AGI for various income ranges: 9.9% for AGIs below $25k , 27.1% for AGIs $25k-50k , 55.9% for AGIs $50k-75k , 197.6% for AGIs $75k-100k , 435.9% for AGIs $100k-200k ) Total itemized deductions: $33,243 (reported on 1.4% of returns )Here:
$33,243State:
$40,428
(% of AGI for various income ranges: 5.5% for AGIs below $25k , 39.2% for AGIs $25k-50k , 130.9% for AGIs $50k-75k , 210.0% for AGIs $75k-100k , 395.1% for AGIs $100k-200k , 2747.5% for AGIs over 200k ) Charity contributions: $8,957 (reported on 1.0% of returns )(% of AGI for various income ranges: 4.2% for AGIs $25k-50k , 21.4% for AGIs $50k-75k , 21.9% for AGIs $75k-100k , 100.5% for AGIs $100k-200k , 1250.0% for AGIs over 200k ) Taxes paid: $6,100 (reported on 1.3% of returns )(% of AGI for various income ranges: 5.8% for AGIs $25k-50k , 18.0% for AGIs $50k-75k , 36.4% for AGIs $75k-100k , 84.3% for AGIs $100k-200k , 592.5% for AGIs over 200k ) Earned income credit: $3,108 (reported on 40.2% of returns )(% of AGI for various income ranges: 211.6% for AGIs below $25k , 139.5% for AGIs $25k-50k , 3.5% for AGIs $50k-75k ) Percentage of individuals using paid preparers for their 2020 taxes: 92.1%(% for various income ranges: 91.1% for AGIs below $25k , 93.6% for AGIs $25k-50k , 92.9% for AGIs $50k-75k , 91.8% for AGIs $75k-100k , 91.6% for AGIs $100k-200k , 100.0% for AGIs over 200k )
Averages for the 2012 tax year for zip code 78586, filed in 2013:
Average Adjusted Gross Income (AGI) in 2012: $30,021 (Individual Income Tax Returns) Here:
$30,021State:
$65,384
Salary/wage: $27,578 (reported on 87.2% of returns )Here:
$27,578State:
$52,524
(% of AGI for various income ranges: 78.0% for AGIs below $25k , 86.8% for AGIs $25k-50k , 84.5% for AGIs $50k-75k , 83.3% for AGIs $75k-100k , 77.2% for AGIs $100k-200k , 41.9% for AGIs over 200k ) Taxable interest for individuals: $1,546 (reported on 9.7% of returns )This zip code:
$1,546Texas:
$2,372
(% of AGI for various income ranges: 0.3% for AGIs below $25k , 0.2% for AGIs $25k-50k , 0.5% for AGIs $50k-75k , 0.6% for AGIs $75k-100k , 0.4% for AGIs $100k-200k , 3.1% for AGIs over 200k ) Ordinary dividends: $3,747 (reported on 3.0% of returns )(% of AGI for various income ranges: 0.1% for AGIs below $25k , 0.2% for AGIs $25k-50k , 0.4% for AGIs $50k-75k , 0.4% for AGIs $75k-100k , 0.8% for AGIs $100k-200k , 1.6% for AGIs over 200k ) Net capital gain/loss in AGI: +$12,365 (reported on 2.7% of returns )Here:
+$12,365State:
+$35,319
(% of AGI for various income ranges: 0.3% for AGIs $50k-75k , 0.2% for AGIs $75k-100k , 2.0% for AGIs $100k-200k , 14.4% for AGIs over 200k ) Profit/loss from business: +$8,891 (reported on 19.5% of returns )Here:
+$8,891State:
+$13,732
(% of AGI for various income ranges: 14.3% for AGIs below $25k , 2.3% for AGIs $25k-50k , 1.5% for AGIs $50k-75k , 1.6% for AGIs $75k-100k , 2.8% for AGIs $100k-200k , 8.1% for AGIs over 200k ) Taxable individual retirement arrangement distribution: $11,851 (reported on 3.4% of returns )78586:
$11,851Texas:
$19,511
(% of AGI for various income ranges: 0.7% for AGIs below $25k , 1.0% for AGIs $25k-50k , 2.0% for AGIs $50k-75k , 1.6% for AGIs $75k-100k , 3.0% for AGIs $100k-200k ) Self-employment retirement plans: $8,467 (reported on 0.2% of returns )78586:
$8,467Texas:
$23,938
Total itemized deductions: $19,565 (25% of AGI, reported on 8.8% of returns )Here:
$19,565State:
$24,724
Here:
25.2% of AGIState:
15.9% of AGI
(% of AGI for various income ranges: 1.3% for AGIs below $25k , 5.4% for AGIs $25k-50k , 8.4% for AGIs $50k-75k , 9.5% for AGIs $75k-100k , 9.3% for AGIs $100k-200k , 5.8% for AGIs over 200k ) Charity contributions: $3,688 (reported on 6.0% of returns )(% of AGI for various income ranges: 0.5% for AGIs $25k-50k , 0.9% for AGIs $50k-75k , 1.1% for AGIs $75k-100k , 1.9% for AGIs $100k-200k , 1.5% for AGIs over 200k ) Taxes paid: $4,165 (reported on 8.1% of returns )(% of AGI for various income ranges: 0.3% for AGIs below $25k , 0.8% for AGIs $25k-50k , 1.4% for AGIs $50k-75k , 1.9% for AGIs $75k-100k , 2.3% for AGIs $100k-200k , 2.1% for AGIs over 200k ) Earned income credit: $3,127 (reported on 48.9% of returns )(% of AGI for various income ranges: 15.5% for AGIs below $25k , 3.0% for AGIs $25k-50k ) Percentage of individuals using paid preparers for their 2012 taxes: 63.2%(% for various income ranges: 63.1% for AGIs below $25k , 61.7% for AGIs $25k-50k , 63.8% for AGIs $50k-75k , 65.3% for AGIs $75k-100k , 69.6% for AGIs $100k-200k , 100.0% for AGIs over 200k )
Averages for the 2004 tax year for zip code 78586, filed in 2005:
Average Adjusted Gross Income (AGI) in 2004: $24,274 (Individual Income Tax Returns) Here:
$24,274State:
$47,881
Salary/wage: $22,283 (reported on 87.9% of returns )Here:
$22,283State:
$41,947
(% of AGI for various income ranges: 87.6% for AGIs below $10k , 84.1% for AGIs $10k-25k , 87.5% for AGIs $25k-50k , 82.2% for AGIs $50k-75k , 77.8% for AGIs $75k-100k , 56.1% for AGIs over 100k ) Taxable interest for individuals: $1,815 (reported on 13.6% of returns )This zip code:
$1,815Texas:
$2,255
(% of AGI for various income ranges: 1.2% for AGIs below $10k , 0.6% for AGIs $10k-25k , 0.6% for AGIs $25k-50k , 1.1% for AGIs $50k-75k , 1.6% for AGIs $75k-100k , 2.2% for AGIs over 100k ) Taxable dividends: $3,299 (reported on 4.8% of returns )(% of AGI for various income ranges: 0.4% for AGIs below $10k , 0.3% for AGIs $10k-25k , 0.4% for AGIs $25k-50k , 0.5% for AGIs $50k-75k , 0.8% for AGIs $75k-100k , 2.2% for AGIs over 100k ) Net capital gain/loss: +$8,265 (reported on 4.0% of returns )Here:
+$8,265State:
+$16,110
(% of AGI for various income ranges: -0.1% for AGIs below $10k , 0.1% for AGIs $10k-25k , 0.2% for AGIs $25k-50k , 1.2% for AGIs $50k-75k , 1.6% for AGIs $75k-100k , 7.4% for AGIs over 100k ) Profit/loss from business: +$7,962 (reported on 16.9% of returns )Here:
+$7,962State:
+$11,013
(% of AGI for various income ranges: 18.2% for AGIs below $10k , 7.7% for AGIs $10k-25k , 1.9% for AGIs $25k-50k , 2.2% for AGIs $50k-75k , 4.3% for AGIs $75k-100k , 8.1% for AGIs over 100k ) IRA payment deduction: $2,836 (reported on 0.7% of returns )(% of AGI for various income ranges: 0.0% for AGIs $10k-25k , 0.1% for AGIs $25k-50k , 0.1% for AGIs $50k-75k , 0.1% for AGIs $75k-100k , 0.2% for AGIs over 100k ) Self-employed pension: $10,143 (reported on 0.1% of returns )Here:
$10,143Texas:
$16,401
Total itemized deductions: $16,736 (23% of AGI, reported on 6.9% of returns )Here:
$16,736State:
$19,631
Here:
23.2% of AGIState:
18.9% of AGI
(% of AGI for various income ranges: 1.1% for AGIs below $10k , 1.3% for AGIs $10k-25k , 5.1% for AGIs $25k-50k , 7.7% for AGIs $50k-75k , 9.4% for AGIs $75k-100k , 6.6% for AGIs over 100k ) Charity contributions deductions: $3,274 (4% of AGI, reported on 5.4% of returns )Here:
4.2% of AGIState:
4.2% of AGI
(% of AGI for various income ranges: 0.1% for AGIs below $10k , 0.1% for AGIs $10k-25k , 0.6% for AGIs $25k-50k , 1.0% for AGIs $50k-75k , 1.5% for AGIs $75k-100k , 1.8% for AGIs over 100k ) Total tax: $3,316 (reported on 51.3% of returns )(% of AGI for various income ranges: 3.6% for AGIs below $10k , 2.5% for AGIs $10k-25k , 4.8% for AGIs $25k-50k , 8.3% for AGIs $50k-75k , 10.6% for AGIs $75k-100k , 19.3% for AGIs over 100k ) Earned income credit: $2,455 (reported on 51.5% of returns )Percentage of individuals using paid preparers for their 2004 taxes: 69.1%(% for various income ranges: 65.8% for AGIs below $10k , 73.7% for AGIs $10k-25k , 65.3% for AGIs $25k-50k , 63.2% for AGIs $50k-75k , 64.1% for AGIs $75k-100k , 72.5% for AGIs over 100k )
Estimated median household income in 2022: This zip code:
$42,078Texas:
$72,284
Nearest zip codes: 78567 ,
78575 ,
78552 ,
78550 ,
78520 ,
78535 .
San Benito Zip Code Map
Percentage of family households: This zip code:
55.7%Texas:
50.5%
Percentage of households with unmarried partners: This zip code:
3.8%Texas:
48.7%
Likely homosexual households (counted as self-reported same-sex unmarried-partner households)
Lesbian couples: 0.1% of all households Gay men: 0.0% of all households
Household received Food Stamps/SNAP in the past 12 months: 4,752Household did not receive Food Stamps/SNAP in the past 12 months: 10,911
Women who had a birth in the past 12 months: 364 (185 now married , 175 unmarried) Women who did not have a birth in the past 12 months: 12,199 (5,941 now married , 6,239 unmarried)
Housing units in zip code 78586 with a mortgage: 3,466 (86
second mortgage , 69
both second mortgage and home equity loan )
Houses without a mortgage: 5
Median monthly owner costs for units with a mortgage: $1,155
Median monthly owner costs for units without a mortgage: $396
Residents with income below the poverty level in 2022:
This zip code:
25.7%Whole state:
14.0%
Residents with income below 50% of the poverty level in 2022:
This zip code:
13.6%Whole state:
7.4%
Median number of rooms in houses and condos: Median number of rooms in apartments: Notable locations in this zip code not listed on our city pages
Click to draw/clear zip code borders Notable locations in zip code 78586: (A) , Gloria Ranch (B) , Adams Gardens Pumping Station (C) , Harlingen Pumping Station (D) , San Benito Pumping Station (E) , Wardner Ranch (F) , San Benito Fire Department Station 1 (G) , San Benito Police Department (H) , San Benito Public Library (I) , San Benito Fire Department Station 2 (J) , Promedic Emergency Medical Service (K) , Sunny Glenn Home (L) . Display/hide their locations on the map
Churches in zip code 78586 include: (A) , The Pentecostal Church (B) , Pentecostal Holiness Church (C) , First Church of the Nazarene (D) , La Palma Baptist Church (E) , San Benito Seventh Day Adventist Church (F) . Display/hide their locations on the map
Cemetery: (1) . Display/hide its location on the map
Lakes and reservoirs: (A) , Resaca de las Flores (B) , Cuates Lake (C) , Sweeney Lake (D) , Cross Lake (E) , Adams Gardens Reservoir (F) , Cameron County District Number One Reservoir (G) , Resaca Del Rancho Viejo Reservoir (H) . Display/hide their locations on the map
Parks in zip code 78586 include: (1) , Las Palomas Wildlife Management Area - Ebony Unit (2) , Landrum Park (3) , Las Palomas Wildlife Management Area - Carricitos Unit (4) , Las Palomas Wildlife Management Area - Deshazo (5) , Kenedy Park (6) , Hermosa Park (7) , San Benito City Park (8) , Stokey Park (9) . Display/hide their locations on the map
Year house built (houses)
66 2020 or later2,946 2010 to 20193,761 2000 to 20092,181 1990 to 19992,155 1980 to 19892,490 1970 to 1979897 1960 to 19691,115 1950 to 1959482 1940 to 1949470 1939 or earlier
Zip code 78586 household income distribution in 2022 1,214 Less than $10,000731 $10,000 to $14,9991,478 $15,000 to $19,9991,254 $20,000 to $24,999904 $25,000 to $29,9991,033 $30,000 to $34,999655 $35,000 to $39,9991,217 $40,000 to $44,999432 $45,000 to $49,9991,098 $50,000 to $59,9991,834 $60,000 to $74,9991,448 $75,000 to $99,999718 $100,000 to $124,999662 $125,000 to $149,999416 $150,000 to $199,999437 $200,000 or moreEstimate of home value of owner-occupied houses/condos in 2022 in zip code 78586 332 Less than $10,000148 $10,000 to $14,999224 $15,000 to $19,999177 $20,000 to $24,999750 $25,000 to $29,999281 $30,000 to $34,999413 $35,000 to $39,999868 $40,000 to $49,999721 $50,000 to $59,999932 $60,000 to $69,999655 $70,000 to $79,999490 $80,000 to $89,999402 $90,000 to $99,9991,076 $100,000 to $124,999386 $125,000 to $149,999537 $150,000 to $174,999317 $175,000 to $199,999547 $200,000 to $249,999230 $250,000 to $299,999339 $300,000 to $399,999201 $400,000 to $499,999203 $500,000 to $749,99944 $750,000 to $999,99928 $1,000,000 to $1,499,999Rent paid by renters in 2022 in zip code 78586 25 Less than $100168 $100 to $14934 $150 to $19936 $200 to $249125 $250 to $299140 $300 to $349242 $350 to $399219 $400 to $449105 $450 to $499316 $500 to $549104 $550 to $599379 $600 to $649104 $650 to $699293 $700 to $74974 $750 to $799417 $800 to $899113 $900 to $99947 $1,000 to $1,24916 $1,250 to $1,4992 $1,500 to $1,999503 No cash rent
Median gross rent in 2022: $837.
Median price asked for vacant for-sale houses and condos in 2022: $251,628.
Estimated median house (or condo) value in 2022 for: White Non-Hispanic householders: $161,983Black or African American householders: $89,833American Indian or Alaska Native householders: $112,468Asian householders: $165,048Some other race householders: $86,768Two or more races householders: $79,694Hispanic or Latino householders: $89,833Estimated median house or condo value in 2022: $87,711
78586:
$87,711Texas:
$275,400
Lower value quartile - upper value quartile: $52,760 - $148,369
Mean price in 2022: Detached houses: $129,674Here:
$129,674State:
$369,058
Townhouses or other attached units: $64,934Here:
$64,934State:
$327,631
Mobile homes: $164,978Here:
$164,978State:
$124,413
Occupied boats, RVs, vans, etc.: $786,638Here:
$786,638State:
$73,921
Housing units in structures:
One, detached: 11,949One, attached: 323Two: 843 or 4: 4825 to 9: 35310 to 19: 18320 to 49: 18150 or more: 287Mobile homes: 2,952Boats, RVs, vans, etc.: 64Unemployment : 3.6%
Means of transportation to work in zip code 78586 76.1% 14,822 Drove a car alone9.8% 1,909 Carpooled0.3% 50 Bus or trolley bus0.6% 114 Walked2.4% 470 Other means9.6% 1,862 Worked at homeTravel time to work (commute) in zip code 78586 371 Less than 5 minutes1,869 5 to 9 minutes3,009 10 to 14 minutes3,262 15 to 19 minutes3,714 20 to 24 minutes900 25 to 29 minutes2,297 30 to 34 minutes455 35 to 39 minutes340 40 to 44 minutes696 45 to 59 minutes234 60 to 89 minutes195 90 or more minutes
Percentage of zip code residents living and working in this county: 90.2%
Household type by relationship:
Households: 50,834
Male householders: 7,809 (1,512 living alone ), Female householders: 7,717 (1,404 living alone )8,003 spouses (7,992 opposite-sex spouses ), 650 unmarried partners , (541 opposite-sex unmarried partners ), 19,239 children (18,121 natural , 419 adopted , 698 stepchildren ), 2,642 grandchildren , 896 brothers or sisters , 923 parents , 46 foster children , 1,857 other relatives , 579 non-relatives In group quarters: 222 (-1 institutionalized population )
Size of family households: 4,153 2-persons , 2,644 3-persons , 2,547 4-persons , 1,174 5-persons , 909 6-persons , 820 7-or-more-persons
Size of nonfamily households: 2,916 1-person , 171 2-persons , 20 3-persons , 71 4-persons
8,033 married couples with children. single-parent households (805 men , 3,368 women ).
31.8% of residents of 78586 zip code speak English at home. of residents speak Spanish at home (63% very well, 11% well, 12% not well, 13% not at all ).of residents speak Asian or Pacific Island language at home (100% well ).of residents speak other language at home (100% very well ).
Foreign born population: 11,143 (21.9%)
(38.4%
of them are naturalized citizens )
This zip code:
21.9%Whole state:
17.2%
91% Honduras 1% Costa Rica 1% Mexico 1% Uruguay 1% El Salvador 1% Guatemala 1% Barbados 1% American 1% English 1% German 0% Norwegian 0% Irish 0% Italian 0% Scottish
Year of entry for the foreign-born population
2,063 2010 or later 2,418 2000 to 2009 2,145 1990 to 1999 4,534 Before 1990
Facilities with environmental interests located in this zip code:
AMADOR R RODRIGUEZ JUVENILE BO (240 N CROCKETT ST in SAN BENITO, TX)
(National Center for Education Statistics) - STATE ID-031912005 Organizations: SAN BENITO CONS ISD (SCHOOL DISTRICT)
Housing units lacking complete plumbing facilities: 0.9%
Housing units lacking complete kitchen facilities: 1.6%
90.4% Electricity 6.2% Utility gas 3.0% Bottled, tank, or LP gas
Population in 1990: 28,609. Population change in the 1990s: +17,108 (+59.8%).
Place of birth for U.S.-born residents:
This state: 35,478Northeast: 184Midwest: 1,511South: 1,106West: 601
64% of the 78586 zip code residents lived in the same house 5 years ago.
Out of people who lived in different houses, 76% lived in this county.
Out of people who lived in different counties, 50% lived in Texas.
96% of the 78586 zip code residents lived in the same house 1 year ago.
Out of people who lived in different houses, 73% moved from this county.
Out of people who lived in different houses, 22% moved from different county within same state.
Out of people who lived in different houses, 8% moved from different state.
Private vs. public school enrollment:
Students in private schools in grades 1 to 8 (elementary and middle school): 180
Students in private schools in grades 9 to 12 (high school): 153
Students in private undergraduate colleges: 244
Occupation by median earnings in the past 12 months ($)
189,318 Legal occupations 77,771 Health diagnosing and treating practitioners and other technical occupations 75,759 Architecture and engineering occupations 64,543 Computer and mathematical occupations 58,532 Life, physical, and social science occupations 51,601 Fire fighting and prevention, and other protective service workers including supervisors
Companies with federal contracts located in this zip code:
ROBINSON, JAMES (1400 ZILLOCK RD C145 in SAN BENITO, TX; small business) in 8 contracts from 2004 to 2005
Contracts for Other Administrative Support Services by U.S. Army Corps of Engineers - civil program financing only, ArmySigned by year: 2000: $0; 2001: $0; 2002: $0; 2003: $0; 2004: $14,000; 2005: $9,428; 2006: $0.
Biggest contracts: with U.S. Army Corps of Engineers - civil program financing only for Other Administrative Support Services. Taking place in OK. Signed on 2005-02-24. Completion date: 2004-03-03.
with Army for Other Administrative Support Services. Taking place in OK. Signed on 2005-02-24. Completion date: 2004-03-03.
, same as above. Signed on 2004-03-23. Completion date: 2004-03-03.
with U.S. Army Corps of Engineers - civil program financing only for Other Administrative Support Services. Taking place in OK. Signed on 2004-03-23. Completion date: 2004-03-03.
JAMES D MCELROY, SR (1400 ZILLOCK RD , in SAN BENITO, TX; small business)
$3,630 with U.S. Army Corps of Engineers - civil program financing only for Facilities Operations Support Services. Taking place in CT. Signed on 2002-01-23. Completion date: 2002-09-09.
GULF MOVING SYSTEMS INC (101 S BOWIE ST in SAN BENITO, TX; small business) in 8 contracts from 2004 to 2005
Contracts for Packing/Crating Services by NavySigned by year: 2000: $0; 2001: $0; 2002: $0; 2003: $0; 2004: $2,801; 2005: $717; 2006: $0.
Biggest contracts: with Navy for Packing/Crating Services. Signed on 2004-03-23. Completion date: 2004-03-25.
, same as above. Signed on 2004-08-31. Completion date: 2004-09-03.
, same as above. Signed on 2004-07-30. Completion date: 2004-08-03.
, same as above. Signed on 2004-04-23. Completion date: 2004-05-03.
Top industries in this zip code by the number of employees in 2005:
Accommodation and Food Services: Limited-Service Restaurants (50-99 employees: 1 establishment, 20-49 employees: 5 establishments, 10-19 employees: 6 establishments, 5-9 employees: 1 establishment, 1-4 employees: 1 establishment)Construction: Highway, Street, and Bridge Construction (100-249: 1, 50-99: 1, 20-49: 1)Health Care and Social Assistance: Child Day Care Services (50-99: 1, 20-49: 2, 10-19: 3, 5-9: 3, 1-4: 4)Wholesale Trade: Other Grocery and Related Products Merchant Wholesalers (100-249: 1, 5-9: 1)Administrative and Support and Waste Management and Remediation Services: Janitorial Services (100-249: 1, 1-4: 1)Administrative and Support and Waste Management and Remediation Services: All Other Business Support Services (100-249: 1)Professional, Scientific, and Technical Services: Other Services Related to Advertising (100-249: 1)Accommodation and Food Services: Full-Service Restaurants (20-49: 3, 10-19: 2, 5-9: 3, 1-4: 6)
People in group quarters in 2010:
53 people in nursing facilities/skilled-nursing facilities
13 people in emergency and transitional shelters (with sleeping facilities) for people experiencing homelessness
7 people in group homes intended for adults
4 people in other noninstitutional facilities
People in group quarters in 2000:
60 people in nursing homes
56 people in other noninstitutional group quarters
35 people in short-term care, detention or diagnostic centers for delinquent children
12 people in religious group quarters
Fatal accident statistics in 2014:
Fatal accident count: 6Vehicles involved in fatal accidents: 8Fatal accidents caused by drunken drivers: 3Fatalities: 6Persons involved in fatal accidents: 12Pedestrians involved in fatal accidents: 1
Fatal accident statistics in 2013:
Fatal accident count: 8Vehicles involved in fatal accidents: 12Fatal accidents caused by drunken drivers: 3Fatalities: 11Persons involved in fatal accidents: 22Pedestrians involved in fatal accidents: 0
Home Mortgage Disclosure Act Aggregated Statistics For Year 2009(Based on 4 full and 14 partial tracts) A) FHA, FSA/RHS & VA B) Conventional C) Refinancings D) Home Improvement Loans E) Loans on Dwellings For 5+ Families F) Non-occupant Loans on G) Loans On Manufactured Number Average Value Number Average Value Number Average Value Number Average Value Number Average Value Number Average Value Number Average Value
LOANS ORIGINATED 145 $103,194 87 $143,021 269 $133,177 86 $26,965 2 $4,972,825 30 $87,576 11 $56,461 APPLICATIONS APPROVED, NOT ACCEPTED 14 $92,375 9 $116,633 64 $112,109 21 $28,206 0 $0 3 $124,977 3 $19,447 APPLICATIONS DENIED 24 $124,227 43 $97,507 330 $98,493 357 $20,164 1 $539,900 35 $29,352 38 $47,306 APPLICATIONS WITHDRAWN 14 $151,071 16 $105,527 131 $114,184 22 $29,760 0 $0 8 $64,592 1 $10,000 FILES CLOSED FOR INCOMPLETENESS 1 $41,200 2 $209,135 38 $117,324 16 $41,248 0 $0 6 $60,278 0 $0
Aggregated Statistics For Year 2008(Based on 4 full and 14 partial tracts) A) FHA, FSA/RHS & VA B) Conventional C) Refinancings D) Home Improvement Loans E) Loans on Dwellings For 5+ Families F) Non-occupant Loans on G) Loans On Manufactured Number Average Value Number Average Value Number Average Value Number Average Value Number Average Value Number Average Value Number Average Value
LOANS ORIGINATED 137 $101,394 185 $105,756 253 $99,904 156 $20,642 1 $90,470 45 $82,803 25 $22,866 APPLICATIONS APPROVED, NOT ACCEPTED 22 $105,254 36 $90,976 93 $74,992 39 $24,714 0 $0 10 $113,144 14 $62,071 APPLICATIONS DENIED 41 $86,205 81 $76,770 476 $89,045 653 $21,399 0 $0 49 $46,528 44 $33,164 APPLICATIONS WITHDRAWN 11 $127,064 34 $98,471 137 $92,832 62 $44,133 0 $0 15 $59,099 4 $39,165 FILES CLOSED FOR INCOMPLETENESS 11 $90,590 5 $85,766 32 $94,883 15 $78,823 0 $0 1 $62,000 1 $106,990
Aggregated Statistics For Year 2007(Based on 4 full and 14 partial tracts) A) FHA, FSA/RHS & VA B) Conventional C) Refinancings D) Home Improvement Loans E) Loans on Dwellings For 5+ Families F) Non-occupant Loans on G) Loans On Manufactured Number Average Value Number Average Value Number Average Value Number Average Value Number Average Value Number Average Value Number Average Value
LOANS ORIGINATED 112 $99,250 470 $101,467 449 $100,338 227 $32,500 3 $921,483 93 $86,390 43 $32,567 APPLICATIONS APPROVED, NOT ACCEPTED 6 $108,265 83 $83,681 135 $86,229 55 $34,623 0 $0 20 $69,382 7 $37,230 APPLICATIONS DENIED 34 $86,126 205 $86,389 711 $93,258 511 $23,168 0 $0 83 $63,135 83 $28,700 APPLICATIONS WITHDRAWN 7 $118,513 58 $107,311 242 $97,598 96 $34,109 0 $0 16 $76,577 9 $37,368 FILES CLOSED FOR INCOMPLETENESS 1 $78,020 23 $105,508 79 $108,849 14 $45,693 0 $0 8 $100,110 0 $0
Aggregated Statistics For Year 2006(Based on 4 full and 14 partial tracts) A) FHA, FSA/RHS & VA B) Conventional C) Refinancings D) Home Improvement Loans E) Loans on Dwellings For 5+ Families F) Non-occupant Loans on G) Loans On Manufactured Number Average Value Number Average Value Number Average Value Number Average Value Number Average Value Number Average Value Number Average Value
LOANS ORIGINATED 106 $94,716 578 $85,829 479 $98,872 214 $28,500 10 $410,567 122 $84,147 46 $30,151 APPLICATIONS APPROVED, NOT ACCEPTED 18 $60,740 189 $82,299 174 $81,079 50 $33,999 0 $0 28 $74,581 20 $33,371 APPLICATIONS DENIED 19 $80,771 244 $79,906 686 $80,181 493 $24,728 0 $0 82 $62,505 79 $25,706 APPLICATIONS WITHDRAWN 7 $70,831 99 $82,659 391 $95,191 55 $43,269 1 $371,000 35 $58,977 16 $33,707 FILES CLOSED FOR INCOMPLETENESS 4 $81,650 12 $90,852 101 $113,394 3 $36,907 0 $0 7 $76,363 0 $0
Aggregated Statistics For Year 2005(Based on 4 full and 14 partial tracts) A) FHA, FSA/RHS & VA B) Conventional C) Refinancings D) Home Improvement Loans E) Loans on Dwellings For 5+ Families F) Non-occupant Loans on G) Loans On Manufactured Number Average Value Number Average Value Number Average Value Number Average Value Number Average Value Number Average Value Number Average Value
LOANS ORIGINATED 90 $87,038 523 $75,672 568 $86,013 162 $47,292 3 $187,033 105 $66,726 70 $23,723 APPLICATIONS APPROVED, NOT ACCEPTED 10 $83,143 161 $64,811 175 $68,304 52 $34,869 0 $0 18 $82,820 34 $34,792 APPLICATIONS DENIED 19 $84,351 243 $73,182 802 $73,334 388 $20,902 2 $249,450 82 $72,905 76 $24,576 APPLICATIONS WITHDRAWN 6 $78,472 101 $104,007 311 $104,935 116 $102,093 2 $778,285 25 $93,286 0 $0 FILES CLOSED FOR INCOMPLETENESS 1 $87,000 16 $72,746 122 $108,143 5 $41,520 0 $0 3 $87,303 0 $0
Aggregated Statistics For Year 2004(Based on 4 full and 14 partial tracts) A) FHA, FSA/RHS & VA B) Conventional C) Refinancings D) Home Improvement Loans E) Loans on Dwellings For 5+ Families F) Non-occupant Loans on G) Loans On Manufactured Number Average Value Number Average Value Number Average Value Number Average Value Number Average Value Number Average Value Number Average Value
LOANS ORIGINATED 129 $77,024 486 $83,638 566 $83,002 178 $27,107 7 $280,264 105 $64,160 99 $24,098 APPLICATIONS APPROVED, NOT ACCEPTED 8 $61,904 101 $60,856 168 $77,666 33 $27,846 0 $0 16 $79,896 53 $31,557 APPLICATIONS DENIED 32 $68,228 203 $53,929 736 $71,530 376 $20,162 0 $0 48 $47,777 115 $26,775 APPLICATIONS WITHDRAWN 19 $59,615 68 $83,886 355 $85,374 35 $39,326 0 $0 19 $38,133 7 $25,099 FILES CLOSED FOR INCOMPLETENESS 3 $58,357 17 $76,616 107 $97,371 8 $41,684 0 $0 0 $0 0 $0
Aggregated Statistics For Year 2003(Based on 4 full and 14 partial tracts) A) FHA, FSA/RHS & VA B) Conventional C) Refinancings D) Home Improvement Loans E) Loans on Dwellings For 5+ Families F) Non-occupant Loans on Number Average Value Number Average Value Number Average Value Number Average Value Number Average Value Number Average Value
LOANS ORIGINATED 159 $76,897 382 $75,664 787 $92,940 122 $15,926 0 $0 86 $45,036 APPLICATIONS APPROVED, NOT ACCEPTED 8 $89,771 78 $76,416 141 $61,977 21 $25,411 0 $0 18 $69,774 APPLICATIONS DENIED 42 $70,627 188 $57,655 706 $71,312 223 $14,660 2 $69,845 54 $55,227 APPLICATIONS WITHDRAWN 13 $72,105 66 $79,472 341 $70,268 29 $21,426 0 $0 18 $63,119 FILES CLOSED FOR INCOMPLETENESS 6 $66,625 12 $90,836 34 $148,129 3 $49,523 0 $0 0 $0
Aggregated Statistics For Year 2002(Based on 4 full and 8 partial tracts) A) FHA, FSA/RHS & VA B) Conventional C) Refinancings D) Home Improvement Loans E) Loans on Dwellings For 5+ Families F) Non-occupant Loans on Number Average Value Number Average Value Number Average Value Number Average Value Number Average Value Number Average Value
LOANS ORIGINATED 121 $73,549 330 $77,241 477 $83,354 108 $18,658 2 $1,313,105 64 $55,838 APPLICATIONS APPROVED, NOT ACCEPTED 7 $71,096 63 $52,557 94 $65,403 26 $16,539 0 $0 7 $39,781 APPLICATIONS DENIED 12 $64,887 168 $48,061 352 $54,368 251 $11,503 0 $0 30 $43,250 APPLICATIONS WITHDRAWN 5 $78,154 45 $56,971 145 $61,081 18 $14,233 0 $0 3 $28,003 FILES CLOSED FOR INCOMPLETENESS 6 $69,000 14 $55,824 50 $74,288 4 $17,158 0 $0 0 $0
Aggregated Statistics For Year 2001(Based on 4 full and 8 partial tracts) A) FHA, FSA/RHS & VA B) Conventional C) Refinancings D) Home Improvement Loans E) Loans on Dwellings For 5+ Families F) Non-occupant Loans on Number Average Value Number Average Value Number Average Value Number Average Value Number Average Value Number Average Value
LOANS ORIGINATED 110 $72,403 302 $67,998 414 $72,485 122 $13,960 4 $337,258 58 $67,901 APPLICATIONS APPROVED, NOT ACCEPTED 10 $68,097 61 $43,131 74 $63,859 15 $13,773 0 $0 12 $23,206 APPLICATIONS DENIED 13 $76,290 200 $45,428 363 $52,807 210 $10,540 0 $0 33 $32,019 APPLICATIONS WITHDRAWN 17 $74,702 70 $49,615 157 $66,334 18 $6,591 0 $0 14 $90,705 FILES CLOSED FOR INCOMPLETENESS 0 $0 7 $88,317 34 $58,421 4 $21,728 0 $0 4 $43,895
Aggregated Statistics For Year 2000(Based on 4 full and 8 partial tracts) A) FHA, FSA/RHS & VA B) Conventional C) Refinancings D) Home Improvement Loans E) Loans on Dwellings For 5+ Families F) Non-occupant Loans on Number Average Value Number Average Value Number Average Value Number Average Value Number Average Value Number Average Value
LOANS ORIGINATED 75 $76,228 413 $55,323 208 $66,623 117 $13,806 3 $187,093 53 $42,409 APPLICATIONS APPROVED, NOT ACCEPTED 12 $62,139 104 $51,437 71 $55,855 22 $16,050 0 $0 8 $49,709 APPLICATIONS DENIED 27 $50,594 385 $42,088 142 $61,649 166 $9,926 0 $0 37 $33,408 APPLICATIONS WITHDRAWN 11 $59,664 42 $69,119 75 $54,927 19 $34,007 1 $273,170 9 $60,731 FILES CLOSED FOR INCOMPLETENESS 0 $0 4 $29,112 28 $62,630 0 $0 0 $0 3 $55,573
Aggregated Statistics For Year 1999(Based on 3 full and 7 partial tracts) A) FHA, FSA/RHS & VA B) Conventional C) Refinancings D) Home Improvement Loans F) Non-occupant Loans on Number Average Value Number Average Value Number Average Value Number Average Value Number Average Value
LOANS ORIGINATED 59 $68,351 255 $60,664 221 $66,004 127 $11,868 48 $37,943 APPLICATIONS APPROVED, NOT ACCEPTED 1 $22,000 69 $45,369 61 $54,737 18 $14,207 9 $75,511 APPLICATIONS DENIED 7 $66,840 329 $37,516 105 $47,657 134 $6,687 31 $49,264 APPLICATIONS WITHDRAWN 5 $72,654 31 $67,811 84 $58,419 9 $29,654 12 $42,052 FILES CLOSED FOR INCOMPLETENESS 0 $0 2 $49,645 25 $52,340 2 $15,870 0 $0
Private Mortgage Insurance Companies Aggregated Statistics For Year 2009(Based on 4 full and 12 partial tracts) A) Conventional B) Refinancings C) Non-occupant Loans on Number Average Value Number Average Value Number Average Value
LOANS ORIGINATED 18 $176,758 13 $144,614 2 $99,485 APPLICATIONS APPROVED, NOT ACCEPTED 3 $158,637 4 $131,615 0 $0 APPLICATIONS DENIED 14 $122,041 11 $235,754 4 $109,432 APPLICATIONS WITHDRAWN 4 $129,782 1 $84,230 2 $117,570 FILES CLOSED FOR INCOMPLETENESS 0 $0 0 $0 0 $0
Aggregated Statistics For Year 2008(Based on 4 full and 12 partial tracts) A) Conventional B) Refinancings C) Non-occupant Loans on Number Average Value Number Average Value Number Average Value
LOANS ORIGINATED 87 $108,664 22 $127,198 6 $122,068 APPLICATIONS APPROVED, NOT ACCEPTED 41 $112,149 20 $175,894 1 $328,320 APPLICATIONS DENIED 8 $151,144 7 $101,510 5 $57,876 APPLICATIONS WITHDRAWN 3 $223,933 2 $90,160 0 $0 FILES CLOSED FOR INCOMPLETENESS 0 $0 0 $0 0 $0
Aggregated Statistics For Year 2007(Based on 4 full and 14 partial tracts) A) Conventional B) Refinancings C) Non-occupant Loans on Number Average Value Number Average Value Number Average Value
LOANS ORIGINATED 144 $110,832 41 $160,933 12 $53,105 APPLICATIONS APPROVED, NOT ACCEPTED 20 $119,891 3 $114,157 0 $0 APPLICATIONS DENIED 2 $50,195 0 $0 2 $50,195 APPLICATIONS WITHDRAWN 8 $91,178 3 $206,137 0 $0 FILES CLOSED FOR INCOMPLETENESS 0 $0 0 $0 0 $0
Aggregated Statistics For Year 2006(Based on 4 full and 14 partial tracts) A) Conventional B) Refinancings C) Non-occupant Loans on D) Loans On Manufactured Number Average Value Number Average Value Number Average Value Number Average Value
LOANS ORIGINATED 98 $109,545 41 $142,347 7 $70,449 2 $54,265 APPLICATIONS APPROVED, NOT ACCEPTED 23 $93,931 10 $89,870 4 $83,942 0 $0 APPLICATIONS DENIED 0 $0 0 $0 0 $0 0 $0 APPLICATIONS WITHDRAWN 2 $60,155 0 $0 0 $0 0 $0 FILES CLOSED FOR INCOMPLETENESS 1 $108,710 0 $0 0 $0 0 $0
Aggregated Statistics For Year 2005(Based on 4 full and 14 partial tracts) A) Conventional B) Refinancings C) Non-occupant Loans on D) Loans On Manufactured Number Average Value Number Average Value Number Average Value Number Average Value
LOANS ORIGINATED 71 $96,464 42 $126,440 10 $72,272 1 $70,570 APPLICATIONS APPROVED, NOT ACCEPTED 25 $124,845 5 $154,314 1 $65,000 0 $0 APPLICATIONS DENIED 0 $0 0 $0 0 $0 0 $0 APPLICATIONS WITHDRAWN 3 $217,083 4 $122,538 1 $64,200 0 $0 FILES CLOSED FOR INCOMPLETENESS 2 $26,940 0 $0 0 $0 0 $0
Aggregated Statistics For Year 2004(Based on 4 full and 12 partial tracts) A) Conventional B) Refinancings C) Non-occupant Loans on D) Loans On Manufactured Number Average Value Number Average Value Number Average Value Number Average Value
LOANS ORIGINATED 102 $91,072 41 $105,396 16 $61,865 1 $39,450 APPLICATIONS APPROVED, NOT ACCEPTED 20 $101,848 12 $112,652 5 $119,252 0 $0 APPLICATIONS DENIED 3 $215,163 3 $114,657 0 $0 0 $0 APPLICATIONS WITHDRAWN 7 $140,319 5 $138,318 2 $90,350 0 $0 FILES CLOSED FOR INCOMPLETENESS 0 $0 1 $53,000 0 $0 0 $0
Aggregated Statistics For Year 2003(Based on 4 full and 14 partial tracts) A) Conventional B) Refinancings C) Non-occupant Loans on Number Average Value Number Average Value Number Average Value
LOANS ORIGINATED 82 $87,008 81 $116,331 8 $57,348 APPLICATIONS APPROVED, NOT ACCEPTED 16 $95,218 12 $81,823 1 $62,000 APPLICATIONS DENIED 5 $64,744 0 $0 2 $60,655 APPLICATIONS WITHDRAWN 3 $68,860 0 $0 2 $75,290 FILES CLOSED FOR INCOMPLETENESS 0 $0 0 $0 0 $0
Aggregated Statistics For Year 2002(Based on 4 full and 8 partial tracts) A) Conventional B) Refinancings C) Non-occupant Loans on Number Average Value Number Average Value Number Average Value
LOANS ORIGINATED 100 $98,283 74 $119,952 10 $66,765 APPLICATIONS APPROVED, NOT ACCEPTED 9 $102,287 10 $99,521 2 $68,850 APPLICATIONS DENIED 1 $115,280 0 $0 0 $0 APPLICATIONS WITHDRAWN 1 $98,500 6 $104,100 0 $0 FILES CLOSED FOR INCOMPLETENESS 3 $93,963 2 $121,810 0 $0
Aggregated Statistics For Year 2001(Based on 4 full and 8 partial tracts) A) Conventional B) Refinancings C) Non-occupant Loans on Number Average Value Number Average Value Number Average Value
LOANS ORIGINATED 63 $93,593 47 $105,673 13 $76,648 APPLICATIONS APPROVED, NOT ACCEPTED 14 $93,519 6 $102,793 0 $0 APPLICATIONS DENIED 2 $110,610 2 $33,925 2 $33,925 APPLICATIONS WITHDRAWN 0 $0 1 $207,150 0 $0 FILES CLOSED FOR INCOMPLETENESS 0 $0 1 $59,190 0 $0
Aggregated Statistics For Year 2000(Based on 4 full and 8 partial tracts) A) Conventional B) Refinancings C) Non-occupant Loans on Number Average Value Number Average Value Number Average Value
LOANS ORIGINATED 45 $86,404 51 $81,179 3 $60,753 APPLICATIONS APPROVED, NOT ACCEPTED 6 $100,522 5 $109,392 0 $0 APPLICATIONS DENIED 0 $0 2 $47,895 0 $0 APPLICATIONS WITHDRAWN 0 $0 0 $0 0 $0 FILES CLOSED FOR INCOMPLETENESS 1 $162,000 2 $147,675 0 $0
Aggregated Statistics For Year 1999(Based on 3 full and 7 partial tracts) A) Conventional B) Refinancings C) Non-occupant Loans on Number Average Value Number Average Value Number Average Value
LOANS ORIGINATED 43 $83,702 27 $104,635 3 $25,560 APPLICATIONS APPROVED, NOT ACCEPTED 6 $82,717 6 $78,443 1 $26,010 APPLICATIONS DENIED 2 $83,390 0 $0 0 $0 APPLICATIONS WITHDRAWN 2 $125,895 2 $145,730 0 $0 FILES CLOSED FOR INCOMPLETENESS 0 $0 0 $0 0 $0
2002 - 2018 National Fire Incident Reporting System (NFIRS) incidents See full 2006 National Fire Incident Reporting System statistics for zip code 78586, Texas
Most common first names in zip code 78586 among deceased individuals Name Count Lived (average)
Maria 222 76.9 years Jose 178 70.5 years Guadalupe 140 75.2 years Juan 113 70.8 years John 77 76.1 years Francisco 67 73.0 years Manuel 66 74.0 years William 62 75.4 years Robert 56 71.2 years Antonio 53 71.0 years
Most common last names in zip code 78586 among deceased individuals Last name Count Lived (average)
Garcia 253 74.0 years Rodriguez 172 73.5 years Gonzalez 138 73.2 years Martinez 124 75.3 years Hernandez 123 74.2 years Garza 112 74.3 years Lopez 77 72.6 years Perez 69 76.7 years Trevino 66 74.8 years Sanchez 61 72.2 years
Businesses in zip code 78586
Name Count Name Count
Advance Auto Parts 1 La-Z-Boy 1 AutoZone 2 Lane Furniture 1 Best Western 1 Little Caesars Pizza 1 Burger King 1 McDonald's 3 Chevrolet 1 Payless 1 Church's Chicken 1 Pizza Hut 1 Cricket Wireless 5 RadioShack 1 Domino's Pizza 1 Subway 2 FedEx 1 Super 8 1 GameStop 1 T-Mobile 1 H&R Block 1 U-Haul 2 Honda 1 UPS 2 KFC 1 Walmart 1 Kincaid 1
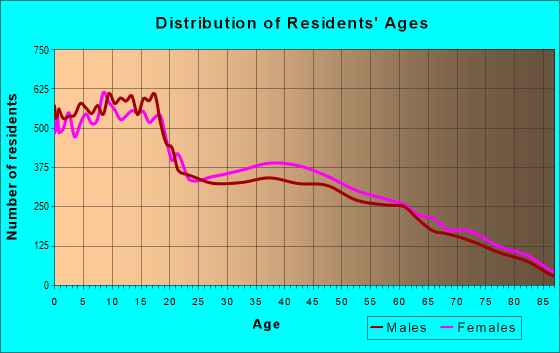
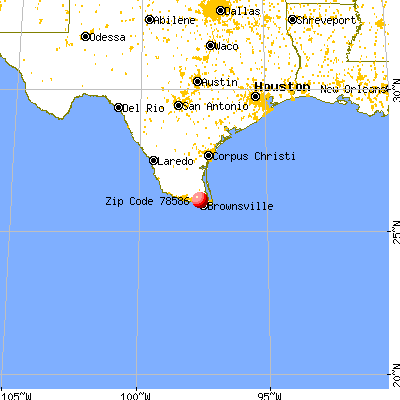


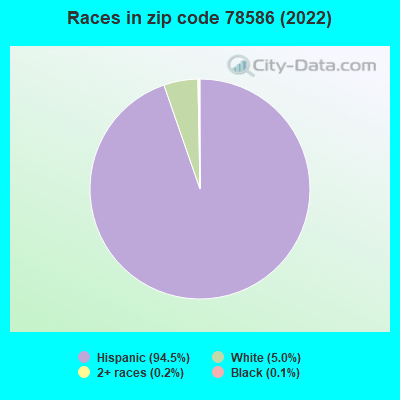


 Nearest zip codes: 78567, 78575, 78552, 78550, 78520, 78535.
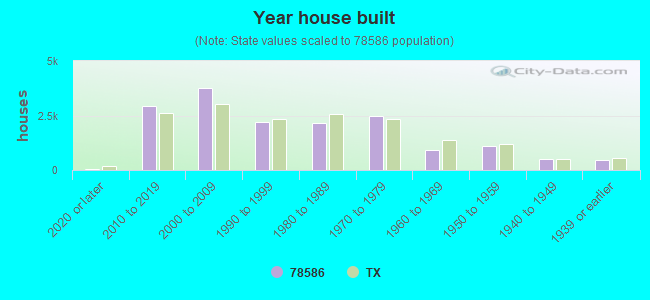
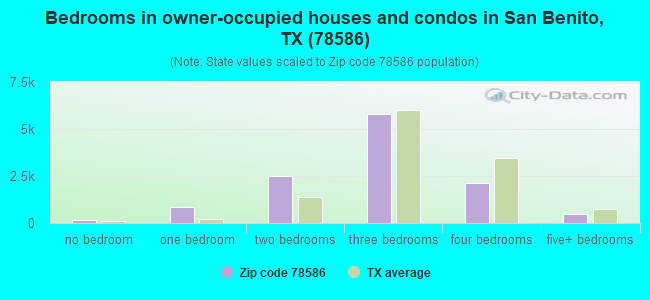
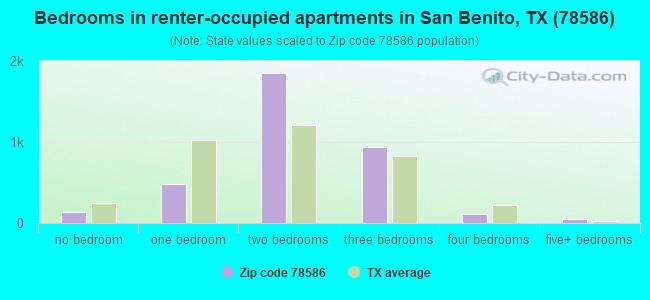
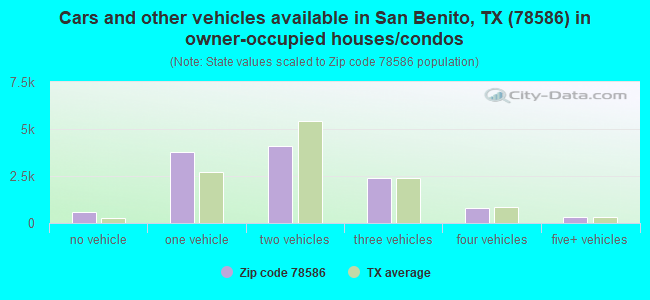
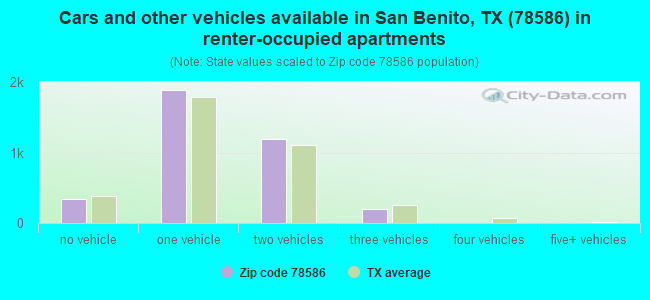


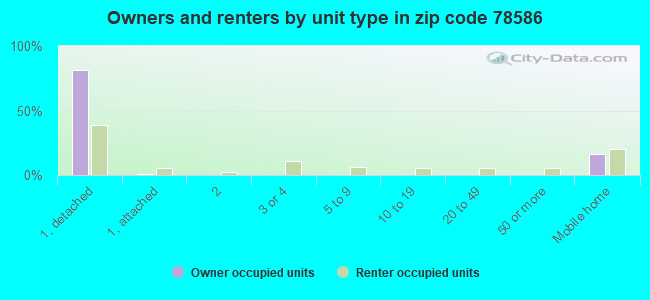


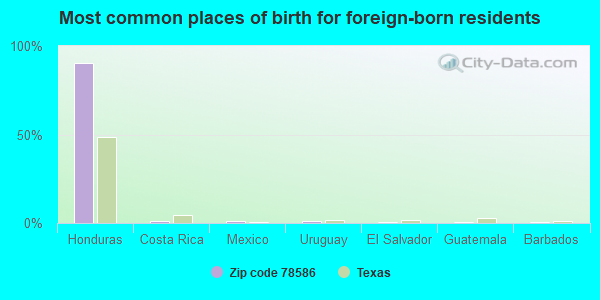
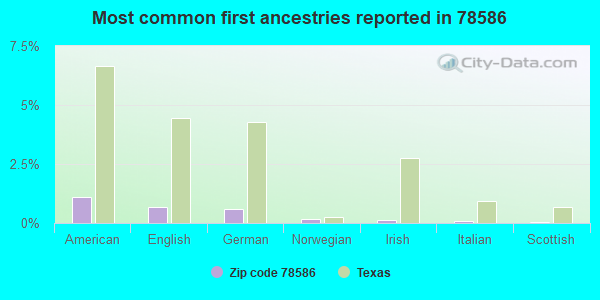
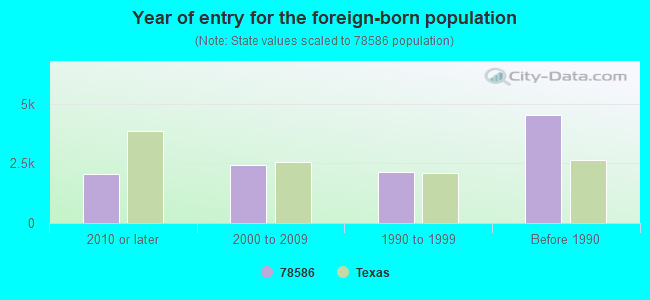


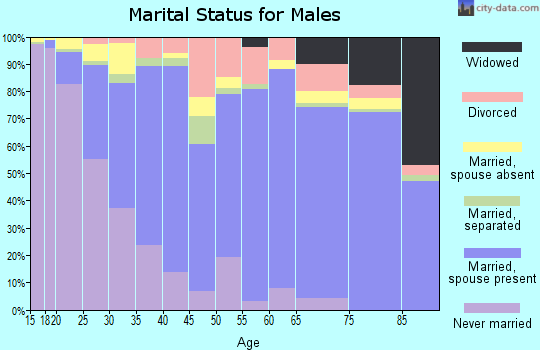
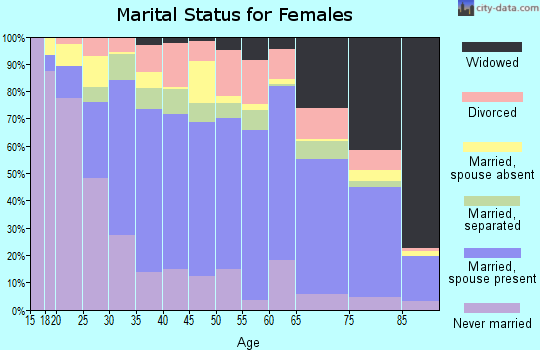
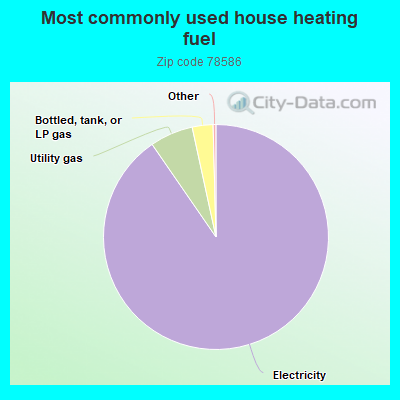
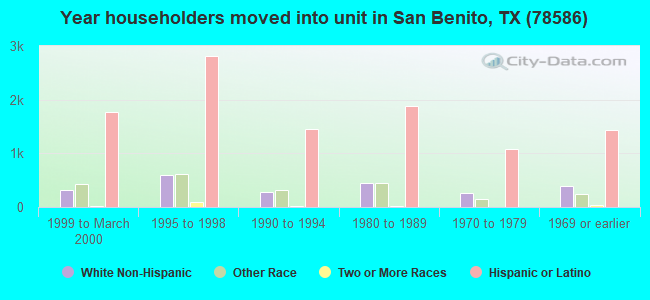
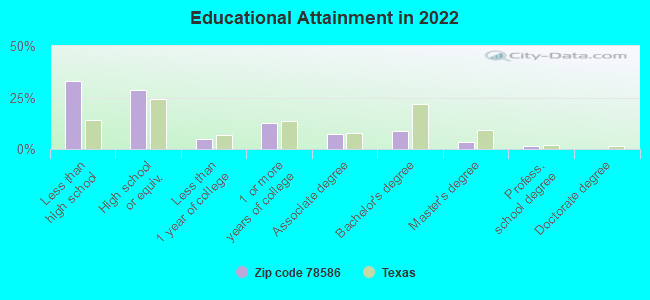
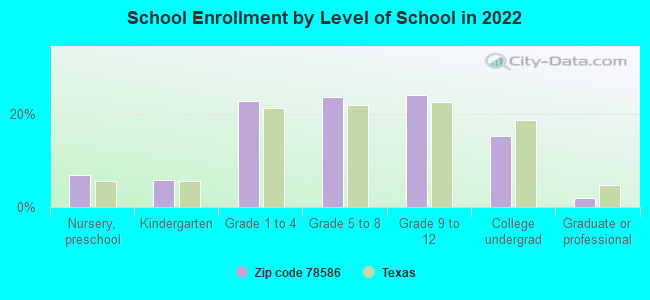
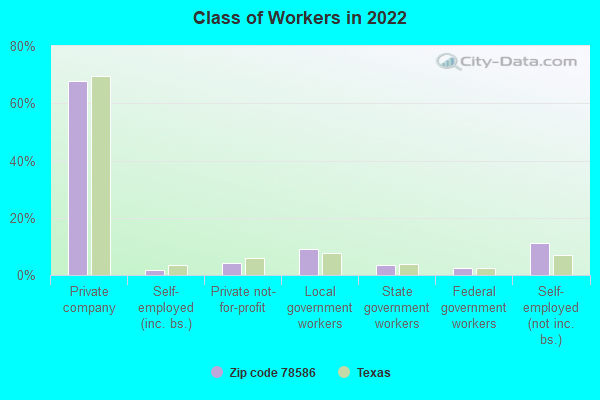
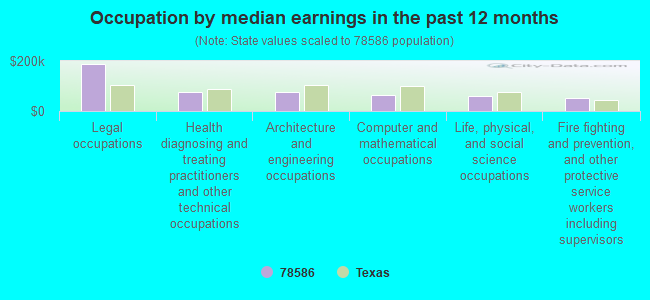
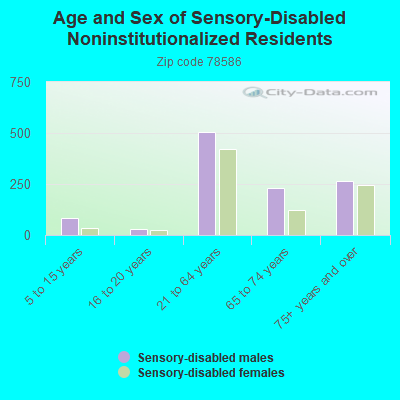

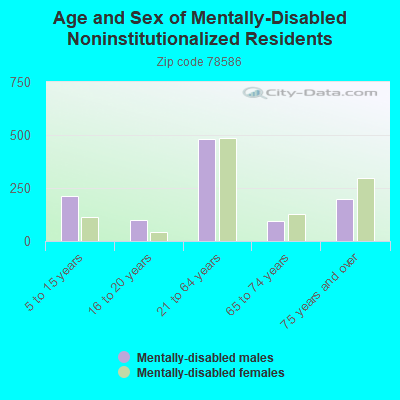
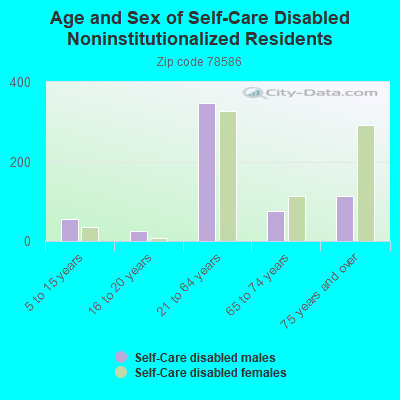

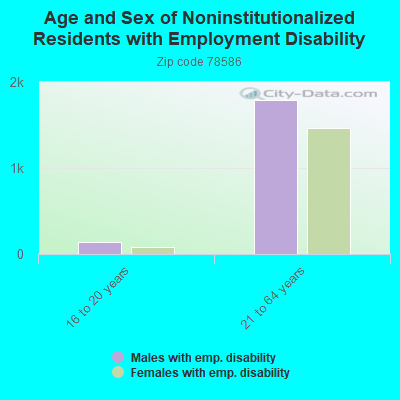
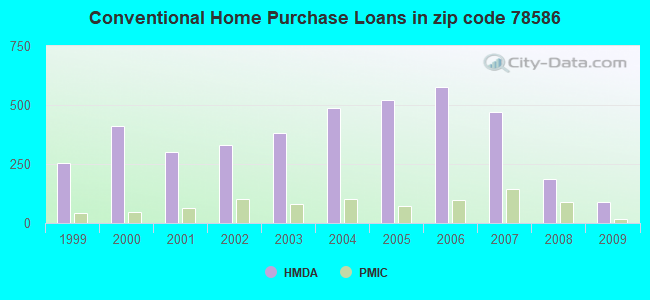

 Based on the data from the years 2002 - 2018 the average number of fire incidents per year is 198. The highest number of fire incidents - 296 took place in 2005, and the least - 115 in 2013. The data has a decreasing trend.
 When looking into fire subcategories, the most incidents belonged to: Outside Fires (67.7%), and Structure Fires (14.3%).