Estimated zip code population in 2022: 11,508 Zip code population in 2010: 7,819 Zip code population in 2000: 5,034
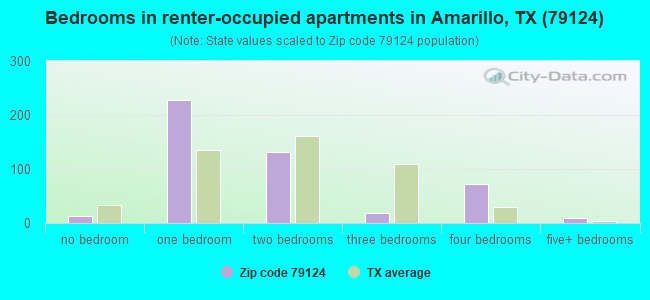
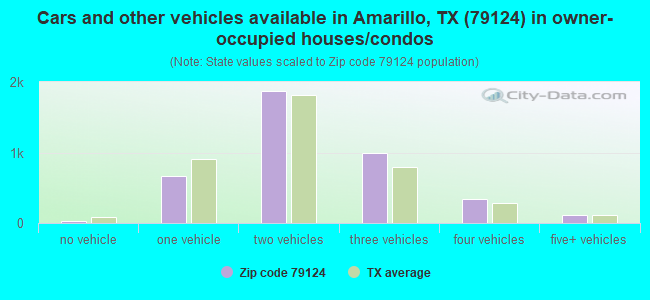
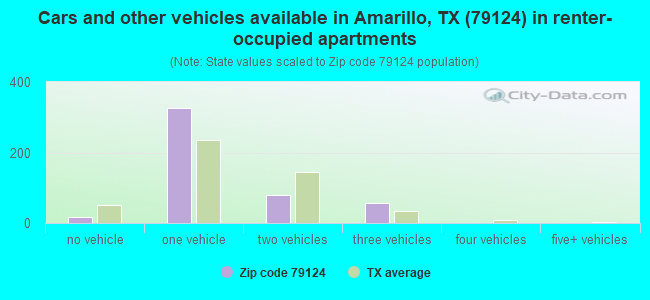
Houses and condos: 4,724 Renter-occupied apartments: 474
% of renters here:
11%
State:
38%
March 2022 cost of living index in zip code 79124: 84.1 (less than average, U.S. average is 100)
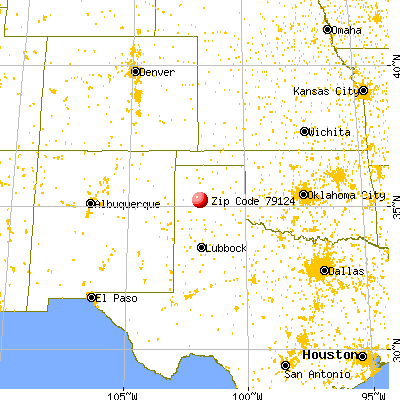
Land area: 90.1 sq. mi. Water area: 0.0 sq. mi.
Population density: 128 people per square mile
(very low).
OSM Map
General Map
Google Map
MSN Map
OSM Map
General Map
Google Map
MSN Map
OSM Map
General Map
Google Map
MSN Map
OSM Map
General Map
Google Map
MSN Map
Please wait while loading the map...
Real estate property taxes paid for housing units in 2022:
This zip code:
1.5% ($5,285)
Texas:
1.5% ($4,050)
Median real estate property taxes paid for housing units with mortgages in 2022: $5,766 (1.4%) Median real estate property taxes paid for housing units with no mortgage in 2022: $4,922 (1.6%)
Estimated median house/condo value in 2022: $363,806
79124:
$363,806
Texas:
$275,400
According to our research of Texas and other state lists, there were 19 registered sex offenders living in 79124 zip code as of June 10, 2024. The ratio of all residents to sex offenders in zip code 79124 is 469 to 1. The ratio of registered sex offenders to all residents in this zip code is near the state average.
Median resident age:
This zip code:
43.2 years
Texas median age:
35.6 years
Average household size:
This zip code:
2.5 people
Texas:
2.6 people
Averages for the 2020 tax year for zip code 79124, filed in 2021:
Average Adjusted Gross Income (AGI) in 2020: $122,138 (Individual Income Tax Returns)
Here:
$122,138
State:
$77,054
Salary/wage: $94,980 (reported on 80.1% of returns)
Here:
$94,980
State:
$62,766
(% of AGI for various income ranges: 1110.3% for AGIs below $25k, 3445.2% for AGIs $25k-50k, 5886.2% for AGIs $50k-75k, 8600.0% for AGIs $75k-100k, 17930.0% for AGIs $100k-200k, 72765.9% for AGIs over 200k)
Taxable interest for individuals: $2,468 (reported on 42.9% of returns)
This zip code:
$2,468
Texas:
$2,665
(% of AGI for various income ranges: 34.6% for AGIs below $25k, 51.2% for AGIs $25k-50k, 78.5% for AGIs $50k-75k, 70.6% for AGIs $75k-100k, 149.2% for AGIs $100k-200k, 1352.3% for AGIs over 200k)
Ordinary dividends: $11,667 (reported on 25.4% of returns)
Here:
$11,667
State:
$10,044
(% of AGI for various income ranges: 41.7% for AGIs below $25k, 62.7% for AGIs $25k-50k, 118.2% for AGIs $50k-75k, 193.6% for AGIs $75k-100k, 366.7% for AGIs $100k-200k, 4579.1% for AGIs over 200k)
Net capital gain/loss in AGI: +$32,891 (reported on 24.5% of returns)
Here:
+$32,891
State:
+$39,590
(% of AGI for various income ranges: 11.0% for AGIs below $25k, 92.0% for AGIs $25k-50k, 134.9% for AGIs $50k-75k, 188.2% for AGIs $75k-100k, 514.2% for AGIs $100k-200k, 15647.3% for AGIs over 200k)
Profit/loss from business: +$22,854 (reported on 20.5% of returns)
Here:
+$22,854
State:
+$10,888
(% of AGI for various income ranges: 80.5% for AGIs below $25k, 44.0% for AGIs $25k-50k, 221.0% for AGIs $50k-75k, 273.3% for AGIs $75k-100k, 654.3% for AGIs $100k-200k, 7095.5% for AGIs over 200k)
Taxable individual retirement arrangement distribution: $27,363 (reported on 13.1% of returns)
79124:
$27,363
Texas:
$24,740
(% of AGI for various income ranges: 69.3% for AGIs below $25k, 181.5% for AGIs $25k-50k, 427.4% for AGIs $50k-75k, 566.1% for AGIs $75k-100k, 706.3% for AGIs $100k-200k, 3268.6% for AGIs over 200k)
Self-employed (Keogh) retirement plans: $32,600 (reported on 1.0% of returns)
79124:
$32,600
Texas:
$29,298
(% of AGI for various income ranges: 740.9% for AGIs over 200k)
Total itemized deductions: $41,710 (reported on 12.7% of returns)
Here:
$41,710
State:
$40,428
(% of AGI for various income ranges: 304.2% for AGIs $25k-50k, 337.9% for AGIs $50k-75k, 391.5% for AGIs $75k-100k, 905.7% for AGIs $100k-200k, 6799.5% for AGIs over 200k)
Charity contributions: $21,309 (reported on 11.3% of returns)
Here:
$21,309
State:
$18,201
(% of AGI for various income ranges: 59.7% for AGIs $25k-50k, 121.5% for AGIs $50k-75k, 111.2% for AGIs $75k-100k, 341.4% for AGIs $100k-200k, 3699.5% for AGIs over 200k)
Taxes paid: $8,217 (reported on 12.7% of returns)
79124:
$8,217
State:
$7,821
(% of AGI for various income ranges: 49.2% for AGIs $25k-50k, 69.0% for AGIs $50k-75k, 87.0% for AGIs $75k-100k, 215.5% for AGIs $100k-200k, 1221.8% for AGIs over 200k)
Earned income credit: $2,111 (reported on 7.6% of returns)
Here:
$2,111
State:
$2,584
(% of AGI for various income ranges: 56.0% for AGIs below $25k, 52.5% for AGIs $25k-50k)
Percentage of individuals using paid preparers for their 2020 taxes: 94.2%
Here:
94%
State:
92%
(% for various income ranges: 93.5% for AGIs below $25k, 93.6% for AGIs $25k-50k, 94.4% for AGIs $50k-75k, 95.8% for AGIs $75k-100k, 94.5% for AGIs $100k-200k, 93.9% for AGIs over 200k)
Averages for the 2012 tax year for zip code 79124, filed in 2013:
Average Adjusted Gross Income (AGI) in 2012: $104,449 (Individual Income Tax Returns)
Here:
$104,449
State:
$65,384
Salary/wage: $77,531 (reported on 81.9% of returns)
Here:
$77,531
State:
$52,524
(% of AGI for various income ranges: 73.1% for AGIs below $25k, 69.9% for AGIs $25k-50k, 71.3% for AGIs $50k-75k, 73.1% for AGIs $75k-100k, 74.2% for AGIs $100k-200k, 47.3% for AGIs over 200k)
Taxable interest for individuals: $1,905 (reported on 44.8% of returns)
This zip code:
$1,905
Texas:
$2,372
(% of AGI for various income ranges: 2.2% for AGIs below $25k, 1.6% for AGIs $25k-50k, 1.1% for AGIs $50k-75k, 0.5% for AGIs $75k-100k, 0.8% for AGIs $100k-200k, 0.6% for AGIs over 200k)
Ordinary dividends: $8,041 (reported on 24.3% of returns)
Here:
$8,041
State:
$9,721
(% of AGI for various income ranges: 2.6% for AGIs below $25k, 1.2% for AGIs $25k-50k, 1.5% for AGIs $50k-75k, 1.1% for AGIs $75k-100k, 1.5% for AGIs $100k-200k, 2.3% for AGIs over 200k)
Net capital gain/loss in AGI: +$23,181 (reported on 22.4% of returns)
Here:
+$23,181
State:
+$35,319
(% of AGI for various income ranges: 0.5% for AGIs $25k-50k, 0.9% for AGIs $50k-75k, 0.8% for AGIs $75k-100k, 1.8% for AGIs $100k-200k, 9.1% for AGIs over 200k)
Profit/loss from business: +$24,807 (reported on 23.2% of returns)
Here:
+$24,807
State:
+$13,732
(% of AGI for various income ranges: 6.3% for AGIs below $25k, 5.3% for AGIs $25k-50k, 3.6% for AGIs $50k-75k, 4.9% for AGIs $75k-100k, 5.2% for AGIs $100k-200k, 6.1% for AGIs over 200k)
Taxable individual retirement arrangement distribution: $18,210 (reported on 13.1% of returns)
79124:
$18,210
Texas:
$19,511
(% of AGI for various income ranges: 3.3% for AGIs below $25k, 4.1% for AGIs $25k-50k, 2.8% for AGIs $50k-75k, 3.7% for AGIs $75k-100k, 2.6% for AGIs $100k-200k, 1.4% for AGIs over 200k)
Self-employment retirement plans: $30,843 (reported on 1.9% of returns)
79124:
$30,843
Texas:
$23,938
Total itemized deductions: $26,779 (15% of AGI, reported on 42.9% of returns)
Here:
$26,779
State:
$24,724
Here:
14.5% of AGI
State:
15.9% of AGI
(% of AGI for various income ranges: 15.0% for AGIs below $25k, 12.0% for AGIs $25k-50k, 13.7% for AGIs $50k-75k, 12.8% for AGIs $75k-100k, 13.1% for AGIs $100k-200k, 8.6% for AGIs over 200k)
Charity contributions: $8,837 (reported on 36.0% of returns)
Here:
$8,837
State:
$6,808
(% of AGI for various income ranges: 1.6% for AGIs below $25k, 2.0% for AGIs $25k-50k, 2.7% for AGIs $50k-75k, 2.3% for AGIs $75k-100k, 3.5% for AGIs $100k-200k, 3.2% for AGIs over 200k)
Taxes paid: $7,844 (reported on 42.7% of returns)
79124:
$7,844
State:
$6,921
(% of AGI for various income ranges: 2.6% for AGIs below $25k, 3.3% for AGIs $25k-50k, 3.5% for AGIs $50k-75k, 3.8% for AGIs $75k-100k, 4.1% for AGIs $100k-200k, 2.6% for AGIs over 200k)
Earned income credit: $2,135 (reported on 11.5% of returns)
Here:
$2,135
State:
$2,570
(% of AGI for various income ranges: 5.5% for AGIs below $25k, 0.8% for AGIs $25k-50k)
Percentage of individuals using paid preparers for their 2012 taxes: 54.1%
Here:
54%
State:
51%
(% for various income ranges: 46.4% for AGIs below $25k, 46.7% for AGIs $25k-50k, 57.4% for AGIs $50k-75k, 51.2% for AGIs $75k-100k, 59.2% for AGIs $100k-200k, 78.4% for AGIs over 200k)
Averages for the 2004 tax year for zip code 79124, filed in 2005:
Average Adjusted Gross Income (AGI) in 2004: $73,814 (Individual Income Tax Returns)
Here:
$73,814
State:
$47,881
Salary/wage: $61,113 (reported on 84.5% of returns)
Here:
$61,113
State:
$41,947
(% of AGI for various income ranges: 322.4% for AGIs below $10k, 74.1% for AGIs $10k-25k, 75.8% for AGIs $25k-50k, 75.5% for AGIs $50k-75k, 80.9% for AGIs $75k-100k, 63.4% for AGIs over 100k)
Taxable interest for individuals: $2,418 (reported on 52.8% of returns)
This zip code:
$2,418
Texas:
$2,255
(% of AGI for various income ranges: 19.7% for AGIs below $10k, 4.0% for AGIs $10k-25k, 2.2% for AGIs $25k-50k, 1.7% for AGIs $50k-75k, 1.3% for AGIs $75k-100k, 1.5% for AGIs over 100k)
Taxable dividends: $4,754 (reported on 29.7% of returns)
Here:
$4,754
State:
$4,261
(% of AGI for various income ranges: 10.2% for AGIs below $10k, 1.5% for AGIs $10k-25k, 0.9% for AGIs $25k-50k, 1.1% for AGIs $50k-75k, 0.9% for AGIs $75k-100k, 2.5% for AGIs over 100k)
Net capital gain/loss: +$10,654 (reported on 25.1% of returns)
Here:
+$10,654
State:
+$16,110
(% of AGI for various income ranges: 10.2% for AGIs below $10k, 1.0% for AGIs $10k-25k, 0.2% for AGIs $25k-50k, 1.3% for AGIs $50k-75k, 1.3% for AGIs $75k-100k, 5.3% for AGIs over 100k)
Profit/loss from business: +$21,080 (reported on 24.2% of returns)
Here:
+$21,080
State:
+$11,013
(% of AGI for various income ranges: -22.0% for AGIs below $10k, 6.4% for AGIs $10k-25k, 6.5% for AGIs $25k-50k, 2.1% for AGIs $50k-75k, 3.7% for AGIs $75k-100k, 9.0% for AGIs over 100k)
IRA payment deduction: $3,591 (reported on 3.0% of returns)
79124:
$3,591
Texas:
$3,120
(% of AGI for various income ranges: 0.4% for AGIs $25k-50k, 0.2% for AGIs $50k-75k, 0.2% for AGIs $75k-100k, 0.1% for AGIs over 100k)
Self-employed pension: $25,614 (reported on 1.8% of returns)
Here:
$25,614
Texas:
$16,401
Total itemized deductions: $21,364 (18% of AGI, reported on 44.1% of returns)
Here:
$21,364
State:
$19,631
Here:
18.2% of AGI
State:
18.9% of AGI
(% of AGI for various income ranges: 32.7% for AGIs below $10k, 11.0% for AGIs $10k-25k, 15.5% for AGIs $25k-50k, 15.3% for AGIs $50k-75k, 16.3% for AGIs $75k-100k, 11.0% for AGIs over 100k)
Charity contributions deductions: $6,591 (5% of AGI, reported on 38.9% of returns)
Here:
$6,591
State:
$4,753
Here:
5.3% of AGI
State:
4.2% of AGI
(% of AGI for various income ranges: 2.3% for AGIs below $10k, 1.5% for AGIs $10k-25k, 2.7% for AGIs $25k-50k, 3.4% for AGIs $50k-75k, 3.6% for AGIs $75k-100k, 3.7% for AGIs over 100k)
Total tax: $14,296 (reported on 82.6% of returns)
79124:
$14,296
State:
$9,058
(% of AGI for various income ranges: 9.8% for AGIs below $10k, 4.5% for AGIs $10k-25k, 7.4% for AGIs $25k-50k, 9.0% for AGIs $50k-75k, 10.7% for AGIs $75k-100k, 20.9% for AGIs over 100k)
Earned income credit: $1,715 (reported on 8.5% of returns)
Here:
$1,715
State:
$2,024
Percentage of individuals using paid preparers for their 2004 taxes: 54.7%
Here:
55%
State:
57%
(% for various income ranges: 46.1% for AGIs below $10k, 50.0% for AGIs $10k-25k, 52.2% for AGIs $25k-50k, 50.8% for AGIs $50k-75k, 53.9% for AGIs $75k-100k, 71.3% for AGIs over 100k)
Household received Food Stamps/SNAP in the past 12 months: 56 Household did not receive Food Stamps/SNAP in the past 12 months: 4,409
Women who had a birth in the past 12 months: 23 (24 now married, 0 unmarried) Women who did not have a birth in the past 12 months: 2,417 (1,472 now married, 931 unmarried)
Housing units in zip code 79124 with a mortgage: 2,274 (68 second mortgage, 52 both second mortgage and home equity loan) Houses without a mortgage: 1
Median monthly owner costs for units with a mortgage: $2,136 Median monthly owner costs for units without a mortgage: $850
Residents with income below the poverty level in 2022:
This zip code:
4.5%
Whole state:
14.0%
Residents with income below 50% of the poverty level in 2022:
This zip code:
0.6%
Whole state:
7.4%
Median number of rooms in houses and condos:
Here:
7.0
State:
6.3
Median number of rooms in apartments:
Here:
3.8
State:
4.0
Notable locations in this zip code not listed on our city pages
Notable locations in zip code 79124: Cliffside Gas Field Camp (A), Kiwanis Camp (B), McCollum Dairy (C), Wesley Dairy (D), Tascosa Country Club (E), Bishop Ranch (F), Potter County Fire Rescue Station 3 (G). Display/hide their locations on the map
Churches in zip code 79124 include: San Jacinto Baptist Church (A), Cliffside Baptist Church (B), Christian Church of God (C). Display/hide their locations on the map
Tourist attractions (not listed on the city page) : Double J Baseball Inc (8201 West Amarillo Boulevard) (1), Amarillo Wildlife Refuge (Arcades & Amusements; 4401 Reding Road) (2). Display/hide their approximate locations on the map
In group quarters: 146 (-1 institutionalized population)
Size of family households: 1,608 2-persons, 644 3-persons, 581 4-persons, 268 5-persons, 105 6-persons, 41 7-or-more-persons
Size of nonfamily households: 1,097 1-person, 142 2-persons
2,644 married couples with children.
104 single-parent households (15 men, 89 women).
90.2% of residents of 79124 zip code speak English at home.
7.5% of residents speak Spanish at home (75% very well, 13% well, 10% not well, 3% not at all).
0.1% of residents speak other Indo-European language at home (9% well, 91% not well).
2.4% of residents speak Asian or Pacific Island language at home (86% very well, 10% well, 4% not well).
0.1% of residents speak other language at home (100% very well).
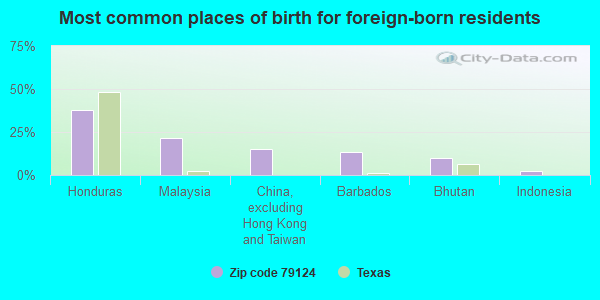
Foreign born population: 473 (4.1%) (83.5% of them are naturalized citizens)
This zip code:
4.1%
Whole state:
17.2%
38%Honduras
21%Malaysia
15%China, excluding Hong Kong and Taiwan
13%Barbados
10%Bhutan
2%Indonesia
0%Austria
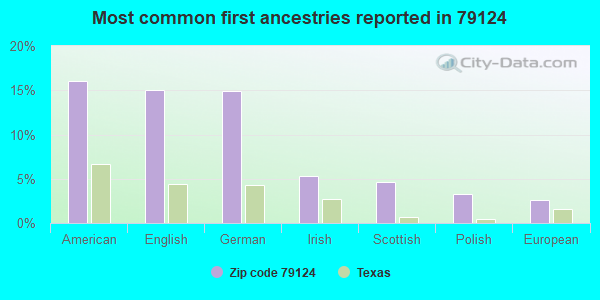
16%American
15%English
15%German
5%Irish
5%Scottish
3%Polish
3%European
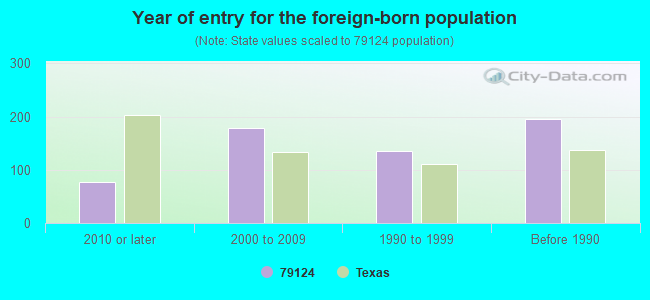
Year of entry for the foreign-born population
772010 or later
1782000 to 2009
1351990 to 1999
195Before 1990
Facilities with environmental interests located in this zip code:
AMARILLO REFINED PRODUCTS TERMINAL (4200 WEST CLIFFSIDE AVENUE in AMARILLO, TX)
CRITERIA AND HAZARDOUS AIR POLLUTANT INVENTORY (Inventory of air pollution sources) National Pollutant Discharge Elimination System NON-MAJOR (Tracking pollutant discharge elimination systems) - permit Small Quantity Generators, between 100 kg and 1000 kg of hazardous waste/month (Resource Conservation and Recovery Act (tracking hazardous waste)) - notification TRI REPORTER (Tracking of toxic chemicals releasing facilities) Business SIC classification: PETROLEUM BULK STATIONS AND TERMINALS Organizations: VALERO LOGISTICS OPERATIONS LP (CONTACT/OPERATOR)
, VALERO LOGISTICS OPEATIONS (CONTACT/OWNER)
, DIAMOND SHAMROCK REF & MKTG (CONTACT/OWNER)
, DIAMOND SHAMROCK REFINING AND MARKETING (CONTACT/OWNER)
Alternative names: DIAMOND SHAMROCK AMARILLO, PHILLIPS PIPELINE CO - AMARILLO TERMINAL, SHAMROCK LOGISTICS,OPERATIONS,, UDS PIPELINES & TERMINALS, VALERO LOGISTICS OPERATIONS, L
A & A LONGHORN MOBILE HOME PARK WATER SYS (17010140 W RD in AMARILLO, TX)
(Integrated Compliance Information System) - ICIS-06-2000-0459, FORMAL ENFORCEMENT ACTION Business SIC classification: WATER SUPPLY
Housing units lacking complete plumbing facilities: 2.7% Housing units lacking complete kitchen facilities: 2.8%
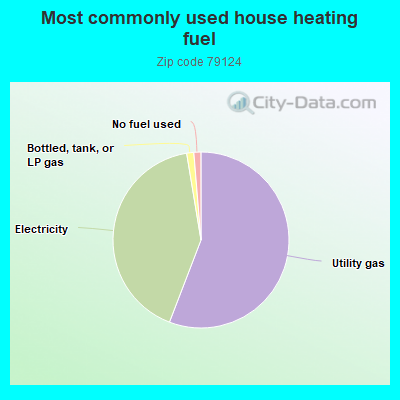
55.9%Utility gas
41.6%Electricity
1.3%Bottled, tank, or LP gas
1.3%No fuel used
Population in 1990: 3,694. Population change in the 1990s: +1,340 (+36.3%).
Place of birth for U.S.-born residents:
This state: 7,899
Northeast: 118
Midwest: 543
South: 1,023
West: 1,304
45% of the 79124 zip code residents lived in the same house 5 years ago. Out of people who lived in different houses, 33% lived in this county. Out of people who lived in different counties, 50% lived in Texas.
90% of the 79124 zip code residents lived in the same house 1 year ago. Out of people who lived in different houses, 25% moved from this county. Out of people who lived in different houses, 70% moved from different county within same state. Out of people who lived in different houses, 8% moved from different state.
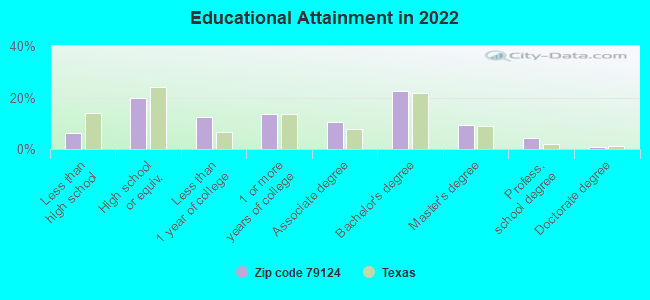
Private vs. public school enrollment:
Students in private schools in grades 1 to 8 (elementary and middle school): 185
Here:
13.3%
Texas:
8.8%
Students in private schools in grades 9 to 12 (high school): 65
Here:
8.6%
Texas:
8.0%
Students in private undergraduate colleges: 22
Here:
7.7%
Texas:
16.2%
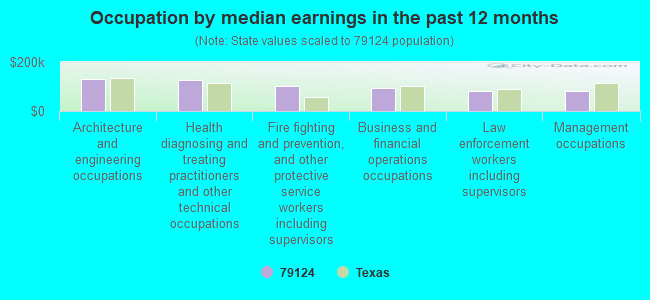
Occupation by median earnings in the past 12 months ($)
130,401Architecture and engineering occupations
125,818Health diagnosing and treating practitioners and other technical occupations
103,647Fire fighting and prevention, and other protective service workers including supervisors
92,623Business and financial operations occupations
81,918Law enforcement workers including supervisors
81,706Management occupations
Companies with federal contracts located in this zip code (AMARILLO, TX):
SAGE OIL VAC INC (2300 N WESTERN ST; small business) : $1,957,217 in 23 contractsfrom 2003 to 2006
Contracts for Motor Vehicle Maintenance and Repair Shop Specialized Equipment, Miscellaneous Special Industry Machinery, Trailers, Compressors and Vacuum Pumps, and moreby Army, Navy, Air Force, U.S. Army Corps of Engineers - civil program financing only, and others Signed by year:2000: $0; 2001: $0; 2002: $0; 2003: $132,575; 2004: $1,587,627; 2005: $212,165; 2006: $24,850.
Biggest contracts:
$693,717 with Army for Motor Vehicle Maintenance and Repair Shop Specialized Equipment. Taking place in AR. Signed on 2004-04-07. Completion date: 2004-07-06.
$598,547 with Army for Motor Vehicle Maintenance and Repair Shop Specialized Equipment. Signed on 2004-09-30. Completion date: 2004-10-22.
$141,291, same as above.Signed on 2004-06-03. Completion date: 2004-08-16.
$120,385 with Navy for Miscellaneous Special Industry Machinery. Taking place in CA. Signed on 2003-03-12. Completion date: 2003-05-30.
KELLEY, JACK B., INC. (9645 INTERCHANGE 552) : $674,066 in 7 contractsfrom 1999 to 2000
Contracts for Liquid Propellant Fuels and Oxidizers, Chemical Base by Air Force Signed by year:2000: $527,136; 2001: $0; 2002: $0; 2003: $0; 2004: $0; 2005: $0; 2006: $0.
Biggest contracts:
$148,258 with Air Force for Liquid Propellant Fuels and Oxidizers, Chemical Base. Signed on 2000-06-21. Completion date: 2001-08-31.
$116,940, same as above.Signed on 2000-06-30. Completion date: 2004-12-21.
$116,940, same as above.Signed on 1999-11-17. Completion date: 2003-12-23.
$116,940, same as above.Signed on 2000-03-10. Completion date: 2003-12-23.
CITY MACHINE & WELDING INC (9701 INTERCHANGE 552; small business) : $423,671 in 28 contractsfrom 2002 to 2006
Contracts for Liquid Propellant Fuels and Oxidizers, Chemical Base, Other Cargo and Freight Services by Defense Logistics Agency, Army Signed by year:2000: $0; 2001: $0; 2002: $14,980; 2003: $49,253; 2004: $17,312; 2005: $231,312; 2006: $110,814.
Biggest contracts:
$67,500 with Defense Logistics Agency for Liquid Propellant Fuels and Oxidizers, Chemical Base. Signed on 2005-09-27. Completion date: 2006-07-25.
$63,000, same as above.Signed on 2005-07-26. Completion date: 2006-07-25.
$33,860 with Army for Other Cargo and Freight Services. Signed on 2003-11-19. Completion date: 2003-12-31.
$26,183 with Defense Logistics Agency for Liquid Propellant Fuels and Oxidizers, Chemical Base. Signed on 2006-01-18. Completion date: 2006-07-25.
JAYVIC INC (4210 W HESTER; small business) : $37,052 in 3 contractsfrom 2003 to 2004
$31,892 with Air Force for Carpet Laying and Cleaning. Signed on 2004-09-07. Completion date: 2004-12-15.
$5,760 with Public Buildings Service for Maintenance, Repair or Alteration of Real Property -- Office Buildings. Taking place in TN. Signed on 2003-03-15. Completion date: 2003-04-15.
-$600, same as above.Signed on 2003-06-15. Completion date: 2003-04-15.
Top industries in this zip code by the number of employees in 2005:
Health Care and Social Assistance: Nursing Care Facilities (250-499 employees: 1 establishment, 100-249 employees: 1 establishment)
Administrative and Support and Waste Management and Remediation Services: Janitorial Services (100-249: 1, 5-9: 1)
Health Care and Social Assistance: Specialty (except Psychiatric and Substance Abuse) Hospitals (100-249: 1)
Health Care and Social Assistance: Offices of Physicians (except Mental Health Specialists) (50-99: 1, 10-19: 1, 5-9: 3, 1-4: 6)
Other Services (except Public Administration): Religious Organizations (50-99: 1, 20-49: 1, 1-4: 1)
Health Care and Social Assistance: Freestanding Ambulatory Surgical and Emergency Centers (50-99: 1, 20-49: 1, 1-4: 1)
Arts, Entertainment, and Recreation: Golf Courses and Country Clubs (50-99: 1, 20-49: 1)
Other Services (except Public Administration): General Automotive Repair (50-99: 1)
People in group quarters in 2010:
88 people in nursing facilities/skilled-nursing facilities
People in group quarters in 2000:
123 people in nursing homes
Fatal accident statistics in 2014:
Fatal accident count: 3
Vehicles involved in fatal accidents: 6
Fatal accidents caused by drunken drivers: 1
Fatalities: 4
Persons involved in fatal accidents: 6
Pedestrians involved in fatal accidents: 0
Fatal accident statistics in 2013:
Fatal accident count: 3
Vehicles involved in fatal accidents: 5
Fatal accidents caused by drunken drivers: 2
Fatalities: 3
Persons involved in fatal accidents: 7
Pedestrians involved in fatal accidents: 0
Home Mortgage Disclosure Act Aggregated Statistics For Year 2009 (Based on 2 full and 4 partial tracts)
A) FHA, FSA/RHS & VA Home Purchase Loans
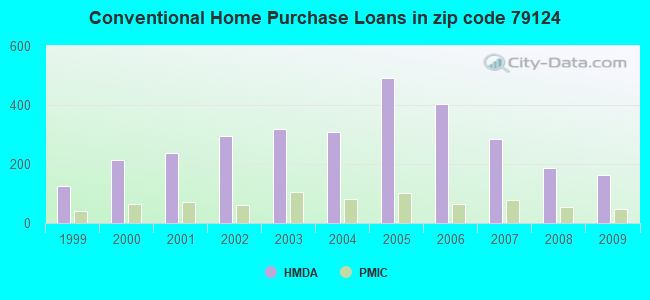
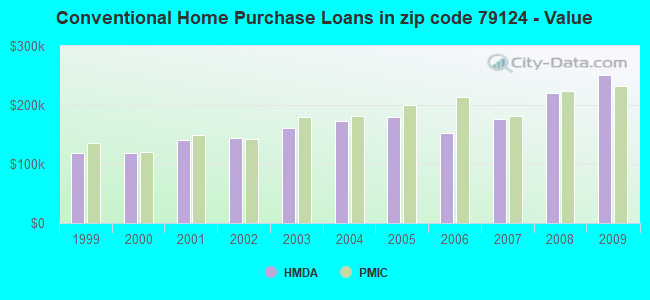
B) Conventional Home Purchase Loans
C) Refinancings
D) Home Improvement Loans
F) Non-occupant Loans on < 5 Family Dwellings (A B C & D)
G) Loans On Manufactured Home Dwelling (A B C & D)
Number
Average Value
Number
Average Value
Number
Average Value
Number
Average Value
Number
Average Value
Number
Average Value
LOANS ORIGINATED
74
$170,200
163
$251,010
367
$196,800
14
$30,483
23
$180,044
4
$52,192
APPLICATIONS APPROVED, NOT ACCEPTED
5
$138,532
20
$230,201
56
$187,230
1
$19,070
4
$105,240
3
$62,777
APPLICATIONS DENIED
8
$158,275
11
$371,053
65
$186,850
12
$57,993
3
$148,813
3
$62,653
APPLICATIONS WITHDRAWN
3
$108,163
15
$297,352
55
$240,311
4
$320,218
2
$176,385
1
$41,440
FILES CLOSED FOR INCOMPLETENESS
0
$0
3
$145,527
8
$190,590
0
$0
0
$0
1
$68,450
Aggregated Statistics For Year 2008 (Based on 2 full and 4 partial tracts)
A) FHA, FSA/RHS & VA Home Purchase Loans
B) Conventional Home Purchase Loans
C) Refinancings
D) Home Improvement Loans
F) Non-occupant Loans on < 5 Family Dwellings (A B C & D)
G) Loans On Manufactured Home Dwelling (A B C & D)
Number
Average Value
Number
Average Value
Number
Average Value
Number
Average Value
Number
Average Value
Number
Average Value
LOANS ORIGINATED
49
$156,007
188
$220,569
140
$152,886
40
$82,535
14
$149,329
6
$72,955
APPLICATIONS APPROVED, NOT ACCEPTED
3
$161,150
25
$173,540
38
$270,994
3
$21,593
1
$62,480
1
$67,710
APPLICATIONS DENIED
5
$131,338
14
$165,846
53
$250,981
6
$30,502
3
$99,477
6
$60,415
APPLICATIONS WITHDRAWN
4
$203,490
5
$176,962
29
$239,177
2
$149,685
0
$0
0
$0
FILES CLOSED FOR INCOMPLETENESS
0
$0
2
$344,285
6
$288,393
0
$0
0
$0
0
$0
Aggregated Statistics For Year 2007 (Based on 2 full and 4 partial tracts)
A) FHA, FSA/RHS & VA Home Purchase Loans
B) Conventional Home Purchase Loans
C) Refinancings
D) Home Improvement Loans
E) Loans on Dwellings For 5+ Families
F) Non-occupant Loans on < 5 Family Dwellings (A B C & D)
G) Loans On Manufactured Home Dwelling (A B C & D)
Number
Average Value
Number
Average Value
Number
Average Value
Number
Average Value
Number
Average Value
Number
Average Value
Number
Average Value
LOANS ORIGINATED
15
$134,312
285
$176,849
111
$173,670
47
$60,117
0
$0
25
$154,804
5
$61,050
APPLICATIONS APPROVED, NOT ACCEPTED
2
$98,125
37
$204,296
30
$244,653
5
$30,650
0
$0
0
$0
3
$38,260
APPLICATIONS DENIED
4
$97,295
34
$122,168
82
$212,137
18
$24,962
0
$0
1
$48,830
4
$53,855
APPLICATIONS WITHDRAWN
2
$173,475
19
$220,070
44
$229,536
5
$244,204
1
$725,200
0
$0
2
$64,750
FILES CLOSED FOR INCOMPLETENESS
9
$60,180
6
$352,372
9
$244,536
0
$0
0
$0
0
$0
0
$0
Aggregated Statistics For Year 2006 (Based on 2 full and 4 partial tracts)
A) FHA, FSA/RHS & VA Home Purchase Loans
B) Conventional Home Purchase Loans
C) Refinancings
D) Home Improvement Loans
F) Non-occupant Loans on < 5 Family Dwellings (A B C & D)
G) Loans On Manufactured Home Dwelling (A B C & D)
Number
Average Value
Number
Average Value
Number
Average Value
Number
Average Value
Number
Average Value
Number
Average Value
LOANS ORIGINATED
20
$117,958
405
$153,289
89
$147,288
46
$55,951
21
$164,966
9
$64,353
APPLICATIONS APPROVED, NOT ACCEPTED
0
$0
62
$169,706
13
$146,165
2
$59,085
4
$115,808
4
$68,942
APPLICATIONS DENIED
5
$116,260
43
$146,024
53
$143,476
10
$33,681
6
$177,217
12
$41,404
APPLICATIONS WITHDRAWN
3
$187,203
37
$360,117
31
$162,859
3
$30,460
2
$170,690
1
$48,470
FILES CLOSED FOR INCOMPLETENESS
0
$0
5
$168,472
16
$142,080
0
$0
0
$0
0
$0
Aggregated Statistics For Year 2005 (Based on 2 full and 4 partial tracts)
A) FHA, FSA/RHS & VA Home Purchase Loans
B) Conventional Home Purchase Loans
C) Refinancings
D) Home Improvement Loans
F) Non-occupant Loans on < 5 Family Dwellings (A B C & D)
G) Loans On Manufactured Home Dwelling (A B C & D)
Number
Average Value
Number
Average Value
Number
Average Value
Number
Average Value
Number
Average Value
Number
Average Value
LOANS ORIGINATED
29
$119,713
491
$179,426
161
$153,832
30
$36,433
40
$227,646
9
$66,758
APPLICATIONS APPROVED, NOT ACCEPTED
1
$100,640
62
$137,778
19
$235,669
4
$17,482
0
$0
5
$48,482
APPLICATIONS DENIED
4
$108,415
50
$129,738
78
$135,312
24
$56,415
9
$127,320
22
$53,775
APPLICATIONS WITHDRAWN
9
$117,040
44
$194,331
49
$189,035
5
$138,348
3
$69,830
3
$47,777
FILES CLOSED FOR INCOMPLETENESS
0
$0
4
$112,762
30
$108,627
0
$0
2
$67,715
0
$0
Aggregated Statistics For Year 2004 (Based on 2 full and 4 partial tracts)
A) FHA, FSA/RHS & VA Home Purchase Loans
B) Conventional Home Purchase Loans
C) Refinancings
D) Home Improvement Loans
F) Non-occupant Loans on < 5 Family Dwellings (A B C & D)
G) Loans On Manufactured Home Dwelling (A B C & D)
Number
Average Value
Number
Average Value
Number
Average Value
Number
Average Value
Number
Average Value
Number
Average Value
LOANS ORIGINATED
21
$129,140
310
$172,181
265
$144,534
26
$42,468
16
$121,610
10
$50,149
APPLICATIONS APPROVED, NOT ACCEPTED
0
$0
40
$168,806
35
$130,435
2
$59,855
3
$140,270
1
$47,310
APPLICATIONS DENIED
2
$93,805
42
$104,825
76
$128,045
26
$43,086
9
$62,200
16
$58,761
APPLICATIONS WITHDRAWN
3
$85,273
14
$174,440
49
$129,990
8
$43,658
0
$0
2
$116,475
FILES CLOSED FOR INCOMPLETENESS
0
$0
4
$227,520
20
$118,125
0
$0
0
$0
0
$0
Aggregated Statistics For Year 2003 (Based on 2 full and 4 partial tracts)
A) FHA, FSA/RHS & VA Home Purchase Loans
B) Conventional Home Purchase Loans
C) Refinancings
D) Home Improvement Loans
F) Non-occupant Loans on < 5 Family Dwellings (A B C & D)
Number
Average Value
Number
Average Value
Number
Average Value
Number
Average Value
Number
Average Value
LOANS ORIGINATED
30
$121,870
318
$160,860
486
$132,532
22
$34,377
14
$81,959
APPLICATIONS APPROVED, NOT ACCEPTED
0
$0
35
$191,954
46
$143,083
1
$3,700
1
$69,810
APPLICATIONS DENIED
3
$119,573
19
$112,430
104
$113,806
12
$72,988
5
$141,584
APPLICATIONS WITHDRAWN
0
$0
19
$118,733
69
$133,228
0
$0
4
$188,085
FILES CLOSED FOR INCOMPLETENESS
0
$0
5
$110,464
16
$139,888
0
$0
2
$76,840
Aggregated Statistics For Year 2002 (Based on 2 full and 4 partial tracts)
A) FHA, FSA/RHS & VA Home Purchase Loans
B) Conventional Home Purchase Loans
C) Refinancings
D) Home Improvement Loans
E) Loans on Dwellings For 5+ Families
F) Non-occupant Loans on < 5 Family Dwellings (A B C & D)
Number
Average Value
Number
Average Value
Number
Average Value
Number
Average Value
Number
Average Value
Number
Average Value
LOANS ORIGINATED
45
$108,972
296
$144,450
283
$124,173
30
$47,170
1
$222,950
24
$107,201
APPLICATIONS APPROVED, NOT ACCEPTED
3
$155,650
19
$96,206
46
$143,637
1
$9,110
0
$0
2
$43,810
APPLICATIONS DENIED
2
$122,040
29
$82,696
60
$92,169
15
$20,917
0
$0
0
$0
APPLICATIONS WITHDRAWN
0
$0
18
$284,576
46
$125,882
2
$4,990
0
$0
2
$64,985
FILES CLOSED FOR INCOMPLETENESS
4
$181,430
7
$98,206
20
$112,728
0
$0
0
$0
2
$146,620
Aggregated Statistics For Year 2001 (Based on 2 full and 4 partial tracts)
A) FHA, FSA/RHS & VA Home Purchase Loans
B) Conventional Home Purchase Loans
C) Refinancings
D) Home Improvement Loans
F) Non-occupant Loans on < 5 Family Dwellings (A B C & D)
Number
Average Value
Number
Average Value
Number
Average Value
Number
Average Value
Number
Average Value
LOANS ORIGINATED
28
$92,084
237
$139,876
248
$131,419
23
$17,112
11
$84,844
APPLICATIONS APPROVED, NOT ACCEPTED
0
$0
29
$123,179
38
$107,265
1
$25,890
2
$157,365
APPLICATIONS DENIED
2
$57,735
27
$50,750
59
$80,169
5
$9,194
7
$45,757
APPLICATIONS WITHDRAWN
0
$0
11
$125,109
56
$111,886
0
$0
0
$0
FILES CLOSED FOR INCOMPLETENESS
0
$0
0
$0
5
$119,404
0
$0
0
$0
Aggregated Statistics For Year 2000 (Based on 2 full and 4 partial tracts)
A) FHA, FSA/RHS & VA Home Purchase Loans
B) Conventional Home Purchase Loans
C) Refinancings
D) Home Improvement Loans
F) Non-occupant Loans on < 5 Family Dwellings (A B C & D)
Number
Average Value
Number
Average Value
Number
Average Value
Number
Average Value
Number
Average Value
LOANS ORIGINATED
38
$88,929
213
$117,909
71
$158,136
24
$21,435
22
$58,302
APPLICATIONS APPROVED, NOT ACCEPTED
0
$0
27
$104,205
10
$66,981
3
$32,337
3
$28,387
APPLICATIONS DENIED
3
$101,713
71
$77,146
27
$67,703
5
$6,374
6
$59,990
APPLICATIONS WITHDRAWN
2
$34,760
12
$183,802
10
$71,025
1
$7,890
0
$0
FILES CLOSED FOR INCOMPLETENESS
2
$46,900
5
$37,114
0
$0
0
$0
0
$0
Aggregated Statistics For Year 1999 (Based on 3 partial tracts)
A) FHA, FSA/RHS & VA Home Purchase Loans
B) Conventional Home Purchase Loans
C) Refinancings
D) Home Improvement Loans
F) Non-occupant Loans on < 5 Family Dwellings (A B C & D)
2002 - 2018 National Fire Incident Reporting System (NFIRS) incidents
According to the data from the years 2002 - 2018 the average number of fire incidents per year is 31. The highest number of fires - 67 took place in 2015, and the least - 6 in 2002. The data has an increasing trend.
When looking into fire subcategories, the most incidents belonged to: Outside Fires (56.6%), and Structure Fires (24.7%).
Fire incident types reported to NFIRS in Zip Code 79124


 Nearest zip codes: 79106, 79121, 79102, 79109, 79101, 79110.


 According to the data from the years 2002 - 2018 the average number of fire incidents per year is 31. The highest number of fires - 67 took place in 2015, and the least - 6 in 2002. The data has an increasing trend.
 When looking into fire subcategories, the most incidents belonged to: Outside Fires (56.6%), and Structure Fires (24.7%).