Estimated zip code population in 2022: 2,905 Zip code population in 2010: 2,842 Zip code population in 2000: 2,985
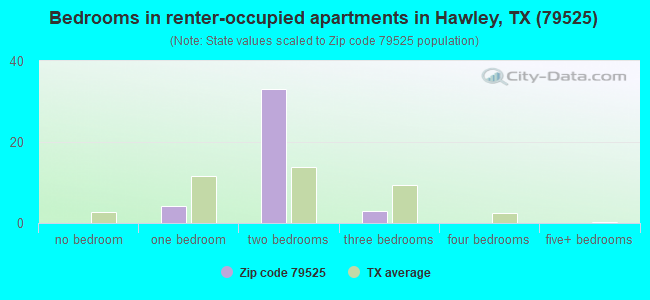
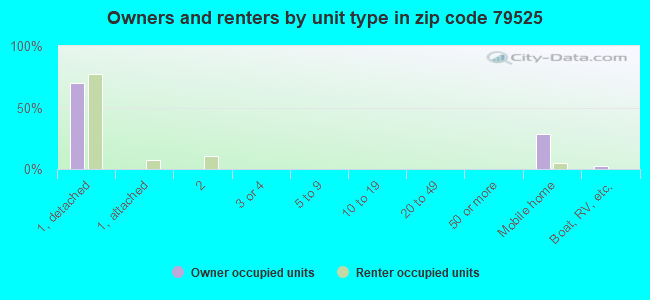
Houses and condos: 1,277 Renter-occupied apartments: 41
% of renters here:
3%
State:
38%
March 2022 cost of living index in zip code 79525: 78.8 (low, U.S. average is 100)
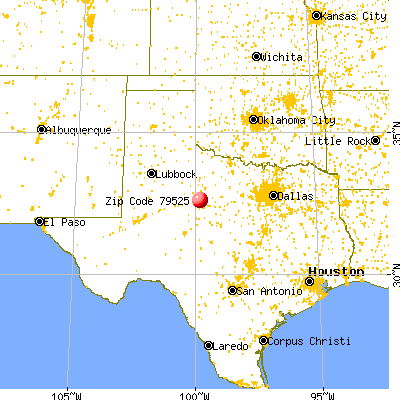
Land area: 93.7 sq. mi. Water area: 0.2 sq. mi.
Population density: 31 people per square mile
(very low).
OSM Map
General Map
Google Map
MSN Map
OSM Map
General Map
Google Map
MSN Map
OSM Map
General Map
Google Map
MSN Map
OSM Map
General Map
Google Map
MSN Map
Please wait while loading the map...
Real estate property taxes paid for housing units in 2022:
This zip code:
0.9% ($1,487)
Texas:
1.5% ($4,050)
Median real estate property taxes paid for housing units with mortgages in 2022: $3,312 (1.9%) Median real estate property taxes paid for housing units with no mortgage in 2022: $1,373 (0.9%)
Business Search- 14 Million verified businesses
Males: 1,376
(47.4%)
Females: 1,528
(52.6%)
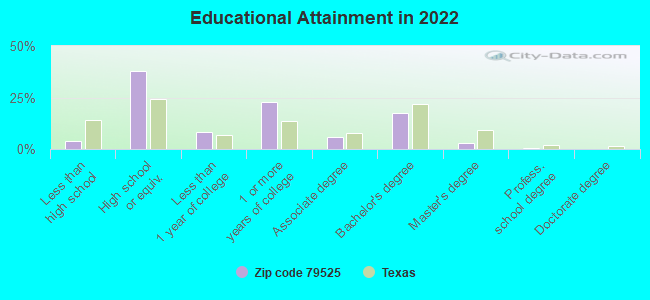
For population 25 years and over in 79525:
High school or higher: 95.1%
Bachelor's degree or higher: 21.1%
Graduate or professional degree: 3.6%
Unemployed: 2.4%
Mean travel time to work (commute): 28.2 minutes
For population 15 years and over in 79525:
Never married: 23.9%
Now married: 60.2%
Separated: 5.6%
Widowed: 3.5%
Divorced: 6.8%
Zip code 79525 compared to state average:
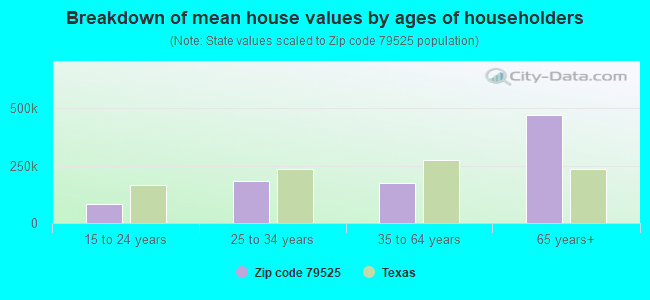
Median house value below state average.
Unemployed percentage below state average.
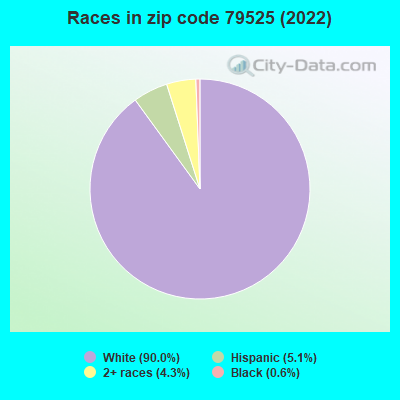
Black race population percentage significantly below state average.
Hispanic race population percentage significantly below state average.
Median age above state average.
Foreign-born population percentage significantly below state average.
Renting percentage significantly below state average.
Length of stay since moving in significantly above state average.
Number of college students significantly below state average.
Percentage of population with a bachelor's degree or higher below state average.
Averages for the 2020 tax year for zip code 79525, filed in 2021:
Average Adjusted Gross Income (AGI) in 2020: $58,308 (Individual Income Tax Returns)
Here:
$58,308
State:
$77,054
Salary/wage: $52,627 (reported on 83.8% of returns)
Here:
$52,627
State:
$62,766
(% of AGI for various income ranges: 1320.9% for AGIs below $25k, 3527.9% for AGIs $25k-50k, 6912.4% for AGIs $50k-75k, 9038.5% for AGIs $75k-100k, 16149.2% for AGIs $100k-200k)
Taxable interest for individuals: $461 (reported on 21.8% of returns)
This zip code:
$461
Texas:
$2,665
(% of AGI for various income ranges: 3.9% for AGIs below $25k, 9.6% for AGIs $25k-50k, 7.1% for AGIs $50k-75k, 15.4% for AGIs $75k-100k, 22.3% for AGIs $100k-200k)
Ordinary dividends: $2,400 (reported on 9.2% of returns)
Here:
$2,400
State:
$10,044
(% of AGI for various income ranges: 11.8% for AGIs $25k-50k, 14.7% for AGIs $50k-75k, 13.8% for AGIs $75k-100k, 181.5% for AGIs $100k-200k)
Net capital gain/loss in AGI: +$19,223 (reported on 9.2% of returns)
Here:
+$19,223
State:
+$39,590
(% of AGI for various income ranges: 11.5% for AGIs below $25k, 70.6% for AGIs $50k-75k, 77.7% for AGIs $75k-100k, 1723.1% for AGIs $100k-200k)
Profit/loss from business: +$10,039 (reported on 21.8% of returns)
Here:
+$10,039
State:
+$10,888
(% of AGI for various income ranges: 171.2% for AGIs below $25k, 206.1% for AGIs $25k-50k, 245.9% for AGIs $50k-75k, 370.0% for AGIs $75k-100k, 823.8% for AGIs $100k-200k)
Taxable individual retirement arrangement distribution: $13,150 (reported on 5.6% of returns)
79525:
$13,150
Texas:
$24,740
(% of AGI for various income ranges: 76.1% for AGIs below $25k, 169.4% for AGIs $50k-75k, 394.6% for AGIs $100k-200k)
Total itemized deductions: $38,400 (reported on 2.1% of returns)
Here:
$38,400
State:
$40,428
(% of AGI for various income ranges: 886.2% for AGIs $75k-100k)
Charity contributions: $31,700 (reported on 1.4% of returns)
Here:
$31,700
State:
$18,201
(% of AGI for various income ranges: 226.4% for AGIs $25k-50k)
Taxes paid: $6,000 (reported on 2.1% of returns)
79525:
$6,000
State:
$7,821
(% of AGI for various income ranges: 138.5% for AGIs $75k-100k)
Earned income credit: $2,412 (reported on 18.3% of returns)
Here:
$2,412
State:
$2,584
(% of AGI for various income ranges: 120.0% for AGIs below $25k, 82.5% for AGIs $25k-50k)
Percentage of individuals using paid preparers for their 2020 taxes: 93.7%
Here:
94%
State:
92%
(% for various income ranges: 91.1% for AGIs below $25k, 94.3% for AGIs $25k-50k, 95.7% for AGIs $50k-75k, 94.1% for AGIs $75k-100k, 94.7% for AGIs $100k-200k, 100.0% for AGIs over 200k)
Averages for the 2012 tax year for zip code 79525, filed in 2013:
Average Adjusted Gross Income (AGI) in 2012: $47,098 (Individual Income Tax Returns)
Here:
$47,098
State:
$65,384
Salary/wage: $43,027 (reported on 84.7% of returns)
Here:
$43,027
State:
$52,524
(% of AGI for various income ranges: 79.0% for AGIs below $25k, 85.8% for AGIs $25k-50k, 86.6% for AGIs $50k-75k, 85.3% for AGIs $75k-100k, 58.9% for AGIs $100k-200k)
Taxable interest for individuals: $877 (reported on 25.0% of returns)
This zip code:
$877
Texas:
$2,372
(% of AGI for various income ranges: 0.6% for AGIs below $25k, 0.5% for AGIs $25k-50k, 0.3% for AGIs $50k-75k, 0.1% for AGIs $75k-100k, 0.8% for AGIs $100k-200k)
Ordinary dividends: $1,060 (reported on 8.1% of returns)
Here:
$1,060
State:
$9,721
(% of AGI for various income ranges: 0.5% for AGIs below $25k, 0.1% for AGIs $50k-75k, 0.4% for AGIs $100k-200k)
Net capital gain/loss in AGI: +$7,611 (reported on 7.3% of returns)
Here:
+$7,611
State:
+$35,319
(% of AGI for various income ranges: 0.1% for AGIs below $25k, 0.6% for AGIs $50k-75k, 3.6% for AGIs $100k-200k)
Profit/loss from business: +$9,180 (reported on 20.2% of returns)
Here:
+$9,180
State:
+$13,732
(% of AGI for various income ranges: 8.8% for AGIs below $25k, 0.5% for AGIs $25k-50k, 3.2% for AGIs $50k-75k, 11.5% for AGIs $75k-100k)
Taxable individual retirement arrangement distribution: $9,814 (reported on 5.6% of returns)
79525:
$9,814
Texas:
$19,511
(% of AGI for various income ranges: 2.0% for AGIs below $25k, 0.8% for AGIs $25k-50k, 4.0% for AGIs $75k-100k)
Total itemized deductions: $18,835 (20% of AGI, reported on 13.7% of returns)
Here:
$18,835
State:
$24,724
Here:
20.2% of AGI
State:
15.9% of AGI
(% of AGI for various income ranges: 7.5% for AGIs $25k-50k, 5.4% for AGIs $50k-75k, 5.1% for AGIs $75k-100k, 6.3% for AGIs $100k-200k)
Charity contributions: $5,582 (reported on 8.9% of returns)
Here:
$5,582
State:
$6,808
(% of AGI for various income ranges: 1.3% for AGIs $25k-50k, 0.7% for AGIs $50k-75k, 0.8% for AGIs $75k-100k, 1.7% for AGIs $100k-200k)
Taxes paid: $3,612 (reported on 13.7% of returns)
79525:
$3,612
State:
$6,921
(% of AGI for various income ranges: 1.2% for AGIs $25k-50k, 1.0% for AGIs $50k-75k, 1.2% for AGIs $75k-100k, 1.2% for AGIs $100k-200k)
Earned income credit: $2,568 (reported on 22.6% of returns)
Here:
$2,568
State:
$2,570
(% of AGI for various income ranges: 8.6% for AGIs below $25k, 1.6% for AGIs $25k-50k)
Percentage of individuals using paid preparers for their 2012 taxes: 55.6%
Here:
56%
State:
51%
(% for various income ranges: 53.2% for AGIs below $25k, 52.9% for AGIs $25k-50k, 57.9% for AGIs $50k-75k, 57.1% for AGIs $75k-100k, 70.0% for AGIs $100k-200k)
Averages for the 2004 tax year for zip code 79525, filed in 2005:
Average Adjusted Gross Income (AGI) in 2004: $30,097 (Individual Income Tax Returns)
Here:
$30,097
State:
$47,881
Salary/wage: $29,837 (reported on 85.6% of returns)
Here:
$29,837
State:
$41,947
(% of AGI for various income ranges: 150.6% for AGIs below $10k, 80.8% for AGIs $10k-25k, 85.8% for AGIs $25k-50k, 88.8% for AGIs $50k-75k, 79.2% for AGIs $75k-100k, 65.4% for AGIs over 100k)
Taxable interest for individuals: $642 (reported on 29.1% of returns)
This zip code:
$642
Texas:
$2,255
(% of AGI for various income ranges: 5.1% for AGIs below $10k, 0.7% for AGIs $10k-25k, 0.5% for AGIs $25k-50k, 0.5% for AGIs $50k-75k, 0.4% for AGIs $75k-100k, 0.6% for AGIs over 100k)
Taxable dividends: $823 (reported on 10.7% of returns)
Here:
$823
State:
$4,261
(% of AGI for various income ranges: 2.6% for AGIs below $10k, 0.5% for AGIs $10k-25k, 0.2% for AGIs $25k-50k, 0.1% for AGIs $50k-75k, 0.3% for AGIs $75k-100k)
Net capital gain/loss: +$841 (reported on 9.2% of returns)
Here:
+$841
State:
+$16,110
(% of AGI for various income ranges: -1.3% for AGIs below $10k, 1.0% for AGIs $10k-25k, 0.2% for AGIs $25k-50k, 0.2% for AGIs $50k-75k, 0.1% for AGIs $75k-100k)
Profit/loss from business: +$5,528 (reported on 21.6% of returns)
Here:
+$5,528
State:
+$11,013
(% of AGI for various income ranges: 17.9% for AGIs below $10k, 10.4% for AGIs $10k-25k, 2.8% for AGIs $25k-50k, 3.9% for AGIs $50k-75k, -0.1% for AGIs $75k-100k)
IRA payment deduction: $2,154 (reported on 1.1% of returns)
79525:
$2,154
Texas:
$3,120
Total itemized deductions: $14,456 (27% of AGI, reported on 11.7% of returns)
Here:
$14,456
State:
$19,631
Here:
27.2% of AGI
State:
18.9% of AGI
(% of AGI for various income ranges: 7.1% for AGIs $10k-25k, 4.4% for AGIs $25k-50k, 6.2% for AGIs $50k-75k, 8.7% for AGIs $75k-100k)
Charity contributions deductions: $3,356 (6% of AGI, reported on 8.7% of returns)
Here:
$3,356
State:
$4,753
Here:
5.7% of AGI
State:
4.2% of AGI
(% of AGI for various income ranges: 1.0% for AGIs $10k-25k, 0.8% for AGIs $25k-50k, 1.0% for AGIs $50k-75k, 1.7% for AGIs $75k-100k)
Total tax: $3,405 (reported on 66.6% of returns)
79525:
$3,405
State:
$9,058
(% of AGI for various income ranges: 4.6% for AGIs below $10k, 3.4% for AGIs $10k-25k, 5.6% for AGIs $25k-50k, 7.8% for AGIs $50k-75k, 10.8% for AGIs $75k-100k, 18.4% for AGIs over 100k)
Earned income credit: $1,873 (reported on 25.9% of returns)
Here:
$1,873
State:
$2,024
Percentage of individuals using paid preparers for their 2004 taxes: 62.2%
Here:
62%
State:
57%
(% for various income ranges: 56.9% for AGIs below $10k, 67.1% for AGIs $10k-25k, 63.6% for AGIs $25k-50k, 55.8% for AGIs $50k-75k, 68.7% for AGIs $75k-100k, 68.8% for AGIs over 100k)
Household received Food Stamps/SNAP in the past 12 months: 23 Household did not receive Food Stamps/SNAP in the past 12 months: 1,201
Women who had a birth in the past 12 months: 17 (0 now married, 16 unmarried) Women who did not have a birth in the past 12 months: 565 (249 now married, 315 unmarried)
Housing units in zip code 79525 with a mortgage: 441 (52 second mortgage, 57 both second mortgage and home equity loan) Median monthly owner costs for units with a mortgage: $1,801 Median monthly owner costs for units without a mortgage: $556
Residents with income below the poverty level in 2022:
This zip code:
13.3%
Whole state:
14.0%
Residents with income below 50% of the poverty level in 2022:
This zip code:
8.3%
Whole state:
7.4%
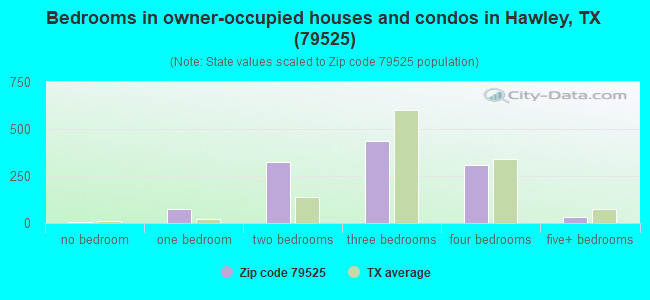
Median number of rooms in houses and condos:
Here:
5.7
State:
6.3
Median number of rooms in apartments:
Here:
5.5
State:
4.0
Notable locations in this zip code not listed on our city pages
Size of family households: 555 2-persons, 55 3-persons, 172 4-persons, 31 5-persons, 46 6-persons, 31 7-or-more-persons
Size of nonfamily households: 156 1-person, 188 2-persons
534 married couples with children.
56 single-parent households (56 women).
97.4% of residents of 79525 zip code speak English at home.
2.6% of residents speak Spanish at home (100% very well).
0.1% of residents speak other Indo-European language at home (100% very well).
Foreign born population: 2 (0.1%) (0.0% of them are naturalized citizens)
:
0.1%
Whole state:
17.2%
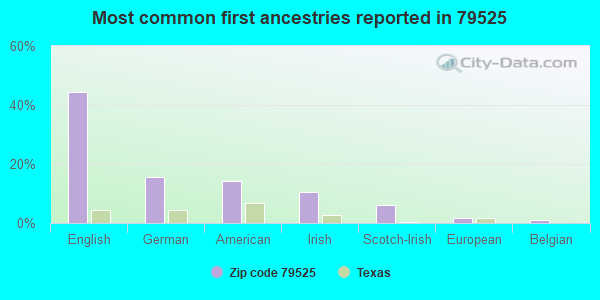
44%English
16%German
14%American
10%Irish
6%Scotch-Irish
2%European
1%Belgian
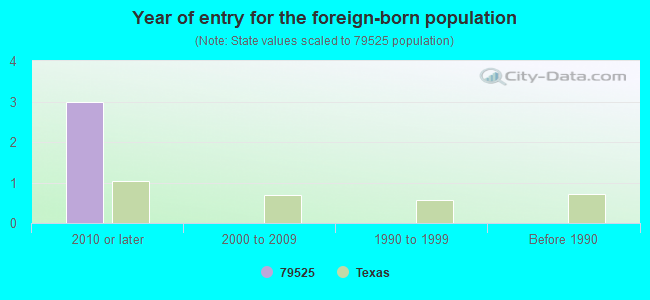
Year of entry for the foreign-born population
32010 or later
02000 to 2009
01990 to 1999
0Before 1990
Housing units lacking complete plumbing facilities: 3.7%
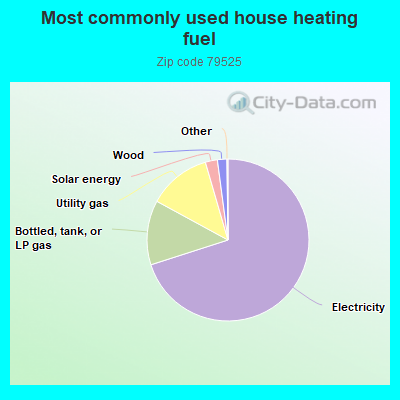
70.2%Electricity
12.9%Bottled, tank, or LP gas
12.6%Utility gas
2.4%Solar energy
1.9%Wood
Population in 1990: 4,405.
Place of birth for U.S.-born residents:
This state: 2,167
Northeast: 38
Midwest: 287
South: 135
West: 264
58% of the 79525 zip code residents lived in the same house 5 years ago. Out of people who lived in different houses, 35% lived in this county. Out of people who lived in different counties, 50% lived in Texas.
95% of the 79525 zip code residents lived in the same house 1 year ago. Out of people who lived in different houses, 64% moved from this county. Out of people who lived in different houses, 26% moved from different county within same state. Out of people who lived in different houses, 10% moved from different state.
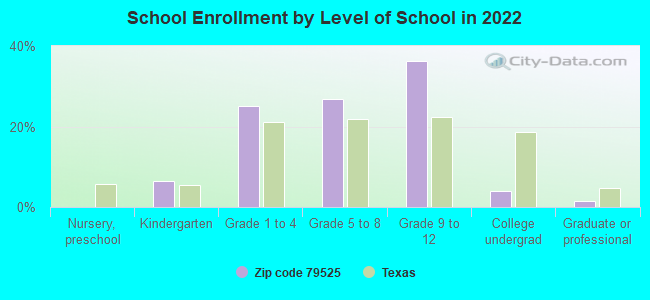
Private vs. public school enrollment:
Students in private schools in grades 1 to 8 (elementary and middle school): 91
Here:
27.5%
Texas:
8.8%
Students in private schools in grades 9 to 12 (high school): 71
Here:
29.7%
Texas:
8.0%
Students in private undergraduate colleges: 19
Here:
71.9%
Texas:
16.2%
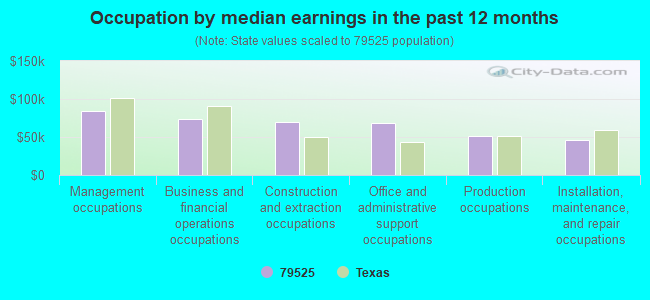
Occupation by median earnings in the past 12 months ($)
84,492Management occupations
73,663Business and financial operations occupations
70,284Construction and extraction occupations
68,582Office and administrative support occupations
51,149Production occupations
46,268Installation, maintenance, and repair occupations
Top industries in this zip code by the number of employees in 2005:
Other Services (except Public Administration): Religious Organizations (5-9 employees: 2 establishments, 1-4 employees: 1 establishment)
Finance and Insurance: Commercial Banking (5-9: 1, 1-4: 1)
Construction: Site Preparation Contractors (5-9: 1)
Utilities: Water Supply and Irrigation Systems (5-9: 1)
Health Care and Social Assistance: Child Day Care Services (5-9: 1)
Fatal accident statistics in 2012:
Fatal accident count: 2
Vehicles involved in fatal accidents: 3
Fatal accidents caused by drunken drivers: 1
Fatalities: 2
Persons involved in fatal accidents: 4
Pedestrians involved in fatal accidents: 0
2002 - 2011 National Fire Incident Reporting System (NFIRS) incidents
Based on the data from the years 2002 - 2011 the average number of fires per year is 40. The highest number of reported fire incidents - 83 took place in 2008, and the least - 26 in 2004. The data has a constant trend.
When looking into fire subcategories, the most reports belonged to: Outside Fires (74.1%), and Structure Fires (12.7%).
Fire incident types reported to NFIRS in Zip Code 79525


 Nearest zip codes: 79501, 79601, 79607, 79605, 79699, 79563.


 Based on the data from the years 2002 - 2011 the average number of fires per year is 40. The highest number of reported fire incidents - 83 took place in 2008, and the least - 26 in 2004. The data has a constant trend.
 When looking into fire subcategories, the most reports belonged to: Outside Fires (74.1%), and Structure Fires (12.7%).