Estimated zip code population in 2022: 25,835 Zip code population in 2010: 27,013 Zip code population in 2000: 25,578
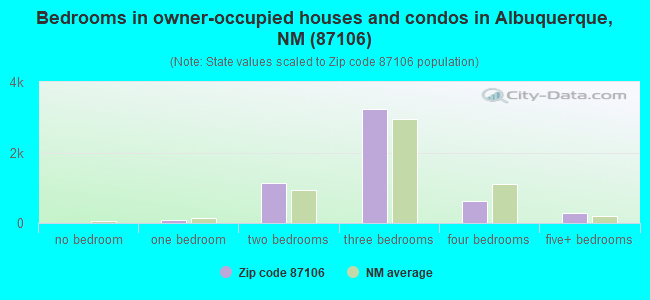
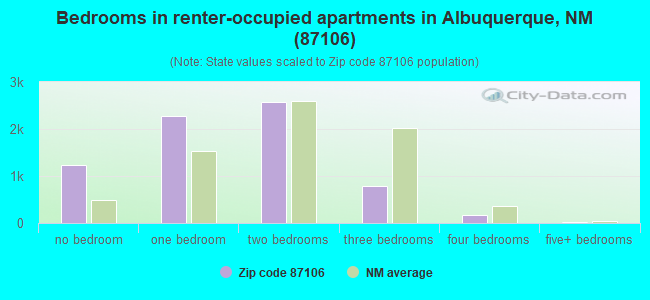
Houses and condos: 13,809 Renter-occupied apartments: 6,817
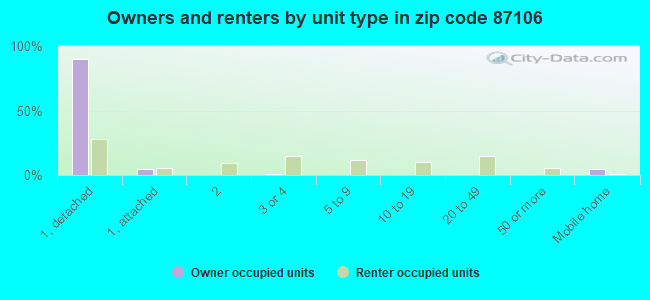
% of renters here:
56%
State:
29%
March 2022 cost of living index in zip code 87106: 95.5 (near average, U.S. average is 100)
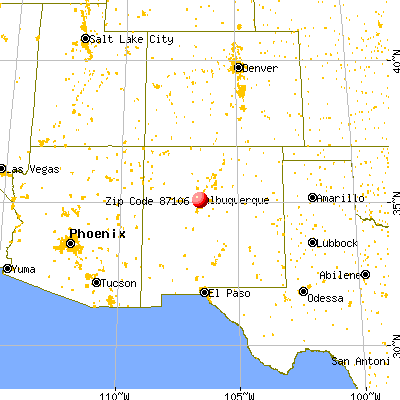
Land area: 10.6 sq. mi. Water area: 0.0 sq. mi.
Population density: 2,445 people per square mile
(low).
OSM Map
General Map
Google Map
MSN Map
OSM Map
General Map
Google Map
MSN Map
OSM Map
General Map
Google Map
MSN Map
OSM Map
General Map
Google Map
MSN Map
Please wait while loading the map...
Real estate property taxes paid for housing units in 2022:
This zip code:
0.8% ($2,869)
New Mexico:
0.7% ($1,638)
Median real estate property taxes paid for housing units with mortgages in 2022: $2,794 (0.8%) Median real estate property taxes paid for housing units with no mortgage in 2022: $2,893 (0.9%)
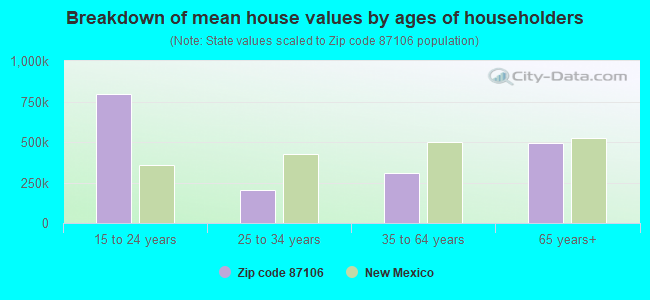
Estimated median house/condo value in 2022: $350,694
87106:
$350,694
New Mexico:
$243,100
According to our research of New Mexico and other state lists, there were 30 registered sex offenders living in 87106 zip code as of June 10, 2024. The ratio of all residents to sex offenders in zip code 87106 is 846 to 1. The ratio of registered sex offenders to all residents in this zip code is near the state average.
Median resident age:
This zip code:
32.9 years
New Mexico median age:
39.4 years
Average household size:
This zip code:
1.9 people
New Mexico:
2.4 people
Averages for the 2020 tax year for zip code 87106, filed in 2021:
Average Adjusted Gross Income (AGI) in 2020: $59,760 (Individual Income Tax Returns)
Here:
$59,760
State:
$59,146
Salary/wage: $49,628 (reported on 83.0% of returns)
Here:
$49,628
State:
$48,327
(% of AGI for various income ranges: 1176.6% for AGIs below $25k, 3580.4% for AGIs $25k-50k, 6388.6% for AGIs $50k-75k, 9613.0% for AGIs $75k-100k, 18568.2% for AGIs $100k-200k, 58691.5% for AGIs over 200k)
Taxable interest for individuals: $1,242 (reported on 32.0% of returns)
This zip code:
$1,242
New Mexico:
$1,616
(% of AGI for various income ranges: 10.4% for AGIs below $25k, 18.3% for AGIs $25k-50k, 50.7% for AGIs $50k-75k, 140.6% for AGIs $75k-100k, 199.9% for AGIs $100k-200k, 639.5% for AGIs over 200k)
Ordinary dividends: $6,241 (reported on 19.8% of returns)
Here:
$6,241
State:
$7,816
(% of AGI for various income ranges: 23.3% for AGIs below $25k, 38.6% for AGIs $25k-50k, 110.9% for AGIs $50k-75k, 318.6% for AGIs $75k-100k, 590.7% for AGIs $100k-200k, 2992.5% for AGIs over 200k)
Net capital gain/loss in AGI: +$15,356 (reported on 18.5% of returns)
Here:
+$15,356
State:
+$19,595
(% of AGI for various income ranges: 11.9% for AGIs below $25k, 43.2% for AGIs $25k-50k, 147.9% for AGIs $50k-75k, 333.6% for AGIs $75k-100k, 889.6% for AGIs $100k-200k, 11295.5% for AGIs over 200k)
Profit/loss from business: +$12,500 (reported on 15.3% of returns)
Here:
+$12,500
State:
+$11,430
(% of AGI for various income ranges: 77.7% for AGIs below $25k, 136.5% for AGIs $25k-50k, 240.0% for AGIs $50k-75k, 351.6% for AGIs $75k-100k, 905.1% for AGIs $100k-200k, 3044.0% for AGIs over 200k)
Taxable individual retirement arrangement distribution: $22,152 (reported on 6.4% of returns)
87106:
$22,152
New Mexico:
$20,970
(% of AGI for various income ranges: 17.0% for AGIs below $25k, 45.0% for AGIs $25k-50k, 142.4% for AGIs $50k-75k, 358.4% for AGIs $75k-100k, 770.6% for AGIs $100k-200k, 3270.0% for AGIs over 200k)
Self-employed (Keogh) retirement plans: $16,825 (reported on 0.7% of returns)
87106:
$16,825
New Mexico:
$20,997
(% of AGI for various income ranges: 5.8% for AGIs below $25k, 61.2% for AGIs $100k-200k, 361.5% for AGIs over 200k)
Total itemized deductions: $29,923 (reported on 6.3% of returns)
Here:
$29,923
State:
$33,187
(% of AGI for various income ranges: 21.2% for AGIs below $25k, 63.2% for AGIs $25k-50k, 227.1% for AGIs $50k-75k, 522.0% for AGIs $75k-100k, 927.2% for AGIs $100k-200k, 4379.0% for AGIs over 200k)
Charity contributions: $10,568 (reported on 4.9% of returns)
Here:
$10,568
State:
$11,850
(% of AGI for various income ranges: 8.5% for AGIs $25k-50k, 28.4% for AGIs $50k-75k, 101.6% for AGIs $75k-100k, 220.1% for AGIs $100k-200k, 1776.0% for AGIs over 200k)
Taxes paid: $7,522 (reported on 6.3% of returns)
87106:
$7,522
State:
$7,150
(% of AGI for various income ranges: 2.4% for AGIs below $25k, 13.0% for AGIs $25k-50k, 52.5% for AGIs $50k-75k, 142.6% for AGIs $75k-100k, 294.8% for AGIs $100k-200k, 975.5% for AGIs over 200k)
Earned income credit: $1,769 (reported on 16.4% of returns)
Here:
$1,769
State:
$2,323
(% of AGI for various income ranges: 64.6% for AGIs below $25k, 44.5% for AGIs $25k-50k)
Percentage of individuals using paid preparers for their 2020 taxes: 92.3%
Here:
92%
State:
92%
(% for various income ranges: 91.4% for AGIs below $25k, 92.9% for AGIs $25k-50k, 92.3% for AGIs $50k-75k, 91.4% for AGIs $75k-100k, 94.6% for AGIs $100k-200k, 92.6% for AGIs over 200k)
Averages for the 2012 tax year for zip code 87106, filed in 2013:
Average Adjusted Gross Income (AGI) in 2012: $48,178 (Individual Income Tax Returns)
Here:
$48,178
State:
$50,343
Salary/wage: $39,697 (reported on 85.6% of returns)
Here:
$39,697
State:
$41,171
(% of AGI for various income ranges: 84.2% for AGIs below $25k, 82.9% for AGIs $25k-50k, 72.3% for AGIs $50k-75k, 74.4% for AGIs $75k-100k, 70.6% for AGIs $100k-200k, 50.7% for AGIs over 200k)
Taxable interest for individuals: $1,314 (reported on 30.0% of returns)
This zip code:
$1,314
New Mexico:
$1,677
(% of AGI for various income ranges: 0.8% for AGIs below $25k, 0.7% for AGIs $25k-50k, 1.0% for AGIs $50k-75k, 0.7% for AGIs $75k-100k, 0.6% for AGIs $100k-200k, 1.1% for AGIs over 200k)
Ordinary dividends: $5,173 (reported on 19.4% of returns)
Here:
$5,173
State:
$6,939
(% of AGI for various income ranges: 1.6% for AGIs below $25k, 1.1% for AGIs $25k-50k, 2.1% for AGIs $50k-75k, 1.8% for AGIs $75k-100k, 2.4% for AGIs $100k-200k, 2.9% for AGIs over 200k)
Net capital gain/loss in AGI: +$10,186 (reported on 15.3% of returns)
Here:
+$10,186
State:
+$14,311
(% of AGI for various income ranges: 0.1% for AGIs below $25k, 0.5% for AGIs $25k-50k, 0.7% for AGIs $50k-75k, 1.0% for AGIs $75k-100k, 2.6% for AGIs $100k-200k, 10.2% for AGIs over 200k)
Profit/loss from business: +$12,324 (reported on 15.3% of returns)
Here:
+$12,324
State:
+$11,059
(% of AGI for various income ranges: 5.6% for AGIs below $25k, 3.1% for AGIs $25k-50k, 4.2% for AGIs $50k-75k, 3.6% for AGIs $75k-100k, 3.0% for AGIs $100k-200k, 4.6% for AGIs over 200k)
Taxable individual retirement arrangement distribution: $17,038 (reported on 7.2% of returns)
87106:
$17,038
New Mexico:
$15,706
(% of AGI for various income ranges: 1.2% for AGIs below $25k, 1.4% for AGIs $25k-50k, 1.9% for AGIs $50k-75k, 2.2% for AGIs $75k-100k, 3.3% for AGIs $100k-200k, 3.8% for AGIs over 200k)
Self-employment retirement plans: $14,360 (reported on 0.9% of returns)
87106:
$14,360
New Mexico:
$18,209
(% of AGI for various income ranges: 0.3% for AGIs $25k-50k, 0.5% for AGIs $75k-100k, 0.7% for AGIs over 200k)
Total itemized deductions: $20,453 (17% of AGI, reported on 23.2% of returns)
Here:
$20,453
State:
$21,709
Here:
17.5% of AGI
State:
19.8% of AGI
(% of AGI for various income ranges: 4.8% for AGIs below $25k, 6.9% for AGIs $25k-50k, 10.8% for AGIs $50k-75k, 12.1% for AGIs $75k-100k, 12.2% for AGIs $100k-200k, 10.6% for AGIs over 200k)
Charity contributions: $3,548 (reported on 18.5% of returns)
Here:
$3,548
State:
$4,195
(% of AGI for various income ranges: 0.4% for AGIs below $25k, 0.7% for AGIs $25k-50k, 1.1% for AGIs $50k-75k, 1.5% for AGIs $75k-100k, 1.7% for AGIs $100k-200k, 2.2% for AGIs over 200k)
Taxes paid: $7,053 (reported on 23.1% of returns)
87106:
$7,053
State:
$6,176
(% of AGI for various income ranges: 0.9% for AGIs below $25k, 1.6% for AGIs $25k-50k, 2.9% for AGIs $50k-75k, 3.6% for AGIs $75k-100k, 4.6% for AGIs $100k-200k, 5.0% for AGIs over 200k)
Earned income credit: $1,718 (reported on 20.1% of returns)
Here:
$1,718
State:
$2,311
(% of AGI for various income ranges: 4.9% for AGIs below $25k, 0.7% for AGIs $25k-50k)
Percentage of individuals using paid preparers for their 2012 taxes: 38.7%
Here:
39%
State:
50%
(% for various income ranges: 32.3% for AGIs below $25k, 36.9% for AGIs $25k-50k, 43.6% for AGIs $50k-75k, 47.8% for AGIs $75k-100k, 57.1% for AGIs $100k-200k, 73.3% for AGIs over 200k)
Averages for the 2004 tax year for zip code 87106, filed in 2005:
Average Adjusted Gross Income (AGI) in 2004: $37,172 (Individual Income Tax Returns)
Here:
$37,172
State:
$39,572
Salary/wage: $31,521 (reported on 86.1% of returns)
Here:
$31,521
State:
$34,237
(% of AGI for various income ranges: 107.4% for AGIs below $10k, 84.7% for AGIs $10k-25k, 82.6% for AGIs $25k-50k, 76.1% for AGIs $50k-75k, 74.4% for AGIs $75k-100k, 58.6% for AGIs over 100k)
Taxable interest for individuals: $1,531 (reported on 38.1% of returns)
This zip code:
$1,531
New Mexico:
$1,873
(% of AGI for various income ranges: 2.5% for AGIs below $10k, 1.7% for AGIs $10k-25k, 1.3% for AGIs $25k-50k, 2.0% for AGIs $50k-75k, 1.7% for AGIs $75k-100k, 1.4% for AGIs over 100k)
Taxable dividends: $4,297 (reported on 22.9% of returns)
Here:
$4,297
State:
$3,554
(% of AGI for various income ranges: 2.6% for AGIs below $10k, 1.3% for AGIs $10k-25k, 1.4% for AGIs $25k-50k, 1.9% for AGIs $50k-75k, 1.7% for AGIs $75k-100k, 4.4% for AGIs over 100k)
Net capital gain/loss: +$10,620 (reported on 17.8% of returns)
Here:
+$10,620
State:
+$10,425
(% of AGI for various income ranges: -1.3% for AGIs below $10k, 0.3% for AGIs $10k-25k, 0.9% for AGIs $25k-50k, 1.3% for AGIs $50k-75k, 1.6% for AGIs $75k-100k, 12.4% for AGIs over 100k)
Profit/loss from business: +$10,478 (reported on 14.1% of returns)
Here:
+$10,478
State:
+$8,875
(% of AGI for various income ranges: 3.5% for AGIs below $10k, 3.5% for AGIs $10k-25k, 2.5% for AGIs $25k-50k, 2.9% for AGIs $50k-75k, 4.6% for AGIs $75k-100k, 5.3% for AGIs over 100k)
IRA payment deduction: $2,706 (reported on 2.5% of returns)
87106:
$2,706
New Mexico:
$2,940
(% of AGI for various income ranges: 0.2% for AGIs below $10k, 0.2% for AGIs $10k-25k, 0.3% for AGIs $25k-50k, 0.2% for AGIs $50k-75k, 0.2% for AGIs $75k-100k, 0.1% for AGIs over 100k)
Self-employed pension: $11,663 (reported on 1.0% of returns)
Here:
$11,663
New Mexico:
$13,110
(% of AGI for various income ranges: 0.1% for AGIs $10k-25k, 0.1% for AGIs $25k-50k, 0.2% for AGIs $50k-75k, 0.4% for AGIs $75k-100k, 0.6% for AGIs over 100k)
Total itemized deductions: $15,252 (19% of AGI, reported on 27.5% of returns)
Here:
$15,252
State:
$18,103
Here:
18.9% of AGI
State:
21.5% of AGI
(% of AGI for various income ranges: 6.6% for AGIs below $10k, 5.9% for AGIs $10k-25k, 9.4% for AGIs $25k-50k, 13.7% for AGIs $50k-75k, 14.8% for AGIs $75k-100k, 12.7% for AGIs over 100k)
Charity contributions deductions: $3,197 (3% of AGI, reported on 21.1% of returns)
Here:
$3,197
State:
$3,246
Here:
3.4% of AGI
State:
3.6% of AGI
(% of AGI for various income ranges: 0.3% for AGIs below $10k, 0.5% for AGIs $10k-25k, 1.1% for AGIs $25k-50k, 1.6% for AGIs $50k-75k, 2.2% for AGIs $75k-100k, 2.8% for AGIs over 100k)
Total tax: $6,182 (reported on 72.0% of returns)
87106:
$6,182
State:
$6,237
(% of AGI for various income ranges: 2.2% for AGIs below $10k, 4.4% for AGIs $10k-25k, 8.0% for AGIs $25k-50k, 10.8% for AGIs $50k-75k, 12.0% for AGIs $75k-100k, 18.3% for AGIs over 100k)
Earned income credit: $1,304 (reported on 17.6% of returns)
Here:
$1,304
State:
$1,796
Percentage of individuals using paid preparers for their 2004 taxes: 44.0%
Here:
44%
State:
57%
(% for various income ranges: 38.6% for AGIs below $10k, 44.0% for AGIs $10k-25k, 41.9% for AGIs $25k-50k, 48.7% for AGIs $50k-75k, 48.4% for AGIs $75k-100k, 61.6% for AGIs over 100k)
Likely homosexual households (counted as self-reported same-sex unmarried-partner households)
Lesbian couples: 0.5% of all households
Gay men: 0.2% of all households
Household received Food Stamps/SNAP in the past 12 months: 2,389 Household did not receive Food Stamps/SNAP in the past 12 months: 10,160
Women who had a birth in the past 12 months: 207 (175 now married, 47 unmarried) Women who did not have a birth in the past 12 months: 7,545 (1,603 now married, 5,996 unmarried)
Housing units in zip code 87106 with a mortgage: 3,285 (181 second mortgage, 29 home equity loan, 100 both second mortgage and home equity loan) Houses without a mortgage: 128
Median monthly owner costs for units with a mortgage: $1,717 Median monthly owner costs for units without a mortgage: $526
Residents with income below the poverty level in 2022:
This zip code:
22.2%
Whole state:
17.6%
Residents with income below 50% of the poverty level in 2022:
This zip code:
10.6%
Whole state:
9.7%
Median number of rooms in houses and condos:
Here:
6.6
State:
5.9
Median number of rooms in apartments:
Here:
3.5
State:
4.2
Notable locations in this zip code not listed on our city pages
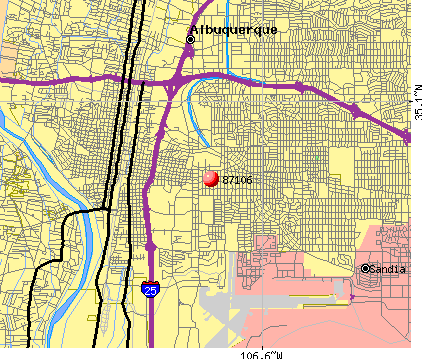
Notable locations in zip code 87106: Milne Stadium (A), Albuquerque Sports Stadium (B), University of New Mexico Stadium (C), University of New Mexico Arena (D), United States Forest Service Tanker Base (E), Circle Six Gun Club (F), Pi Kappa Alpha Estufa Historic Site (G), Gazebo Building (H), Johnson Center Building (I), Hokona Hall Dormitory (J), Human Resources Annex (K), Industrial Arts Building (L), Jonson Gallery (M), Laguna Hall Dormitory (N), Latin American Institute Building (O), Manzanita Center (P), Math Annex Building (Q), Mechanical Engineering Building (R), Mitchell Hall (S), Naval Science Building (T). Display/hide their locations on the map
Churches in zip code 87106 include: First Congregational Church (A), Girard Church (B), Monte Vista Christian Church (C), Saint Marks-on-the-Mesa Episcopal Church (D). Display/hide their locations on the map
Parks in zip code 87106 include: Netherwood Park (1), Bataan Park (2), Burton Park (3), Urban Forest (4), Hyder Park (5), Summit Park (6), Wellesley Park (7), Roosevelt Park (8), Yale Park (9). Display/hide their locations on the map
Tourist attractions (not listed on the city page) : Johnson Gallery (Museums; 1909 Las Lomas Road Northeast), Schools-Public - Albuquerque Public Schools- Administration Directory (Cultural Attractions- Events- & Facilities; 930 Oak Street Southeast Suite B), Mountain Aviation Enterprises Limited (Tours & Charters; 2502 Clark Carr Loop Southeast).
1,654 married couples with children.
1,475 single-parent households (544 men, 931 women).
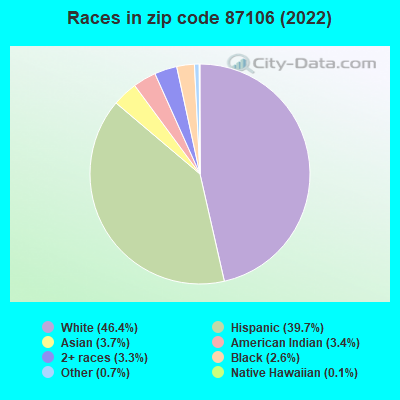
78.1% of residents of 87106 zip code speak English at home.
15.9% of residents speak Spanish at home (72% very well, 14% well, 11% not well, 3% not at all).
3.2% of residents speak other Indo-European language at home (88% very well, 11% well, 1% not well).
2.7% of residents speak Asian or Pacific Island language at home (68% very well, 13% well, 14% not well, 6% not at all).
1.1% of residents speak other language at home (91% very well, 4% well, 5% not well).
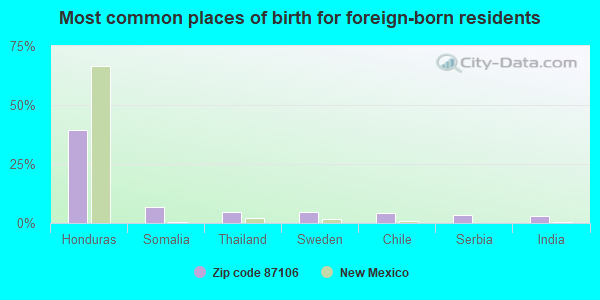
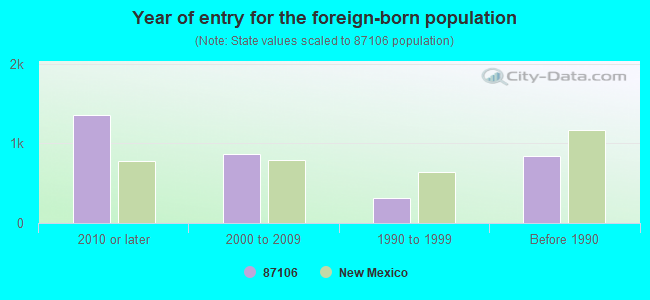
Foreign born population: 2,993 (11.6%) (45.4% of them are naturalized citizens)
Major facilities with environmental interests located in this zip code:
HIGH TECH CHARTER SCHOOL (2500 YALE BLVD., SE, SUITE 200 in ALBUQUERQUE, NM)
(Integrated Compliance Information System) - ICIS-06-2006-6038, ENFORCEMENT/COMPLIANCE ACTIVITY FORMAL ENFORCEMENT ACTION (Integrated Compliance Information System) - ICIS-06-2006-6038, ENFORCEMENT/COMPLIANCE ACTIVITY
ROBERT F. KENNEDY CHARTER HIGH SCHOOL (1511 CENTRAL AVE., NE AND 1215 HAZELDINE ST., SE in ALBUQUERQUE, NM)
(Integrated Compliance Information System) - ICIS-06-2006-6036, ENFORCEMENT/COMPLIANCE ACTIVITY FORMAL ENFORCEMENT ACTION (Integrated Compliance Information System) - ICIS-06-2006-6036, ENFORCEMENT/COMPLIANCE ACTIVITY Business SIC classification: ELEMENTARY AND SECONDARY SCHOOLS
APS JEFFERSON MIDDLE SCHOOL (712 GIRARD BLVD NE in ALBUQUERQUE, NM)
AIR MINOR (AIRS/AFS) (National Center for Education Statistics) - STATE ID-01011425 Business SIC classification: ELEMENTARY AND SECONDARY SCHOOLS Organizations: ALBUQUERQUE PUBLIC SCHOOLS (SCHOOL DISTRICT)
APS MONTE VISTA ELEMENTARY SCHOOL (3211 MONTE VISTA BOULEVARD NORTHEAST in ALBUQUERQUE, NM)
AIR MINOR (AIRS/AFS) (National Center for Education Statistics) - STATE ID-01011312 Business SIC classification: ELEMENTARY AND SECONDARY SCHOOLS Organizations: ALBUQUERQUE PUBLIC SCHOOLS (SCHOOL DISTRICT)
ETHICON INC (3801 UNIVERSITY BLVD. in ALBUQUERQUE, NM)
AIR MINOR (AIRS/AFS) PERFORMANCE TRACK (National Environmental Performance Track) HAZARDOUS WASTE BIENNIAL REPORTER (Resource Conservation and Recovery Act (tracking hazardous waste)) Small Quantity Generators, between 100 kg and 1000 kg of hazardous waste/month (Resource Conservation and Recovery Act (tracking hazardous waste)) - notification TRI REPORTER (Tracking of toxic chemicals releasing facilities) Business SIC classification: SURGICAL AND MEDICAL INSTRUMENTS AND APPARATUS; ORTHOPEDIC, PROSTHETIC, AND SURGICAL APPLIANCES AND SUPPLIES Business NAICS classification: SURGICAL AND MEDICAL INSTRUMENT MANUFACTURING. Organizations: JOHNSON & JOHNSON (CONTACT/OPERATOR)
, ETHICON ENDO SURGERY INC (CONTACT/OWNER)
Alternative names: ETHICON ENDO SURGERY INC
ALBUQUERQUE (CITY OF) - SUNTRAN FACILITY (601 YALE BLVD SE in ALBUQUERQUE, NM)
AIR MINOR (AIRS/AFS) ENFORCEMENT/COMPLIANCE ACTIVITY (Integrated Compliance Information System) (Resource Conservation and Recovery Act (tracking hazardous waste)) Business SIC classification: LOCAL AND SUBURBAN TRANSIT Organizations: CITY OF ALBUQUERQUE (CONTACT/OPERATOR)
, CITY ALBUQUERQUE (CONTACT/OWNER)
Alternative names: CITY OF ALBUQUERQUE SUNTRAN FACILITY, SUNTRAN OF ALBUQUERQUE, TRANSIT DEPT. MAINTENANCE FAC.
BANDELIER ELEMENTARY (3309 PERSHING SE in ALBUQUERQUE, NM)
(National Center for Education Statistics) - STATE ID-01011222 Organizations: ALBUQUERQUE PUBLIC SCHOOLS (SCHOOL DISTRICT)
CESS (725 UNIVERSITY SE in ALBUQUERQUE, NM)
(National Center for Education Statistics) - STATE ID-01011040 Organizations: ALBUQUERQUE PUBLIC SCHOOLS (SCHOOL DISTRICT)
ECLIPSE AVIATION CORPORATION (2503 CLARK CARR LOOP SE in ALBUQUERQUE, NM)
AIR MINOR (AIRS/AFS) Conditionally Exempt Small Quantity Generators, less than 100 kg/month of hazardous waste (Resource Conservation and Recovery Act (tracking hazardous waste)) Business SIC and NAICS classification: AIRCRAFT Organizations: CITY OF ALBUQUERQUE (CONTACT/OPERATOR)
APS SUPERINTENDENT CENTRAL OFFICE (725 UNIVERSITY SE in ALBUQUERQUE, NM)
AIR MINOR (AIRS/AFS) COMPLIANCE ACTIVITY (Tracking inspections of insecticide, fungicide, and rodenticide, and toxic substances) Conditionally Exempt Small Quantity Generators, less than 100 kg/month of hazardous waste (Resource Conservation and Recovery Act (tracking hazardous waste)) - notification Business SIC classification: ELEMENTARY AND SECONDARY SCHOOLS Organizations: ALBUQUERQUE ISD (CONTACT/OWNER)
Alternative names: ALBUQUERQUE ISD, ALBUQUERQUE SCHOOLS, ALBUQUERQUE SCHOOL DISTRICT
KIRTLAND ELEMENTARY (3530 GIBSON BLVD SE in ALBUQUERQUE, NM)
(National Center for Education Statistics) - STATE ID-01011279 Organizations: ALBUQUERQUE PUBLIC SCHOOLS (SCHOOL DISTRICT)
LOWELL ELEMENTARY (1700 SUNSHINE TR SE in ALBUQUERQUE, NM)
(National Center for Education Statistics) - STATE ID-01011300 Organizations: ALBUQUERQUE PUBLIC SCHOOLS (SCHOOL DISTRICT)
ALBUQUERQUE CLEANERS INC DBA ABQ CLEANER (3002 MONTE VISTA BLVD in ALBUQUERQUE, NM)
AIR MINOR (AIRS/AFS) Small Quantity Generators, between 100 kg and 1000 kg of hazardous waste/month (Resource Conservation and Recovery Act (tracking hazardous waste)) - notification Business SIC classification: GARMENT PRESSING, AND AGENTS FOR LAUNDRIES AND DRYCLEANERS Organizations: LEBEAU J&G & BECKER M (CONTACT/OPERATOR)
, GILLANI ZUL (CONTACT/OWNER)
Alternative names: ABQ CLEANERS INC
Housing units lacking complete plumbing facilities: 0.9% Housing units lacking complete kitchen facilities: 1.7%
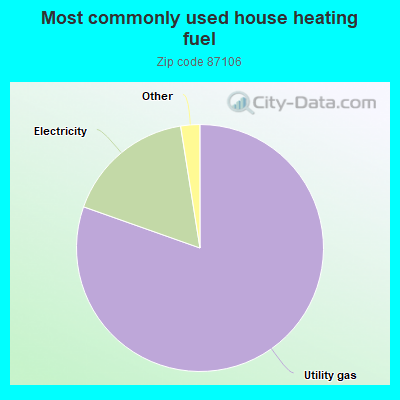
80.5%Utility gas
17.1%Electricity
0.9%Wood
0.8%Bottled, tank, or LP gas
Population in 1990: 26,482.
Place of birth for U.S.-born residents:
This state: 11,956
Northeast: 1,771
Midwest: 2,632
South: 2,444
West: 3,765
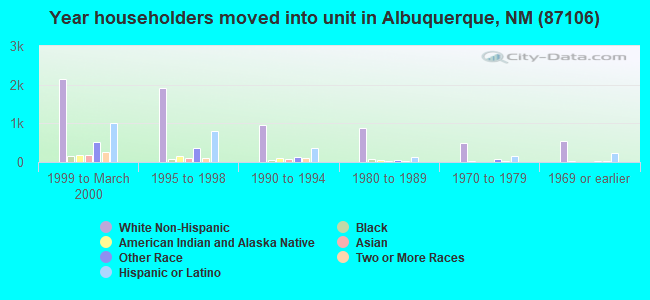
41% of the 87106 zip code residents lived in the same house 5 years ago. Out of people who lived in different houses, 50% lived in this county. Out of people who lived in different counties, 50% lived in New Mexico.
82% of the 87106 zip code residents lived in the same house 1 year ago. Out of people who lived in different houses, 60% moved from this county. Out of people who lived in different houses, 11% moved from different county within same state. Out of people who lived in different houses, 23% moved from different state. Out of people who lived in different houses, 2% moved from abroad.
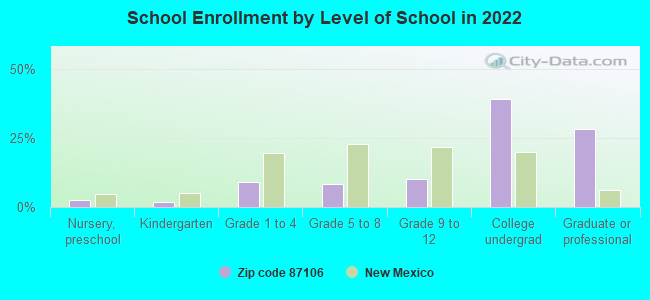
Private vs. public school enrollment:
Students in private schools in grades 1 to 8 (elementary and middle school): 125
Here:
8.2%
New Mexico:
10.2%
Students in private schools in grades 9 to 12 (high school): 94
Here:
10.6%
New Mexico:
10.0%
Students in private undergraduate colleges: 204
Here:
6.1%
New Mexico:
12.3%
Occupation by median earnings in the past 12 months ($)
86,599Computer and mathematical occupations
83,852Legal occupations
67,044Architecture and engineering occupations
63,546Health diagnosing and treating practitioners and other technical occupations
62,847Management occupations
61,851Law enforcement workers including supervisors
Companies with biggest federal contracts located in this zip code (ALBUQUERQUE, NM):
A-TECH CORPORATION (1900 RANDOLPH ROAD SE; small business) : $32,970,439 in 218 contractsfrom 2000 to 2006
Contracts for Defense Missile and Space Systems -- Basic Research (R&D), Weapons -- Applied Research and Exploratory Development (R&D), Other Defense -- Applied Research and Exploratory Development (R&D), Defense Missile and Space Systems -- Applied Research and Exploratory Development (R&D), and moreby Air Force, Missile Defense Agency, Army, NASA, and others Signed by year:2000: $1,000,218; 2001: $2,219,543; 2002: $3,134,583; 2003: $5,494,848; 2004: $9,106,409; 2005: $4,539,485; 2006: $7,475,353.
Biggest contracts:
$3,000,000 with Air Force for Defense Missile and Space Systems -- Basic Research (R&D). Signed on 2004-01-07. Completion date: 2005-01-04.
$1,903,544, same as above.Signed on 2003-04-07. Completion date: 2004-02-02.
$1,500,000, same as above.Signed on 2004-11-29. Completion date: 2005-11-30.
$1,473,299, same as above.Signed on 2004-12-13. Completion date: 2005-11-30.
ORION INTERNATIONAL TECHNOLOGI (2201 BUENA VISTA DR SE STE; small business) : $25,824,677 in 75 contractsfrom 1999 to 2006
Contracts for Maintenance, Repair and Rebuilding of Equipment -- Communication, Detection, and Coherent Radiation Equipment, Services -- Basic Research (R&D), Weapons -- Management and Support (R&D), Weapons -- Operational Systems Development (R&D), and moreby Navy, Army, Air Force, ENERGY, Department of, and others Signed by year:2000: $5,530,852; 2001: $2,958,244; 2002: $6,078,516; 2003: $9,408,296; 2004: $163,270; 2005: -$90,882; 2006: $99,998.
Biggest contracts:
$6,438,620 with Navy for Maintenance, Repair and Rebuilding of Equipment -- Communication, Detection, and Coherent Radiation Equipment. Signed on 2003-09-10. Completion date: 2003-05-31.
$1,576,385 with Army for Services -- Basic Research (R&D). Signed on 1999-11-19. Completion date: 1999-11-22.
$1,445,000 with Air Force for Weapons -- Management and Support (R&D). Signed on 2002-04-30. Completion date: 2004-04-13.
$1,420,701 with Army for Services -- Basic Research (R&D). Signed on 2002-12-17. Completion date: 2003-11-19.
ACME WORLDWIDE ENTERPRISES, IN (1710 RANDOLPH COURT, SE; small business) : $12,663,624 in 39 contractsfrom 2001 to 2006
Contracts for Maintenance, Repair and Rebuilding of Equipment -- Training Aids and Devices, Locomotive and Rail Car Accessories and Components, Training Aids, Installation of Equipment -- Training Aids and Devices, and moreby Air Force, Research and Innovative Technology Administration, Navy Signed by year:2000: $0; 2001: $971,589; 2002: $906,075; 2003: $2,205,256; 2004: $6,226,710; 2005: $1,481,995; 2006: $871,999.
Biggest contracts:
$4,066,867 with Air Force for Maintenance, Repair and Rebuilding of Equipment -- Training Aids and Devices. Signed on 2004-09-24. Completion date: 2006-01-31.
$1,129,305 with Research and Innovative Technology Administration for Locomotive and Rail Car Accessories and Components. Signed on 2003-12-29. Completion date: 2004-10-30.
$916,408 with Navy for Maintenance, Repair and Rebuilding of Equipment -- Training Aids and Devices. Signed on 2003-05-15. Completion date: 2004-04-30.
$637,315, same as above.Signed on 2001-02-16. Completion date: 2002-02-15.
MZA ASSOCIATES CORPORATION (2021 GIRARD SE, SUITE 150; small business) : $10,923,175 in 84 contractsfrom 1999 to 2006
Contracts for Weapons -- Basic Research (R&D), Weapons -- Advanced Development (R&D), Weapons -- Applied Research and Exploratory Development (R&D), Other Defense -- Advanced Development (R&D), and moreby Air Force, Navy Signed by year:2000: $1,090,783; 2001: $1,564,646; 2002: $1,653,163; 2003: $1,044,285; 2004: $1,291,961; 2005: $2,544,861; 2006: $1,168,476.
Biggest contracts:
$950,000 with Air Force for Weapons -- Basic Research (R&D). Signed on 2005-06-29. Completion date: 2005-11-10.
$499,992 with Air Force for Weapons -- Advanced Development (R&D). Signed on 2002-05-31. Completion date: 2003-12-31.
$450,000, same as above.Signed on 1999-12-29. Completion date: 2001-03-30.
$449,628 with Navy for Weapons -- Applied Research and Exploratory Development (R&D). Signed on 2005-09-06. Completion date: 2007-01-20.
MAXWELL TECHNOLOGIES, INC (2501 YALE BLVD SE STE 300) : $8,687,945 in 57 contractsfrom 1999 to 2004
Contracts for Weapons -- Advanced Development (R&D), Weapons -- Operational Systems Development (R&D), Defense Missile and Space Systems -- Advanced Development (R&D), Weapons -- Applied Research and Exploratory Development (R&D) by Air Force Signed by year:2000: $3,001,737; 2001: $3,711,503; 2002: $47,650; 2003: $0; 2004: $19,600; 2005: $0; 2006: $0.
Biggest contracts:
$1,300,000 with Air Force for Weapons -- Advanced Development (R&D). Signed on 2001-02-14. Completion date: 2001-04-16.
$950,000, same as above.Signed on 2000-03-08. Completion date: 2001-01-31.
$900,000, same as above.Signed on 2001-01-02. Completion date: 2001-03-31.
$800,000, same as above.Signed on 2000-05-30. Completion date: 2001-01-31.
PERKINELMER, INC (2450 ALAMO AVE SE) : $2,623,777 in 7 contractsfrom 1999 to 2005
Contracts for Other Research and Development -- Operational Systems Development (R&D), Radio and Television Communication Equipment, Except Airborne, Maintenance, Repair and Rebuilding of Equipment -- Automatic Data Processing Equipment (Including Firmware), Software, Supplies and Support Equipment by Army, Air Force Signed by year:2000: $2,624,975; 2001: $0; 2002: $0; 2003: $0; 2004: $0; 2005: -$42,338; 2006: $0.
Biggest contracts:
$1,800,000 with Army for Other Research and Development -- Operational Systems Development (R&D). Signed on 2000-01-19. Completion date: 2002-03-30.
$364,973 with Air Force for Radio and Television Communication Equipment, Except Airborne. Signed on 2000-05-17. Completion date: 2001-07-27.
$217,737, same as above.Signed on 2000-01-19. Completion date: 2001-07-27.
$208,043 with Air Force for Maintenance, Repair and Rebuilding of Equipment -- Automatic Data Processing Equipment (Including Firmware), Software, Supplies and Support Equipment. Taking place in OK. Signed on 2000-01-18. Completion date: 2001-09-30.
MICHAEL H FRESE (2309 RENARD PL SE STE 220; small business) : $2,111,050 in 24 contractsfrom 1999 to 2006
Contracts for Weapons -- Management and Support (R&D), Weapons -- Advanced Development (R&D), Other Research and Development -- Applied Research and Exploratory Development (R&D), Weapons -- Applied Research and Exploratory Development (R&D), and moreby Air Force, Navy, Department of Defense Signed by year:2000: $171,862; 2001: $0; 2002: $99,998; 2003: $194,999; 2004: $174,999; 2005: $773,999; 2006: $509,000.
Biggest contracts:
$375,000 with Air Force for Weapons -- Management and Support (R&D). Signed on 2006-04-07. Completion date: 2008-07-07.
$218,000 with Air Force for Weapons -- Advanced Development (R&D). Signed on 2005-11-29. Completion date: 2009-11-30.
$194,999 with Navy for Other Research and Development -- Applied Research and Exploratory Development (R&D). Signed on 2003-07-10. Completion date: 2004-09-30.
$180,000 with Air Force for Weapons -- Applied Research and Exploratory Development (R&D). Signed on 2005-02-25. Completion date: 2007-05-21.
UNIVERSITY OF NEW MEXICO (1717 LOMAS BLVD NE) : $2,060,494 in 32 contractsfrom 2000 to 2006
Contracts for Archeological/Paleontological Studies, Air Quality Analyses, Biomedical -- Applied Research and Exploratory Development (R&D), AIDS Research -- Applied Research and Exploratory Development (R&D) by Army, U.S. Army Corps of Engineers - civil program financing only, National Institutes of Health Signed by year:2000: $156,402; 2001: $143,721; 2002: $266,972; 2003: $76,844; 2004: $655,827; 2005: $767,908; 2006: -$7,180.
Biggest contracts:
$266,972 with Army for Archeological/Paleontological Studies. Signed on 2002-09-30. Completion date: 2003-03-24.
$262,895 with U.S. Army Corps of Engineers - civil program financing only for Archeological/Paleontological Studies. Signed on 2005-08-05. Completion date: 2005-09-30.
$262,895 with Army for Archeological/Paleontological Studies. Signed on 2005-08-05. Completion date: 2005-09-30.
$245,022, same as above.Signed on 2004-03-03. Completion date: 2004-09-03.
SCIENCE APPLICATIONS INTERNATI (2109 AIRPARK RD SE) : $2,016,077 in 36 contractsfrom 2000 to 2006
Contracts for Other Environmental Services, Studies, and Analytical Support, Development of Environmental Impact Statements and Assessments, Hazardous Substance Analysis, Hazardous Substance Removal, Cleanup, and Disposal Services and Operational Support by Army, U.S. Army Corps of Engineers - civil program financing only, Forest Service, Bureau of Land Management, and others Signed by year:2000: $398,816; 2001: $334,290; 2002: $175,493; 2003: $282,090; 2004: $667,964; 2005: $84,953; 2006: $72,471.
Biggest contracts:
$226,471 with Army for Other Environmental Services, Studies, and Analytical Support. Signed on 2004-06-04. Completion date: 2004-07-21.
$226,471 with U.S. Army Corps of Engineers - civil program financing only for Other Environmental Services, Studies, and Analytical Support. Signed on 2004-06-04. Completion date: 2004-07-21.
$158,936 with Army for Other Environmental Services, Studies, and Analytical Support. Signed on 2000-12-20. Completion date: 2001-06-29.
$121,468 with U.S. Army Corps of Engineers - civil program financing only for Development of Environmental Impact Statements and Assessments. Signed on 2000-12-20. Completion date: 2001-06-29.
NEW MEXICO INDUSTRIES FOR THE (2200 YALE BLVD , SE) : $1,648,358 in 9 contractsfrom 2000 to 2006
Contracts for Maintenance, Repair and Rebuilding of Equipment -- Communication, Detection, and Coherent Radiation Equipment, Operation of Government-Owned Facilities -- Electronic and Communications Facilities by Air Force Signed by year:2000: $239,484; 2001: $270,047; 2002: $280,208; 2003: $282,142; 2004: $284,076; 2005: $285,658; 2006: $6,743.
Biggest contracts:
$285,658 with Air Force for Maintenance, Repair and Rebuilding of Equipment -- Communication, Detection, and Coherent Radiation Equipment. Signed on 2005-10-01. Completion date: 2006-09-30.
$284,076, same as above.Signed on 2004-10-01. Completion date: 2005-09-30.
$282,142, same as above.Signed on 2003-10-01. Completion date: 2006-09-30.
$280,208, same as above.Signed on 2002-10-01. Completion date: 2003-09-30.
Top industries in this zip code by the number of employees in 2005:
Health Care and Social Assistance: General Medical and Surgical Hospitals (over 1000 employees: 1 establishment, 500-999 employees: 1 establishment, 100-249 employees: 1 establishment)
Health Care and Social Assistance: Offices of Physicians (except Mental Health Specialists) (100-249: 1, 50-99: 2, 20-49: 2, 10-19: 9, 5-9: 8, 1-4: 18)
Professional, Scientific, and Technical Services: Research and Development in the Physical, Engineering, and Life Sciences (100-249: 1, 20-49: 7, 10-19: 4, 5-9: 10, 1-4: 8)
Health Care and Social Assistance: Psychiatric and Substance Abuse Hospitals (250-499: 1, 100-249: 1)
People in group quarters in 2010:
2,425 people in college/university student housing
120 people in other noninstitutional facilities
68 people in emergency and transitional shelters (with sleeping facilities) for people experiencing homelessness
35 people in mental (psychiatric) hospitals and psychiatric units in other hospitals
6 people in nursing facilities/skilled-nursing facilities
2 people in workers' group living quarters and job corps centers
People in group quarters in 2000:
1,902 people in college dormitories (includes college quarters off campus)
115 people in other noninstitutional group quarters
111 people in orthopedic wards and institutions for the physically handicapped
106 people in nursing homes
39 people in hospitals/wards and hospices for chronically ill
39 people in other hospitals or wards for chronically ill
25 people in schools, hospitals, or wards for the intellectually disabled
15 people in wards in general hospitals for patients who have no usual home elsewhere
8 people in homes or halfway houses for drug/alcohol abuse
6 people in religious group quarters
Fatal accident statistics in 2014:
Fatal accident count: 3
Vehicles involved in fatal accidents: 5
Fatal accidents caused by drunken drivers: 0
Fatalities: 3
Persons involved in fatal accidents: 5
Pedestrians involved in fatal accidents: 1
Fatal accident statistics in 2013:
Fatal accident count: 2
Vehicles involved in fatal accidents: 3
Fatal accidents caused by drunken drivers: 0
Fatalities: 2
Persons involved in fatal accidents: 4
Pedestrians involved in fatal accidents: 1
Home Mortgage Disclosure Act Aggregated Statistics For Year 2009 (Based on 7 full and 6 partial tracts)
A) FHA, FSA/RHS & VA Home Purchase Loans
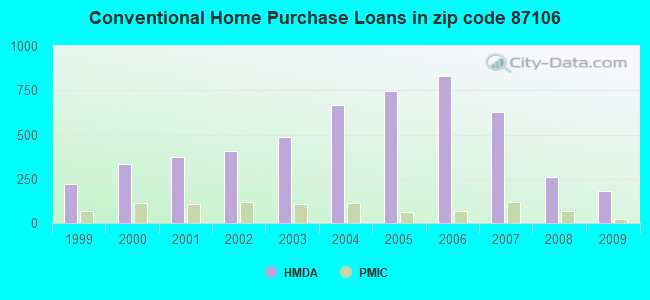
B) Conventional Home Purchase Loans
C) Refinancings
D) Home Improvement Loans
E) Loans on Dwellings For 5+ Families
F) Non-occupant Loans on < 5 Family Dwellings (A B C & D)
G) Loans On Manufactured Home Dwelling (A B C & D)
Number
Average Value
Number
Average Value
Number
Average Value
Number
Average Value
Number
Average Value
Number
Average Value
Number
Average Value
LOANS ORIGINATED
78
$169,710
178
$195,499
699
$181,227
50
$77,738
7
$469,357
141
$140,036
2
$66,610
APPLICATIONS APPROVED, NOT ACCEPTED
27
$192,443
27
$183,276
61
$178,609
0
$0
0
$0
12
$156,858
0
$0
APPLICATIONS DENIED
12
$134,703
17
$217,981
190
$179,963
27
$60,179
6
$300,725
47
$134,367
2
$30,820
APPLICATIONS WITHDRAWN
12
$175,898
23
$191,527
108
$182,071
8
$81,278
3
$411,710
25
$135,696
0
$0
FILES CLOSED FOR INCOMPLETENESS
0
$0
3
$221,193
33
$122,011
0
$0
0
$0
7
$140,143
0
$0
Aggregated Statistics For Year 2008 (Based on 7 full and 6 partial tracts)
A) FHA, FSA/RHS & VA Home Purchase Loans
B) Conventional Home Purchase Loans
C) Refinancings
D) Home Improvement Loans
E) Loans on Dwellings For 5+ Families
F) Non-occupant Loans on < 5 Family Dwellings (A B C & D)
G) Loans On Manufactured Home Dwelling (A B C & D)
Number
Average Value
Number
Average Value
Number
Average Value
Number
Average Value
Number
Average Value
Number
Average Value
Number
Average Value
LOANS ORIGINATED
76
$176,898
259
$186,602
373
$175,903
78
$110,657
7
$574,920
135
$162,604
2
$34,795
APPLICATIONS APPROVED, NOT ACCEPTED
2
$86,495
32
$199,506
83
$163,122
15
$87,933
0
$0
39
$160,378
0
$0
APPLICATIONS DENIED
8
$189,806
44
$146,265
214
$162,896
32
$77,558
6
$293,968
66
$125,027
13
$46,240
APPLICATIONS WITHDRAWN
2
$258,800
37
$193,301
128
$175,773
11
$126,527
2
$5,056,000
34
$152,675
0
$0
FILES CLOSED FOR INCOMPLETENESS
2
$218,500
13
$186,004
28
$178,971
8
$118,765
0
$0
11
$128,056
0
$0
Aggregated Statistics For Year 2007 (Based on 7 full and 6 partial tracts)
A) FHA, FSA/RHS & VA Home Purchase Loans
B) Conventional Home Purchase Loans
C) Refinancings
D) Home Improvement Loans
E) Loans on Dwellings For 5+ Families
F) Non-occupant Loans on < 5 Family Dwellings (A B C & D)
G) Loans On Manufactured Home Dwelling (A B C & D)
Number
Average Value
Number
Average Value
Number
Average Value
Number
Average Value
Number
Average Value
Number
Average Value
Number
Average Value
LOANS ORIGINATED
26
$185,887
626
$159,485
517
$155,751
123
$80,188
13
$290,632
334
$148,919
5
$23,448
APPLICATIONS APPROVED, NOT ACCEPTED
1
$182,000
89
$153,073
88
$175,886
18
$49,753
2
$71,580
48
$146,597
2
$12,925
APPLICATIONS DENIED
4
$187,540
86
$137,628
265
$168,095
65
$85,310
7
$225,944
94
$136,404
6
$40,430
APPLICATIONS WITHDRAWN
4
$92,958
54
$145,951
158
$160,330
23
$74,510
0
$0
28
$158,584
2
$144,160
FILES CLOSED FOR INCOMPLETENESS
1
$187,000
23
$167,963
65
$201,114
1
$35,630
2
$498,250
17
$213,765
0
$0
Aggregated Statistics For Year 2006 (Based on 7 full and 6 partial tracts)
A) FHA, FSA/RHS & VA Home Purchase Loans
B) Conventional Home Purchase Loans
C) Refinancings
D) Home Improvement Loans
E) Loans on Dwellings For 5+ Families
F) Non-occupant Loans on < 5 Family Dwellings (A B C & D)
G) Loans On Manufactured Home Dwelling (A B C & D)
Number
Average Value
Number
Average Value
Number
Average Value
Number
Average Value
Number
Average Value
Number
Average Value
Number
Average Value
LOANS ORIGINATED
27
$131,092
828
$142,022
571
$147,612
131
$61,697
9
$329,734
438
$131,247
0
$0
APPLICATIONS APPROVED, NOT ACCEPTED
0
$0
110
$123,338
100
$134,053
21
$82,886
2
$198,840
70
$115,224
1
$45,600
APPLICATIONS DENIED
2
$47,720
121
$137,231
332
$145,859
71
$75,563
6
$259,372
80
$117,187
12
$37,796
APPLICATIONS WITHDRAWN
3
$179,053
81
$159,011
221
$141,062
11
$117,574
2
$198,840
36
$143,220
2
$91,465
FILES CLOSED FOR INCOMPLETENESS
0
$0
25
$127,748
51
$160,519
1
$29,320
2
$262,080
18
$131,278
0
$0
Aggregated Statistics For Year 2005 (Based on 7 full and 6 partial tracts)
A) FHA, FSA/RHS & VA Home Purchase Loans
B) Conventional Home Purchase Loans
C) Refinancings
D) Home Improvement Loans
E) Loans on Dwellings For 5+ Families
F) Non-occupant Loans on < 5 Family Dwellings (A B C & D)
G) Loans On Manufactured Home Dwelling (A B C & D)
Number
Average Value
Number
Average Value
Number
Average Value
Number
Average Value
Number
Average Value
Number
Average Value
Number
Average Value
LOANS ORIGINATED
43
$116,787
747
$135,351
663
$130,281
81
$94,495
15
$642,251
457
$121,168
0
$0
APPLICATIONS APPROVED, NOT ACCEPTED
6
$72,577
80
$126,712
91
$137,820
17
$49,972
0
$0
54
$116,004
4
$55,178
APPLICATIONS DENIED
13
$125,508
88
$131,628
326
$127,220
53
$39,777
1
$214,000
57
$125,223
8
$71,618
APPLICATIONS WITHDRAWN
11
$137,380
88
$147,310
198
$130,212
21
$174,199
2
$1,101,135
52
$116,772
0
$0
FILES CLOSED FOR INCOMPLETENESS
0
$0
34
$111,675
23
$140,492
5
$57,208
0
$0
13
$98,666
0
$0
Aggregated Statistics For Year 2004 (Based on 7 full and 6 partial tracts)
A) FHA, FSA/RHS & VA Home Purchase Loans
B) Conventional Home Purchase Loans
C) Refinancings
D) Home Improvement Loans
E) Loans on Dwellings For 5+ Families
F) Non-occupant Loans on < 5 Family Dwellings (A B C & D)
G) Loans On Manufactured Home Dwelling (A B C & D)
Number
Average Value
Number
Average Value
Number
Average Value
Number
Average Value
Number
Average Value
Number
Average Value
Number
Average Value
LOANS ORIGINATED
59
$122,906
665
$121,047
730
$115,486
82
$39,988
10
$581,747
382
$109,836
10
$19,486
APPLICATIONS APPROVED, NOT ACCEPTED
0
$0
79
$121,925
97
$112,400
5
$120,342
2
$102,640
50
$111,001
4
$67,108
APPLICATIONS DENIED
9
$97,467
102
$94,675
266
$108,769
52
$30,997
0
$0
64
$108,544
3
$31,340
APPLICATIONS WITHDRAWN
8
$95,824
87
$112,948
184
$120,397
8
$58,764
0
$0
32
$115,129
0
$0
FILES CLOSED FOR INCOMPLETENESS
0
$0
9
$110,950
28
$125,480
4
$22,088
0
$0
6
$97,872
0
$0
Aggregated Statistics For Year 2003 (Based on 7 full and 6 partial tracts)
A) FHA, FSA/RHS & VA Home Purchase Loans
B) Conventional Home Purchase Loans
C) Refinancings
D) Home Improvement Loans
E) Loans on Dwellings For 5+ Families
F) Non-occupant Loans on < 5 Family Dwellings (A B C & D)
Number
Average Value
Number
Average Value
Number
Average Value
Number
Average Value
Number
Average Value
Number
Average Value
LOANS ORIGINATED
67
$120,570
487
$123,370
1,567
$112,789
50
$30,582
18
$569,798
483
$94,693
APPLICATIONS APPROVED, NOT ACCEPTED
3
$151,063
42
$135,656
138
$95,716
6
$64,198
0
$0
26
$82,592
APPLICATIONS DENIED
9
$76,970
50
$110,177
340
$104,880
34
$20,606
2
$376,675
80
$100,929
APPLICATIONS WITHDRAWN
9
$124,820
51
$138,806
243
$114,458
6
$16,905
0
$0
38
$101,894
FILES CLOSED FOR INCOMPLETENESS
8
$117,658
18
$123,415
47
$102,674
3
$104,943
0
$0
13
$80,740
Aggregated Statistics For Year 2002 (Based on 5 full and 6 partial tracts)
A) FHA, FSA/RHS & VA Home Purchase Loans
B) Conventional Home Purchase Loans
C) Refinancings
D) Home Improvement Loans
E) Loans on Dwellings For 5+ Families
F) Non-occupant Loans on < 5 Family Dwellings (A B C & D)
Number
Average Value
Number
Average Value
Number
Average Value
Number
Average Value
Number
Average Value
Number
Average Value
LOANS ORIGINATED
91
$112,839
407
$115,989
850
$107,439
42
$30,155
12
$351,329
251
$89,213
APPLICATIONS APPROVED, NOT ACCEPTED
5
$113,796
33
$99,656
101
$99,419
5
$30,940
2
$250,120
29
$84,765
APPLICATIONS DENIED
6
$148,747
47
$84,760
234
$98,493
21
$18,024
3
$181,653
42
$86,338
APPLICATIONS WITHDRAWN
11
$133,401
25
$144,148
174
$96,649
3
$18,293
2
$747,375
31
$78,794
FILES CLOSED FOR INCOMPLETENESS
0
$0
9
$91,296
43
$97,083
0
$0
0
$0
3
$93,590
Aggregated Statistics For Year 2001 (Based on 5 full and 6 partial tracts)
A) FHA, FSA/RHS & VA Home Purchase Loans
B) Conventional Home Purchase Loans
C) Refinancings
D) Home Improvement Loans
E) Loans on Dwellings For 5+ Families
F) Non-occupant Loans on < 5 Family Dwellings (A B C & D)
Number
Average Value
Number
Average Value
Number
Average Value
Number
Average Value
Number
Average Value
Number
Average Value
LOANS ORIGINATED
89
$99,352
371
$106,563
668
$104,869
73
$31,909
5
$213,040
185
$101,503
APPLICATIONS APPROVED, NOT ACCEPTED
2
$111,500
34
$88,014
69
$103,743
4
$16,220
1
$128,000
22
$104,565
APPLICATIONS DENIED
8
$84,592
84
$67,952
177
$81,782
35
$33,041
3
$249,417
24
$80,285
APPLICATIONS WITHDRAWN
6
$103,742
37
$98,945
141
$101,557
8
$29,620
0
$0
24
$113,061
FILES CLOSED FOR INCOMPLETENESS
0
$0
3
$127,333
29
$85,614
2
$89,480
0
$0
1
$148,200
Aggregated Statistics For Year 2000 (Based on 5 full and 6 partial tracts)
A) FHA, FSA/RHS & VA Home Purchase Loans
B) Conventional Home Purchase Loans
C) Refinancings
D) Home Improvement Loans
E) Loans on Dwellings For 5+ Families
F) Non-occupant Loans on < 5 Family Dwellings (A B C & D)
Number
Average Value
Number
Average Value
Number
Average Value
Number
Average Value
Number
Average Value
Number
Average Value
LOANS ORIGINATED
76
$94,250
335
$100,987
222
$76,511
71
$20,308
4
$634,130
107
$78,369
APPLICATIONS APPROVED, NOT ACCEPTED
4
$52,555
31
$83,719
56
$96,066
36
$22,396
0
$0
16
$76,670
APPLICATIONS DENIED
12
$63,271
107
$66,711
241
$69,927
42
$14,728
0
$0
38
$82,785
APPLICATIONS WITHDRAWN
8
$118,170
32
$100,289
86
$77,188
10
$48,013
0
$0
9
$92,899
FILES CLOSED FOR INCOMPLETENESS
0
$0
11
$109,509
15
$122,283
0
$0
0
$0
1
$107,000
Aggregated Statistics For Year 1999 (Based on 3 full and 5 partial tracts)
A) FHA, FSA/RHS & VA Home Purchase Loans
B) Conventional Home Purchase Loans
C) Refinancings
D) Home Improvement Loans
E) Loans on Dwellings For 5+ Families
F) Non-occupant Loans on < 5 Family Dwellings (A B C & D)
2003 - 2017 National Fire Incident Reporting System (NFIRS) incidents
According to the data from the years 2003 - 2017 the average number of fire incidents per year is 47. The highest number of fires - 127 took place in 2007, and the least - 0 in 2015. The data has a decreasing trend.
When looking into fire subcategories, the most incidents belonged to: Structure Fires (49.6%), and Outside Fires (27.2%).
Fire incident types reported to NFIRS in Zip Code 87106


 Nearest zip codes: 87102, 87108, 87110, 87104, 87117, 87116.


 According to the data from the years 2003 - 2017 the average number of fire incidents per year is 47. The highest number of fires - 127 took place in 2007, and the least - 0 in 2015. The data has a decreasing trend.
 When looking into fire subcategories, the most incidents belonged to: Structure Fires (49.6%), and Outside Fires (27.2%).