Irondequoit, New York
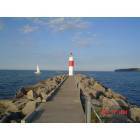
Irondequoit: Irondequoit Pier Mini-Lighthouse
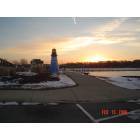
Irondequoit: Irondequoit Pier Mini-Lighthouse
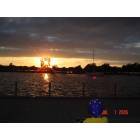
Irondequoit: Irondequoit Pier Mini-Lighthouse
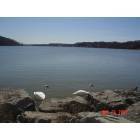
Irondequoit: Irondequoit Bay
- add
your
Submit your own pictures of this place and show them to the world
- OSM Map
- General Map
- Google Map
- MSN Map
Population change since 2000: -1.3%
| Males: 24,733 | |
| Females: 26,959 |
| Median resident age: | 44.5 years |
| New York median age: | 40.0 years |
Zip codes: 14617, 14621, 14622.
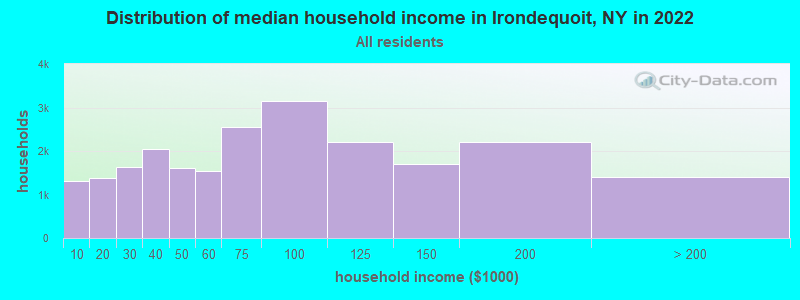
Irondequoit Zip Code Map| Irondequoit: | $70,377 |
| NY: | $79,557 |
Estimated per capita income in 2022: $42,417 (it was $23,638 in 2000)
Irondequoit CDP income, earnings, and wages data
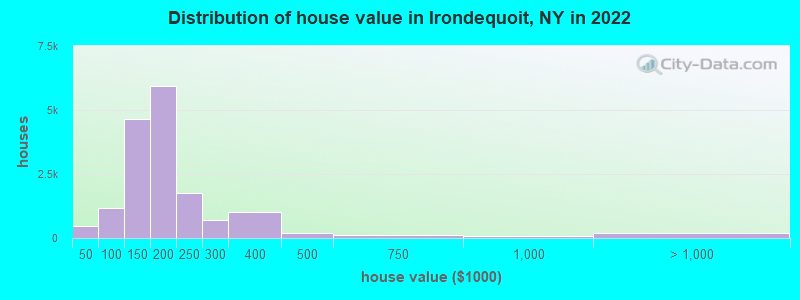
Estimated median house or condo value in 2022: $169,981 (it was $88,800 in 2000)
| Irondequoit: | $169,981 |
| NY: | $400,400 |
Mean prices in 2022: all housing units: $193,678; detached houses: $199,335; townhouses or other attached units: $144,539; in 2-unit structures: $432,846; in 3-to-4-unit structures: $772,047; in 5-or-more-unit structures: $125,862; mobile homes: $45,093
Median gross rent in 2022: $1,073.
(5.5% for White Non-Hispanic residents, 22.5% for Black residents, 20.7% for Hispanic or Latino residents, 73.7% for American Indian residents, 100.0% for Native Hawaiian and other Pacific Islander residents, 14.1% for other race residents, 20.3% for two or more races residents)
Detailed information about poverty and poor residents in Irondequoit, NY
Compare current foreclosures near Irondequoit, NY:
| Photo | Address | Area | Beds / Baths | Price | Details |
|---|---|---|---|---|---|

|
#1
Garson Ave
Rochester, NY 14609
|
1,736 sq. feet
|
1 baths 4 beds |
$149,900
|
show details |

|
#2
Holmes Rd
Rochester, NY 14626
|
754 sq. feet
|
1 baths 2 beds |
show details | |

|
#3
Mcnair Dr
Rochester, NY 14624
|
1,800 sq. feet
|
2 baths 3 beds |
show details | |

|
#4
Park Cir S
Rochester, NY 14623
|
2,447 sq. feet
|
2 baths 3 beds |
show details | |

|
#5
Monroe Ave
Pittsford, NY 14534
|
2,384 sq. feet
|
4 baths 2 beds |
show details | |

|
#6
Whitney Rd
Penfield, NY 14526
|
824 sq. feet
|
1 baths 1 beds |
show details | |

|
#7
Lake View Ter
Webster, NY 14580
|
4,922 sq. feet
|
4 baths 5 beds |
show details | |

|
#8
Upper Valley Rd
Rochester, NY 14624
|
946 sq. feet
|
2 baths 2 beds |
show details | |

|
#9
Curlew St
Rochester, NY 14613
|
968 sq. feet
|
1 baths 2 beds |
show details | |

|
#10
Rocklea Dr
Rochester, NY 14624
|
1,114 sq. feet
|
2 baths 2 beds |
show details |
| Photo | Address | Area | Beds / Baths | Price | Details |
|---|---|---|---|---|---|

|
#11
Ridgeway Ave
Rochester, NY 14615
|
748 sq. feet
|
1 baths 2 beds |
show details | |

|
#12
Valley Creek Rd
Rochester, NY 14624
|
1,348 sq. feet
|
2 baths 2 beds |
show details | |

|
#13
Monaco Dr
Rochester, NY 14624
|
1,810 sq. feet
|
2 baths 3 beds |
show details | |

|
#14
Sherman St
Rochester, NY 14606
|
1,629 sq. feet
|
2 baths 4 beds |
show details | |

|
#15
Latta Rd
Rochester, NY 14612
|
1,156 sq. feet
|
1 baths 3 beds |
show details | |

|
#16
Fairview Ct
Rochester, NY 14612
|
1,350 sq. feet
|
1 baths 3 beds |
show details | |

|
#17
Fairview Ct
Rochester, NY 14612
|
1,350 sq. feet
|
1 baths 3 beds |
show details | |

|
#18
La Grange Ave # Un208
Rochester, NY 14615
|
1,151 sq. feet
|
1 baths 2 beds |
show details | |

|
#19
Shoreway Dr
Rochester, NY 14612
|
1,992 sq. feet
|
2 baths 3 beds |
show details | |

|
#20
Armstrong Rd
Rochester, NY 14612
|
1,032 sq. feet
|
1 baths 3 beds |
show details |
| Photo | Address | Area | Beds / Baths | Price | Details |
|---|---|---|---|---|---|

|
#21
Starling St
Rochester, NY 14613
|
892 sq. feet
|
1 baths 2 beds |
show details | |

|
#22
Emerson St
Rochester, NY 14613
|
1,507 sq. feet
|
2 baths 4 beds |
show details | |

|
#23
Upper Valley Rd
Rochester, NY 14624
|
1,080 sq. feet
|
2 baths 2 beds |
show details | |

|
#24
Bambi Ln
Rochester, NY 14624
|
1,774 sq. feet
|
2 baths 3 beds |
show details | |

|
#25
Cardile Dr
Webster, NY 14580
|
1,816 sq. feet
|
2 baths 4 beds |
show details | |

|
#26
Harris Rd
Webster, NY 14580
|
2,537 sq. feet
|
1 baths 3 beds |
show details | |

|
#27
Spencerport Rd
Rochester, NY 14606
|
1,596 sq. feet
|
2 baths 3 beds |
show details | |

|
#28
Surrey Hill Way
Rochester, NY 14623
|
1,008 sq. feet
|
2 baths 2 beds |
show details | |

|
#29
Frederick Douglass St
Rochester, NY 14608
|
679 sq. feet
|
2 baths 1 beds |
show details | |

|
#30
Spring Tree Ln
Rochester, NY 14612
|
1,714 sq. feet
|
2 baths 3 beds |
show details |
| Photo | Address | Area | Beds / Baths | Price | Details |
|---|---|---|---|---|---|

|
#31
Mosley Rd
Rochester, NY 14616
|
1,084 sq. feet
|
1 baths 2 beds |
show details | |

|
#32
John Leo Dr
Webster, NY 14580
|
2,052 sq. feet
|
2 baths 3 beds |
show details | |

|
#33
Boardman St
Rochester, NY 14607
|
2,070 sq. feet
|
2 baths 4 beds |
show details | |

|
#34
French Rd
Rochester, NY 14618
|
1,463 sq. feet
|
2 baths 2 beds |
show details | |

|
#35
Leonard Rd
Rochester, NY 14616
|
642 sq. feet
|
1 baths 2 beds |
show details | |

|
#36
Pebbleview Dr
Rochester, NY 14612
|
1,472 sq. feet
|
2 baths 3 beds |
show details | |

|
#37
Hillside Rd
Penfield, NY 14526
|
1,178 sq. feet
|
2 baths 3 beds |
show details | |

|
#38
W Filbert St
East Rochester, NY 14445
|
1,674 sq. feet
|
1 baths 3 beds |
show details | |

|
#39
W Spruce St
East Rochester, NY 14445
|
1,902 sq. feet
|
3 baths 4 beds |
show details | |

|
#40
Dewey Ave
Rochester, NY 14616
|
1,040 sq. feet
|
1 baths 3 beds |
show details |
| Photo | Address | Area | Beds / Baths | Price | Details |
|---|---|---|---|---|---|

|
#41
N Greece Rd
Rochester, NY 14626
|
1,557 sq. feet
|
2 baths 4 beds |
show details | |

|
#42
Pebbleview Dr
Rochester, NY 14612
|
2,016 sq. feet
|
3 baths 4 beds |
show details | |

|
#43
Britton Rd
Rochester, NY 14616
|
1,020 sq. feet
|
1 baths 2 beds |
show details | |

|
#44
Canterbury Rd
Rochester, NY 14607
|
2,664 sq. feet
|
4 baths 6 beds |
show details | |

|
#45
Dix St
Rochester, NY 14606
|
1,152 sq. feet
|
1 baths 3 beds |
show details | |

|
#46
Dewey Ave
Rochester, NY 14616
|
1,381 sq. feet
|
2 baths 2 beds |
show details | |

|
#47
Emerson St
Rochester, NY 14613
|
1,476 sq. feet
|
1 baths 3 beds |
show details | |

|
#48
Kernwood Dr
Rochester, NY 14624
|
1,836 sq. feet
|
2 baths 4 beds |
show details | |

|
#49
Sterling St
Rochester, NY 14606
|
1,459 sq. feet
|
1 baths 3 beds |
show details | |

|
Check over 1 million property listings on Foreclosure.com!
|
browse all offers | |||


- 37,98975.2%White alone
- 5,35410.6%Hispanic
- 3,5647.1%Black alone
- 2,8755.7%Two or more races
- 7041.4%Asian alone
- 1150.2%Other race alone
- 660.1%Native Hawaiian and Other
Pacific Islander alone - 270.05%American Indian alone
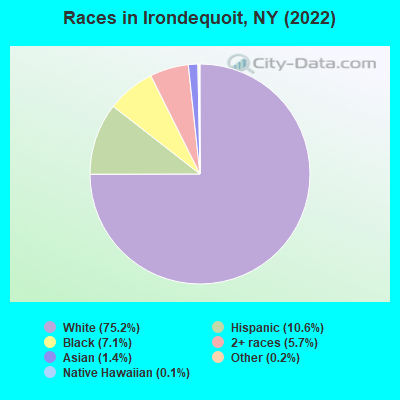
Races in Irondequoit detailed stats: ancestries, foreign born residents, place of birth
According to our research of New York and other state lists, there was 1 registered sex offender living in Irondequoit, New York as of May 31, 2024.
The ratio of all residents to sex offenders in Irondequoit is 51,032 to 1.
The ratio of registered sex offenders to all residents in this city is much lower than the state average.
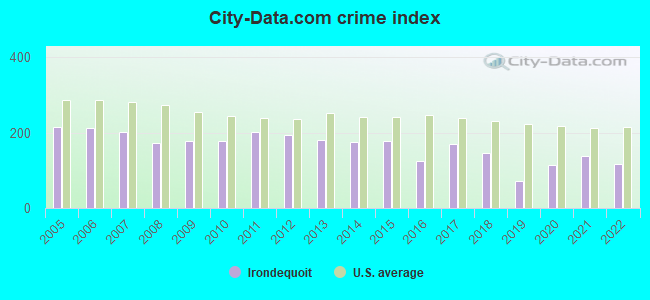
The City-Data.com crime index weighs serious crimes and violent crimes more heavily. Higher means more crime, U.S. average is 246.1. It adjusts for the number of visitors and daily workers commuting into cities.
- means the value is smaller than the state average.- means the value is about the same as the state average.
- means the value is bigger than the state average.
Crime rate in Irondequoit detailed stats: murders, rapes, robberies, assaults, burglaries, thefts, arson
Full-time law enforcement employees in 2021, including police officers: 60 (52 officers - 45 male; 7 female).
| Officers per 1,000 residents here: | 1.05 |
| New York average: | 3.28 |
 Recent articles from our blog. Our writers, many of them Ph.D. graduates or candidates, create easy-to-read articles on a wide variety of topics.

 | Irondequoit ranked country’s top market for first-time homebuyers (49 replies) |
| Rochester-Boom or Bust (745 replies) |
| City starts planning to remove more of the Inner Loop (249 replies) |
| Just how hot is the Rochester market? Check out these stats (81 replies) |
| Irondequoit housing market remains red hot. Here's the latest data (3 replies) |
| Newcomers with various questions (94 replies) |
Latest news from Irondequoit, NY collected exclusively by city-data.com from local newspapers, TV, and radio stations
Ancestries: Italian (23.3%), German (9.4%), American (7.9%), Irish (7.2%), English (4.8%), Polish (4.4%).
Current Local Time: EST time zone
Elevation: 385 feet
Land area: 15.2 square miles.
Population density: 3,404 people per square mile (average).
2,869 residents are foreign born (2.3% Europe, 1.2% Asia, 1.1% Latin America, 0.7% North America).
| This place: | 5.7% |
| New York: | 22.6% |
Median real estate property taxes paid for housing units with mortgages in 2022: $5,669 (3.2%)
Median real estate property taxes paid for housing units with no mortgage in 2022: $4,880 (3.0%)
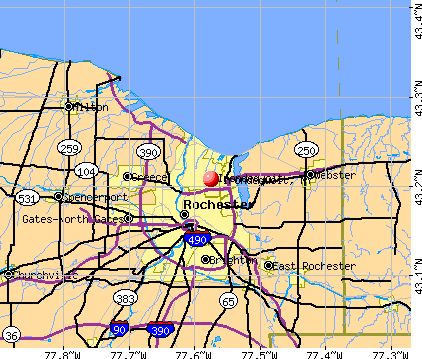
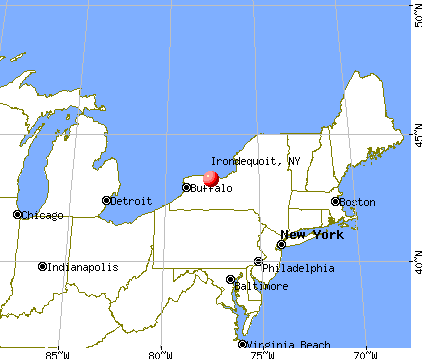
Nearest city with pop. 200,000+: Rochester, NY  (3.5 miles , pop. 219,773).
Nearest city with pop. 1,000,000+: Manhattan, NY (250.4 miles , pop. 1,537,195).
Nearest cities:
), ), ), Latitude: 43.21 N, Longitude: 77.58 W
Daytime population change due to commuting: -10,906 (-21.6%)
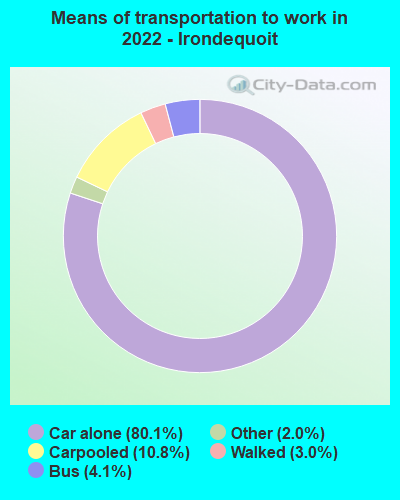
Workers who live and work in this place: 6,080 (23.6%)
Area code commonly used in this area: 585

Irondequoit tourist attractions:
Irondequoit, New York accommodation & food services, waste management - Economy and Business Data
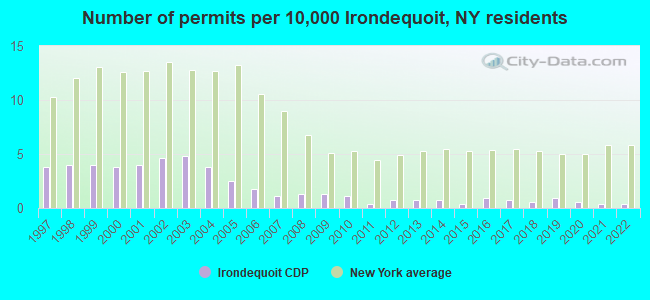
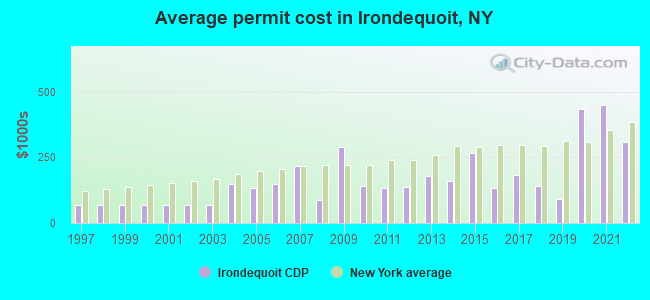
Single-family new house construction building permits:
- 2022: 2 buildings, average cost: $310,000
- 2021: 2 buildings, average cost: $450,000
- 2020: 3 buildings, average cost: $433,300
- 2019: 5 buildings, average cost: $92,000
- 2018: 3 buildings, average cost: $143,300
- 2017: 4 buildings, average cost: $182,500
- 2016: 5 buildings, average cost: $133,400
- 2015: 2 buildings, average cost: $266,100
- 2014: 4 buildings, average cost: $162,300
- 2013: 4 buildings, average cost: $181,300
- 2012: 4 buildings, average cost: $137,300
- 2011: 2 buildings, average cost: $135,000
- 2010: 6 buildings, average cost: $143,000
- 2009: 7 buildings, average cost: $287,900
- 2008: 7 buildings, average cost: $88,600
- 2007: 6 buildings, average cost: $219,200
- 2006: 9 buildings, average cost: $147,700
- 2005: 13 buildings, average cost: $134,600
- 2004: 20 buildings, average cost: $147,400
- 2003: 25 buildings, average cost: $66,500
- 2002: 24 buildings, average cost: $66,500
- 2001: 21 buildings, average cost: $66,500
- 2000: 20 buildings, average cost: $66,500
- 1999: 21 buildings, average cost: $66,500
- 1998: 21 buildings, average cost: $66,500
- 1997: 20 buildings, average cost: $66,500
| Here: | 4.1% |
| New York: | 4.4% |
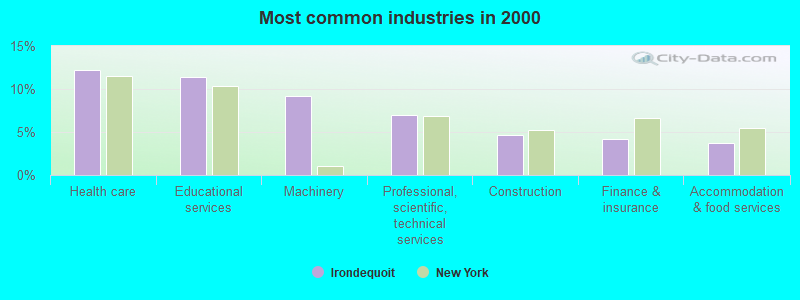
- Health care (12.2%)
- Educational services (11.4%)
- Machinery (9.2%)
- Professional, scientific, technical services (7.0%)
- Construction (4.7%)
- Finance & insurance (4.2%)
- Accommodation & food services (3.7%)
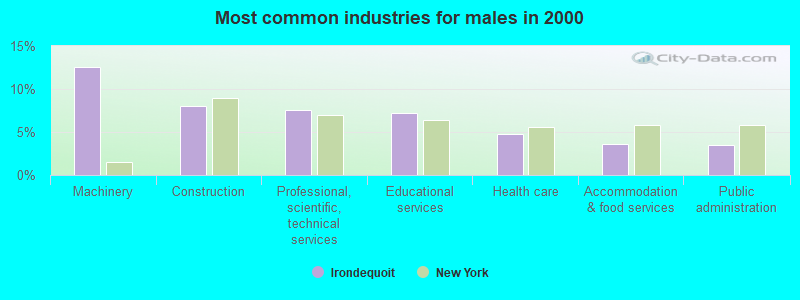
- Machinery (12.6%)
- Construction (8.0%)
- Professional, scientific, technical services (7.5%)
- Educational services (7.2%)
- Health care (4.8%)
- Accommodation & food services (3.6%)
- Public administration (3.5%)
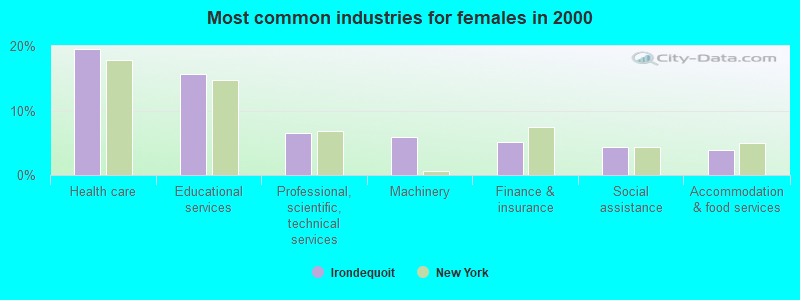
- Health care (19.6%)
- Educational services (15.7%)
- Professional, scientific, technical services (6.5%)
- Machinery (5.9%)
- Finance & insurance (5.1%)
- Social assistance (4.3%)
- Accommodation & food services (3.9%)
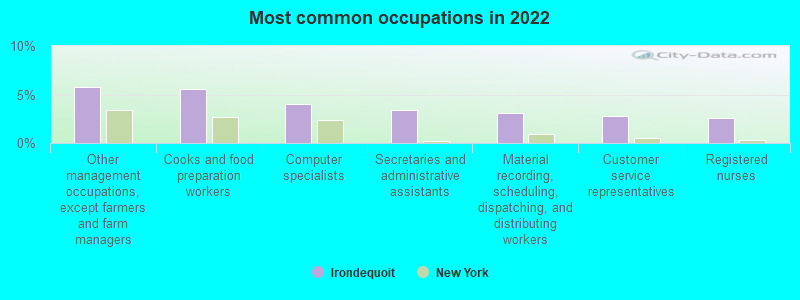
- Other management occupations, except farmers and farm managers (5.8%)
- Cooks and food preparation workers (5.6%)
- Computer specialists (4.1%)
- Secretaries and administrative assistants (3.4%)
- Material recording, scheduling, dispatching, and distributing workers (3.0%)
- Customer service representatives (2.8%)
- Registered nurses (2.6%)
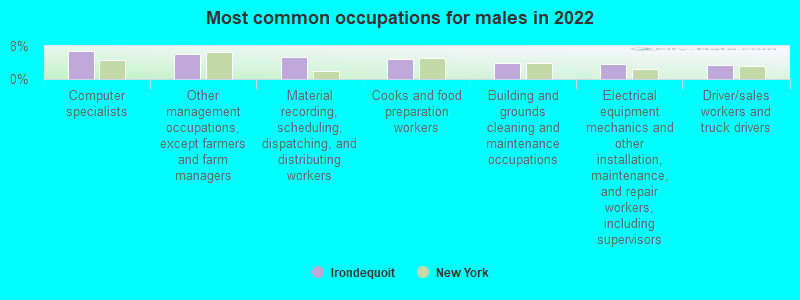
- Computer specialists (6.7%)
- Other management occupations, except farmers and farm managers (6.1%)
- Material recording, scheduling, dispatching, and distributing workers (5.3%)
- Cooks and food preparation workers (4.8%)
- Building and grounds cleaning and maintenance occupations (3.8%)
- Electrical equipment mechanics and other installation, maintenance, and repair workers, including supervisors (3.6%)
- Driver/sales workers and truck drivers (3.4%)
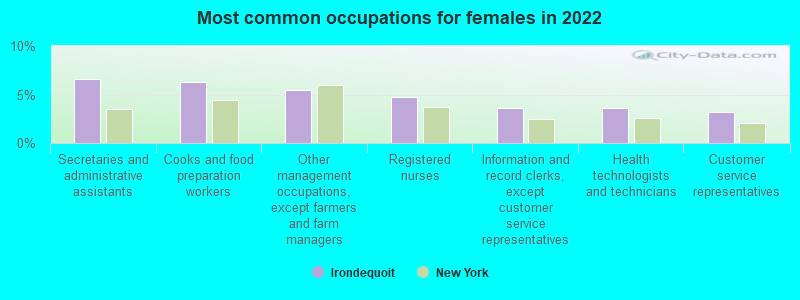
- Secretaries and administrative assistants (6.6%)
- Cooks and food preparation workers (6.3%)
- Other management occupations, except farmers and farm managers (5.5%)
- Registered nurses (4.7%)
- Information and record clerks, except customer service representatives (3.6%)
- Health technologists and technicians (3.6%)
- Customer service representatives (3.2%)
Average climate in Irondequoit, New York
Based on data reported by over 4,000 weather stations


|
|


(lower is better)
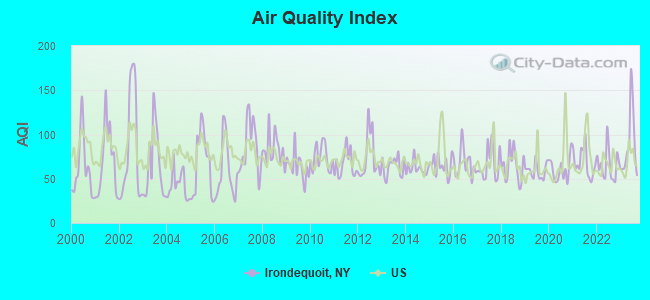
Air Quality Index (AQI) level in 2023 was 88.5. This is worse than average.
| City: | 88.5 |
| U.S.: | 72.6 |
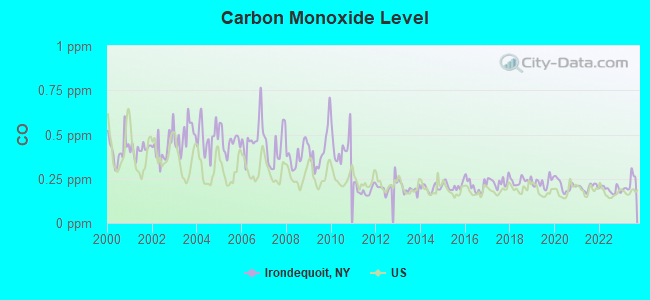
Carbon Monoxide (CO) [ppm] level in 2023 was 0.225. This is about average. Closest monitor was 3.1 miles away from the city center.
| City: | 0.225 |
| U.S.: | 0.251 |
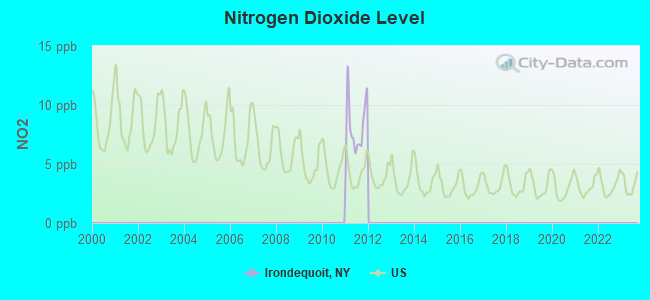
Nitrogen Dioxide (NO2) [ppb] level in 2011 was 8.11. This is significantly worse than average. Closest monitor was 3.1 miles away from the city center.
| City: | 8.11 |
| U.S.: | 5.11 |
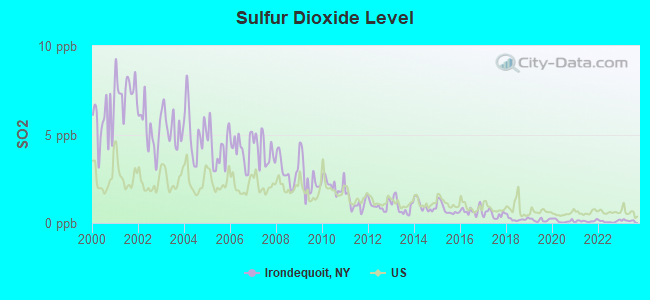
Sulfur Dioxide (SO2) [ppb] level in 2023 was 0.128. This is significantly better than average. Closest monitor was 0.5 miles away from the city center.
| City: | 0.128 |
| U.S.: | 1.515 |

Ozone [ppb] level in 2023 was 31.3. This is about average. Closest monitor was 3.1 miles away from the city center.
| City: | 31.3 |
| U.S.: | 33.3 |
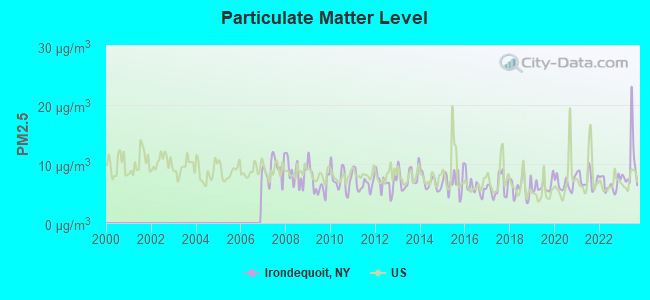
Particulate Matter (PM2.5) [µg/m3] level in 2023 was 9.83. This is worse than average. Closest monitor was 3.5 miles away from the city center.
| City: | 9.83 |
| U.S.: | 8.11 |
Earthquake activity:
Irondequoit-area historical earthquake activity is significantly above New York state average. It is 68% smaller than the overall U.S. average.On 10/7/1983 at 10:18:46, a magnitude 5.3 (5.1 MB, 5.3 LG, 5.1 ML, Class: Moderate, Intensity: VI - VII) earthquake occurred 170.0 miles away from the city center
On 9/25/1998 at 19:52:52, a magnitude 5.2 (4.8 MB, 4.3 MS, 5.2 LG, 4.5 MW, Depth: 3.1 mi) earthquake occurred 186.8 miles away from the city center
On 4/20/2002 at 10:50:47, a magnitude 5.3 (5.3 ML, Depth: 3.0 mi) earthquake occurred 213.4 miles away from Irondequoit center
On 4/20/2002 at 10:50:47, a magnitude 5.2 (5.2 MB, 4.2 MS, 5.2 MW, 5.0 MW) earthquake occurred 211.7 miles away from Irondequoit center
On 1/31/1986 at 16:46:43, a magnitude 5.0 (5.0 MB) earthquake occurred 214.1 miles away from the city center
On 8/23/2011 at 17:51:04, a magnitude 5.8 (5.8 MW, Depth: 3.7 mi) earthquake occurred 367.0 miles away from the city center
Magnitude types: regional Lg-wave magnitude (LG), body-wave magnitude (MB), local magnitude (ML), surface-wave magnitude (MS), moment magnitude (MW)
Natural disasters:
The number of natural disasters in Monroe County (17) is near the US average (15).Major Disasters (Presidential) Declared: 10
Emergencies Declared: 6
Causes of natural disasters: Floods: 5, Storms: 5, Winter Storms: 3, Hurricanes: 2, Ice Storms: 2, Blizzard: 1, Power Outage: 1, Tropical Storm: 1, Wind: 1, Other: 2 (Note: some incidents may be assigned to more than one category).

Hospitals and medical centers near Irondequoit:
- ST ANN'S NH (Nursing Home, about 2 miles away; ROCHESTER, NY)
- ST ANNS HOME FOR THE AGED (Nursing Home, about 2 miles away; ROCHESTER, NY)
- ROCHESTER GENERAL HOSPITAL Acute Care Hospitals (about 2 miles away; ROCHESTER, NY)
- INDEPENDENT LIVING FOR SENIORS INC LTHHCP (Home Health Center, about 2 miles away; ROCHESTER, NY)
- BLOSSOM NORTH NURSING AND REHABILITATION CENTER (Nursing Home, about 2 miles away; ROCHESTER, NY)
- NORLOCH MANOR (Nursing Home, about 2 miles away; ROCHESTER, NY)
- ROCHESTER GENERAL HOSPITAL DIALYSIS CENTER (Dialysis Facility, about 2 miles away; ROCHESTER, NY)
Operable nuclear power plant near Irondequoit:
- 4 miles: R.E. Ginna in Rochester, NY.
Colleges/universities with over 2000 students nearest to Irondequoit:
- University of Rochester (about 7 miles; Rochester, NY; Full-time enrollment: 10,201)
- Saint John Fisher College (about 7 miles; Rochester, NY; FT enrollment: 3,373)
- Monroe Community College (about 8 miles; Rochester, NY; FT enrollment: 14,295)
- Nazareth College (about 8 miles; Rochester, NY; FT enrollment: 2,632)
- Rochester Institute of Technology (about 10 miles; Rochester, NY; FT enrollment: 14,177)
- SUNY College at Brockport (about 19 miles; Brockport, NY; FT enrollment: 7,398)
- Finger Lakes Community College (about 29 miles; Canandaigua, NY; FT enrollment: 4,732)
Points of interest:
Notable locations in Irondequoit: Newport Marina (A), Newport Yacht Club (B), Sutter's Marina (C), Shumway Marine (D), McMillan Marine (E), Bayview Marina (F), Chapel Oaks (G), Saint Anns Community Nursing Home (H), Shire at Culverton Adult Home (I), Irondequoit Community Center (J), Irondequoit Public Library Helen McGraw Branch (K), Irondequoit Public Library Pauline Evans Branch (L), Irondequoit Town Courthouse (M), Irondequoit Town Hall (N), Ridge Culver Fire District (O), Saint Paul Boulevard Fire Department (P), Sea Breeze Volunteer Fire Department (Q), Laurelton Fire Department (R). Display/hide their locations on the map
Shopping Centers: Stutson Bridge Plaza Shopping Center (1), Ridge Hill Mall Shopping Center (2), Ridge - Hudson Plaza Shopping Center (3), Medley Centre Shopping Center (4), Georgetown Plaza Shopping Center (5), Empire Plaza Shopping Center (6), Depot Plaza Shopping Center (7), Culver Ridge Plaza Shopping Center (8). Display/hide their locations on the map
Churches in Irondequoit include: Bay Knoll Seventh Day Adventist Church (A), Christ the King Church (B), Durand United Church of Christ (C), Glad Tidings Church (D), God Healing Temple (E), Grace Baptist Church (F), Summerville Presbyterian Church (G), The Church of Jesus Christ of Latter Day Saints (H), Trinity Communion Church (I). Display/hide their locations on the map
Cemeteries: Hooker Cemetery (1), Irondequoit Cemetery (2). Display/hide their locations on the map
Creek: Densmore Creek (A). Display/hide its location on the map
Park in Irondequoit: Irondequoit Bay Park (1). Display/hide its location on the map
Birthplace of: Steve Gadd - Jazz drummer, Joe Walters - Lacrosse player.
| This place: | 2.3 people |
| New York: | 2.6 people |
| This place: | 61.4% |
| Whole state: | 63.5% |
| This place: | 6.9% |
| Whole state: | 6.8% |
Likely homosexual households (counted as self-reported same-sex unmarried-partner households)
- Lesbian couples: 0.6% of all households
- Gay men: 0.3% of all households
People in group quarters in Irondequoit in 2010:
- 558 people in nursing facilities/skilled-nursing facilities
- 85 people in group homes intended for adults
- 32 people in other noninstitutional facilities
- 8 people in group homes for juveniles (non-correctional)
People in group quarters in Irondequoit in 2000:
- 542 people in nursing homes
- 150 people in other noninstitutional group quarters
- 48 people in religious group quarters
- 42 people in homes for the mentally retarded
- 15 people in other group homes
- 11 people in other nonhousehold living situations
Banks with branches in Irondequoit (2011 data):
- JPMorgan Chase Bank, National Association: Irondequoit Mall Branch, Irondequoit East Branch, Irondequoit West Branch. Info updated 2011/11/10: Bank assets: $1,811,678.0 mil, Deposits: $1,190,738.0 mil, headquarters in Columbus, OH, positive income, International Specialization, 5577 total offices, Holding Company: Jpmorgan Chase & Co.
- Manufacturers and Traders Trust Company: Irondequoit Plaza Branch at 2133 Hudson Avenue, branch established on 1966/03/30. Info updated 2011/08/08: Bank assets: $76,887.1 mil, Deposits: $60,064.2 mil, headquarters in Buffalo, NY, positive income, Commercial Lending Specialization, 808 total offices, Holding Company: M&T Bank Corporation
- The Canandaigua National Bank and Trust Company: Irondequoit Bank Office at 2128 Hudson Avenue, branch established on 2000/01/18. Info updated 2006/12/12: Bank assets: $1,726.9 mil, Deposits: $1,563.5 mil, headquarters in Canandaigua, NY, positive income, Commercial Lending Specialization, 25 total offices, Holding Company: Canandaigua National Corporation
For population 15 years and over in Irondequoit:
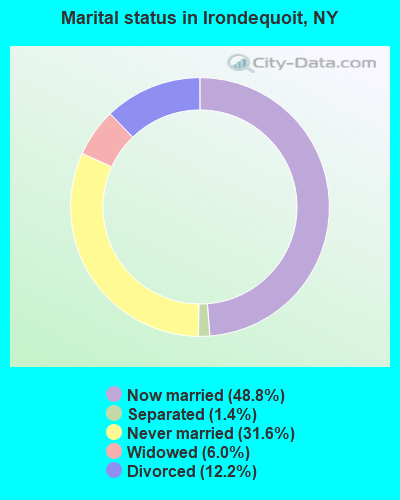
- Never married: 31.6%
- Now married: 48.8%
- Separated: 1.4%
- Widowed: 6.0%
- Divorced: 12.2%
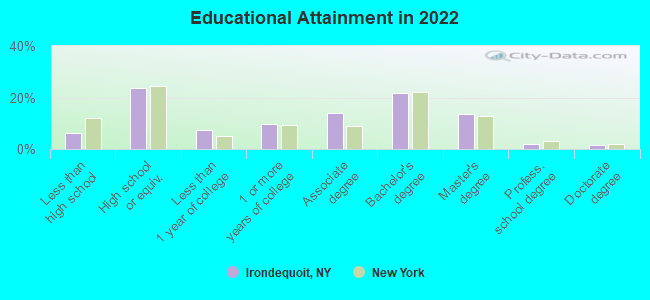
For population 25 years and over in Irondequoit:
- High school or higher: 93.2%
- Bachelor's degree or higher: 38.8%
- Graduate or professional degree: 16.6%
- Unemployed: 4.5%
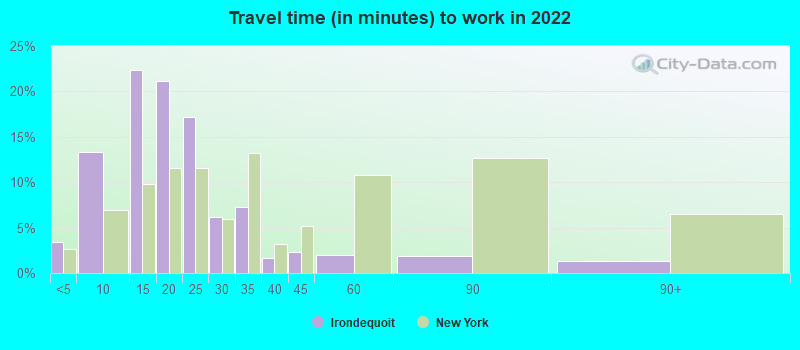
- Mean travel time to work (commute): 17.2 minutes
| Here: | 11.3 |
| New York average: | 13.9 |
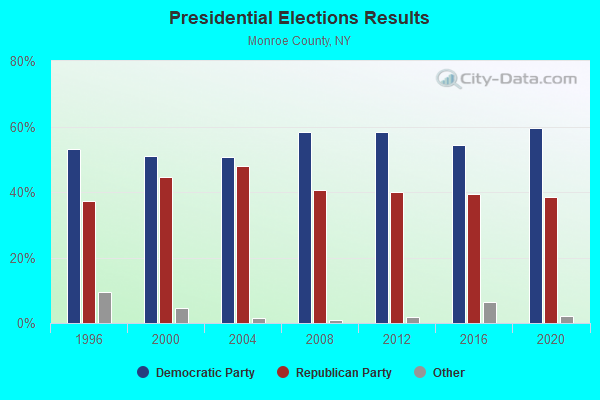
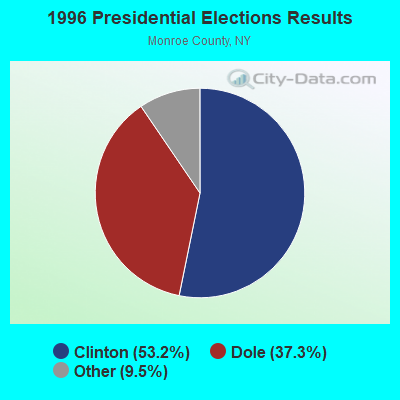
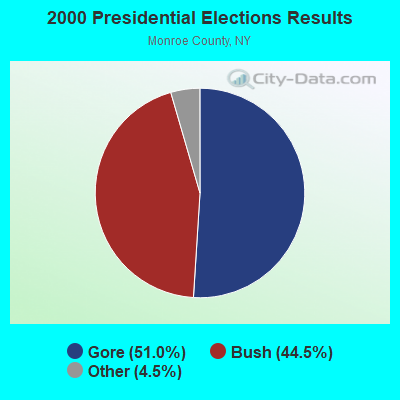
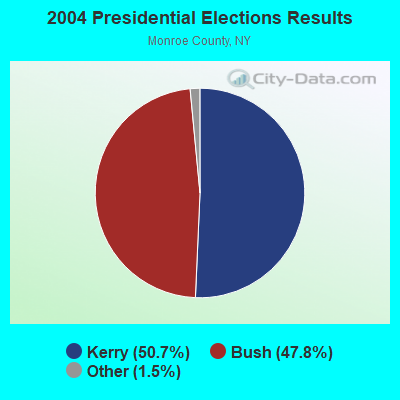
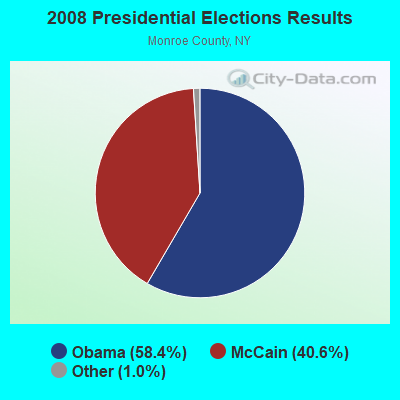
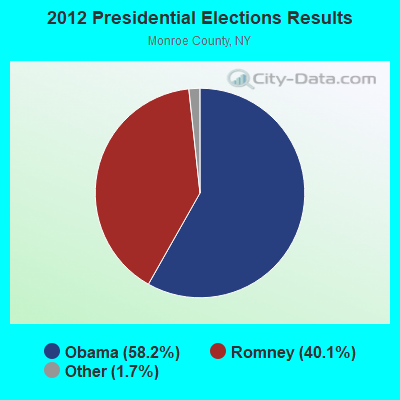
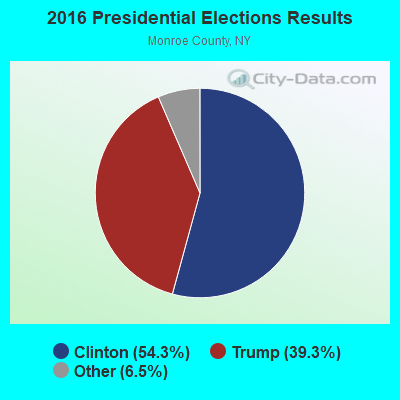
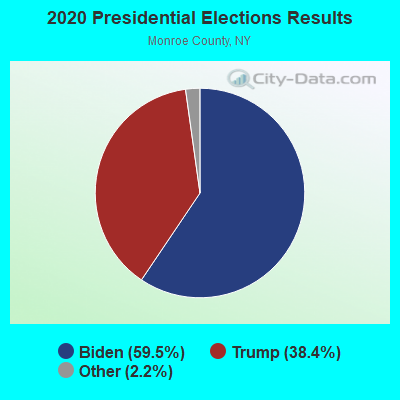
Graphs represent county-level data. Detailed 2008 Election Results
Religion statistics for Irondequoit, NY (based on Monroe County data)
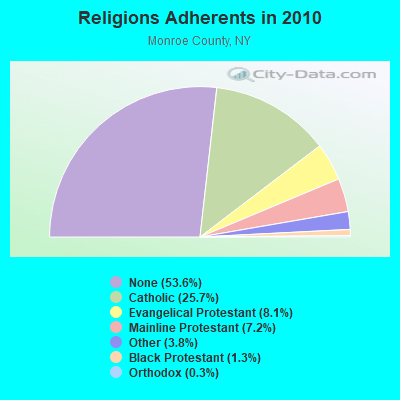
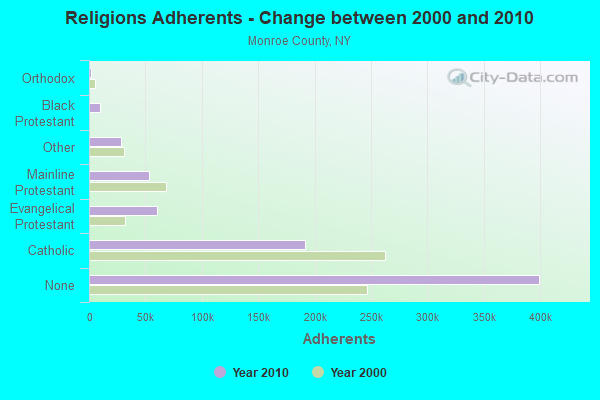
| Religion | Adherents | Congregations |
|---|---|---|
| Catholic | 191,112 | 65 |
| Evangelical Protestant | 60,385 | 240 |
| Mainline Protestant | 53,463 | 151 |
| Other | 28,550 | 74 |
| Black Protestant | 9,459 | 30 |
| Orthodox | 2,038 | 11 |
| None | 399,337 | - |
Food Environment Statistics:
| This county: | 2.39 / 10,000 pop. |
| New York: | 4.13 / 10,000 pop. |
| Monroe County: | 0.10 / 10,000 pop. |
| New York: | 0.06 / 10,000 pop. |
| Here: | 0.96 / 10,000 pop. |
| New York: | 0.92 / 10,000 pop. |
| Monroe County: | 2.32 / 10,000 pop. |
| State: | 1.68 / 10,000 pop. |
| Monroe County: | 7.54 / 10,000 pop. |
| New York: | 8.82 / 10,000 pop. |
| Here: | 7.9% |
| New York: | 8.2% |
| Here: | 26.4% |
| New York: | 23.8% |
| Monroe County: | 13.4% |
| State: | 15.6% |
Health and Nutrition:
| Here: | 52.6% |
| New York: | 50.1% |
| Irondequoit: | 49.8% |
| State: | 48.1% |
| Irondequoit: | 28.6 |
| State: | 28.5 |
| Irondequoit: | 19.7% |
| New York: | 20.3% |
| This city: | 10.8% |
| New York: | 11.1% |
| Irondequoit: | 6.9 |
| State: | 6.8 |
| Here: | 35.2% |
| New York: | 33.4% |
| Irondequoit: | 57.3% |
| New York: | 56.5% |
| Irondequoit: | 77.2% |
| New York: | 80.2% |
More about Health and Nutrition of Irondequoit, NY Residents
3.45% of this county's 2021 resident taxpayers lived in other counties in 2020 ($64,907 average adjusted gross income)
| Here: | 3.45% |
| New York average: | 5.29% |
0.01% of residents moved from foreign countries ($70 average AGI)
Monroe County: 0.01% New York average: 0.01%
Top counties from which taxpayers relocated into this county between 2020 and 2021:
| from Ontario County, NY | |
| from Wayne County, NY | |
| from Erie County, NY |
4.11% of this county's 2020 resident taxpayers moved to other counties in 2021 ($66,936 average adjusted gross income)
| Here: | 4.11% |
| New York average: | 6.93% |
0.01% of residents moved to foreign countries ($84 average AGI)
Monroe County: 0.01% New York average: 0.02%
Top counties to which taxpayers relocated from this county between 2020 and 2021:
| to Ontario County, NY | |
| to Wayne County, NY | |
| to Livingston County, NY |
| Businesses in Irondequoit, NY | ||||
| Name | Count | Name | Count | |
|---|---|---|---|---|
| Blockbuster | 1 | Payless | 1 | |
| Cold Stone Creamery | 1 | Staples | 1 | |
| Curves | 1 | Starbucks | 2 | |
| Dunkin Donuts | 1 | Subway | 1 | |
| GameStop | 1 | T-Mobile | 1 | |
| KFC | 1 | Target | 1 | |
| McDonald's | 1 | Tim Hortons | 1 | |
| Nike | 1 | Walgreens | 1 | |
| Papa John's Pizza | 1 | Wendy's | 1 | |
Strongest AM radio stations in Irondequoit:
- WHAM (1180 AM; 50 kW; ROCHESTER, NY; Owner: CITICASTERS LICENSES, L.P.)
- WHIC (1460 AM; 5 kW; ROCHESTER, NY; Owner: HOLY FAMILY COMMUNICATIONS)
- WHTK (1280 AM; 5 kW; ROCHESTER, NY)
- WXXI (1370 AM; 5 kW; ROCHESTER, NY; Owner: WXXI PUBLIC BROADCASTING COUNCIL)
- WLGZ (990 AM; 5 kW; ROCHESTER, NY; Owner: KIMTRON, INC.)
- WROC (950 AM; 1 kW; ROCHESTER, NY)
- WWKB (1520 AM; 50 kW; BUFFALO, NY; Owner: ENTERCOM BUFFALO LICENSE, LLC)
- WACK (1420 AM; 5 kW; NEWARK, NY; Owner: PEMBROOK PINES, INC.)
- WYSL (1040 AM; 2 kW; AVON, NY; Owner: RADIO LIVINGSTON, LTD)
- WTOR (770 AM; daytime; 9 kW; YOUNGSTOWN, NY; Owner: BIRACH BROADCASTING CORPORATION)
- WABH (1380 AM; 10 kW; BATH, NY)
- WGY (810 AM; 50 kW; SCHENECTADY, NY; Owner: CLEAR CHANNEL BROADCASTING LICENSES, INC.)
- WASB (1590 AM; 1 kW; BROCKPORT, NY; Owner: DAVID L. WOLFE)
Strongest FM radio stations in Irondequoit:
- WKGS (106.7 FM; IRONDEQUOIT, NY; Owner: CITICASTERS LICENSES, L.P.)
- WDKX (103.9 FM; ROCHESTER, NY; Owner: MONROE COUNTY BROADCASTING CO., LTD.)
- WIRQ (104.7 FM; ROCHESTER, NY; Owner: WEST IRONDEQUOIT CENTRAL SCHOOL DST.)
- WRMM-FM (101.3 FM; ROCHESTER, NY; Owner: INFINITY RADIO OPERATIONS INC.)
- WBZA (98.9 FM; ROCHESTER, NY; Owner: ENTERCOM ROCHESTER LICENSE, LLC.)
- WRUR-FM (88.5 FM; ROCHESTER, NY; Owner: UNIVERSITY OF ROCHESTER B/CAST CORP.)
- WBEE-FM (92.5 FM; ROCHESTER, NY; Owner: ENTERCOM ROCHESTER LICENSE, LLC.)
- WCMF-FM (96.5 FM; ROCHESTER, NY; Owner: INFINITY RADIO OPERATIONS INC.)
- WXXI-FM (91.5 FM; ROCHESTER, NY; Owner: WXXI PUBLIC BROADCASTING COUNCIL)
- W238AB (95.5 FM; ROCHESTER, NY; Owner: CITICASTERS LICENSES, L.P.)
- WZNE (94.1 FM; BRIGHTON, NY; Owner: INFINITY RADIO OPERATIONS INC.)
- WPXY-FM (97.9 FM; ROCHESTER, NY; Owner: INFINITY RADIO OPERATIONS INC.)
- WDCZ-FM (102.7 FM; WEBSTER, NY; Owner: KIMTRON, INC.)
- WBBF-FM (93.3 FM; FAIRPORT, NY; Owner: ENTERCOM ROCHESTER LICENSE, LLC.)
- WJZR (105.9 FM; ROCHESTER, NY; Owner: NORTH COAST RADIO, INC.)
- WZXV (99.7 FM; PALMYRA, NY; Owner: CALVARY CHAPEL OF FINGER LAKES, INC.)
- WVOR-FM (100.5 FM; ROCHESTER, NY; Owner: CITICASTERS LICENSES, L.P.)
- WBER (90.5 FM; ROCHESTER, NY; Owner: MONROE B.O.C.E.S. #1)
- WMHN (89.3 FM; WEBSTER, NY; Owner: MARS HILL B/CNG COMPANY, INC.)
- WGMC (90.1 FM; GREECE, NY; Owner: GREECE CENTRAL SCHOOL DISTRICT)
TV broadcast stations around Irondequoit:
- WBXO-LP (Channel 15; ROCHESTER, NY; Owner: METRO TV, INC.)
- WBGT-LP (Channel 40; ROCHESTER, NY; Owner: WBGT, LLC)
- WUHF (Channel 31; ROCHESTER, NY; Owner: WUHF LICENSEE, LLC)
- WOKR (Channel 13; ROCHESTER, NY; Owner: CENTRAL NY NEWS, INC.)
- WHEC-TV (Channel 10; ROCHESTER, NY; Owner: WHEC-TV, LLC)
- WROC-TV (Channel 8; ROCHESTER, NY; Owner: NEXSTAR BROADCASTING OF ROCHESTER, LLC)
- WXXI-TV (Channel 21; ROCHESTER, NY; Owner: WXXI PUBLIC BROADCASTING COUNCIL)
- W42CO (Channel 42; ROCHESTER, NY; Owner: TRI-STATE CHRISTIAN TV, INC.)
- WAWW-LP (Channel 38; ROCHESTER, NY; Owner: VENTURE TECHNOLOGIES GROUP, LLC)
- WROH-LP (Channel 47; ROCHESTER, NY; Owner: TIGER EYE BROADCASTING CORPORATION)
- WPXJ-TV (Channel 51; BATAVIA, NY; Owner: PAXSON BUFFALO LICENSE, INC.)
- W26BZ (Channel 26; VICTOR, NY; Owner: WBGT, LLC)
- WGCE-CA (Channel 6; GREECE/ROCHESTER, NY; Owner: SALVATORE J. CATERINO)
- National Bridge Inventory (NBI) Statistics
- 49Number of bridges
- 597ft / 182mTotal length
- $265,400,000Total costs
- 1,253,035Total average daily traffic
- 22,467Total average daily truck traffic
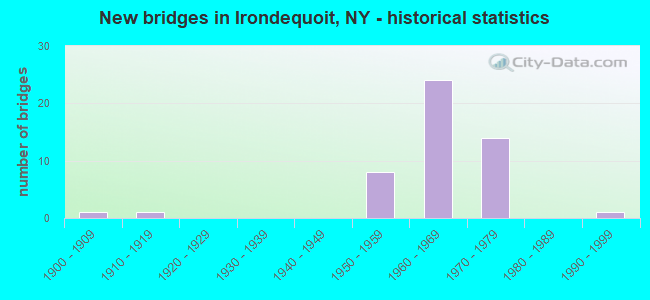
- New bridges - historical statistics
- 11900-1909
- 11910-1919
- 81950-1959
- 241960-1969
- 141970-1979
- 11990-1999
FCC Registered Cell Phone Towers:
1- Helendale Cell Site 500 Helendale Road (Lat: 43.179500 Lon: -77.543889), Structure height: 14.3 m, Call Sign: KNKA297
Assigned Frequencies: 880.020 MHz, 880.020 MHz, 880.020 MHz, 891.510 MHz, 891.510 MHz, 891.510 MHz, 835.020 MHz, 835.020 MHz, 835.020 MHz, 846.510 MHz, 846.510 MHz, 846.510 MHzGrant Date: 04/14/2015, Expiration Date: 05/15/2025, Certifier: Gregory M RomanoRegistrant: Verizon, 1300 I Street Nw - Suite 500 East, Washington, DC 20005, Phone: (202) 515-2453, Email:
FCC Registered Antenna Towers:
4- Douglas I Brandon, 992 Carter Street (Lat: 43.195833 Lon: -77.591667), Type: 47.2, Overall height: 47.2 m, Registrant: At&t Wireless Services, Inc., Esther.Hilliard@attws.Com, , Washi-ngton, Phone: (202) 223-9222
- Douglas I Brandon, 31 Dozier Lane (Lat: 43.200833 Lon: -77.546111), Type: 47.2, Overall height: 47.2 m, Registrant: At&t Wireless Services, Inc., Esther.Hilliard@attws.Com, , Washi-ngton, Phone: (202) 223-9222
- Douglas I Brandon, 992 Carter Street (Lat: 43.195833 Lon: -77.591667), Type: 47.2, Overall height: 47.2 m, Registrant: At&t Wireless Services, Inc., Esther.Hilliard@attws.Com, , Washi-ngton, Phone: (202) 223-9222
- Douglas I Brandon, 31 Dozier Lane (Lat: 43.200833 Lon: -77.546111), Type: 47.2, Overall height: 47.2 m, Registrant: At&t Wireless Services, Inc., Esther.Hilliard@attws.Com, , Washi-ngton, Phone: (202) 223-9222
FCC Registered Private Land Mobile Towers:
2- 1630 Empire Blvd (Lat: 43.181722 Lon: -77.507778), Type: Bant, Structure height: 14 m, Overall height: 15 m, Call Sign: WPHB340,
Assigned Frequencies: 929.762 MHz, Grant Date: 06/26/2000, Expiration Date: 06/26/2010, Cancellation Date: 10/02/2002, Certifier: Paul H Kuzia, Registrant: Wilkinson Barker Knauer, LLP, 2300 N Street, N.W., 7th Floor, Washington, DC 20037, Phone: (202) 783-4141, Fax: (202) 783-5851, Email:
- 1630 Empire Blvd (Lat: 43.181722 Lon: -77.507778), Type: Building, Structure height: 14 m, Call Sign: WPHV817,
Assigned Frequencies: 929.587 MHz, 929.862 MHz, Grant Date: 07/27/2000, Expiration Date: 07/27/2010, Cancellation Date: 07/09/2001, Certifier: Dale W Carter, Registrant: Paging Network Of America, Inc., 1500 International Pkwy, Suite 300, Richardson, TX 75081, Phone: (972) 801-0304, Fax: (972) 801-0330
FCC Registered Broadcast Land Mobile Towers:
5- 718 Washington Ave Sta 38 (Lat: 43.248944 Lon: -77.595833), Call Sign: WCH479,
Assigned Frequencies: 173.396 MHz, Grant Date: 03/08/2022, Expiration Date: 01/10/2032, Registrant: Utilities Technology Council, 2550 South Clark St., Suite 960, Arlington, VA 22202, Phone: (202) 833-6818, Fax: (202) 872-1331, Email:
- 2530 Norton St (Lat: 43.188944 Lon: -77.553889), Call Sign: WCH872, Licensee ID: L00002637,
Assigned Frequencies: 173.396 MHz, Grant Date: 02/26/2002, Expiration Date: 01/10/2012, Cancellation Date: 12/22/2011, Registrant: Rochester Gas & Electric Corp, 89 East Ave, Rochester, NY 14649, Phone: (585) 724-8821
- 19 Grange Pl Station 68 (Lat: 43.209778 Lon: -77.600000), Call Sign: WCH914,
Assigned Frequencies: 173.396 MHz, Grant Date: 03/09/2022, Expiration Date: 01/10/2032, Registrant: Utilities Technology Council, 2550 South Clark St., Suite 960, Arlington, VA 22202, Phone: (202) 833-6818, Fax: (202) 872-1331, Email:
- 2254 N Goodman St Station 81 (Lat: 43.198111 Lon: -77.576111), Call Sign: WCH920, Licensee ID: L00002637,
Assigned Frequencies: 173.396 MHz, Grant Date: 02/25/2002, Expiration Date: 01/10/2012, Cancellation Date: 12/22/2011, Registrant: Rochester Gas & Electric Corp, 89 East Ave, Rochester, NY 14649, Phone: (716) 724-8552
- 250 Seneca Park Ave Sta 97 (Lat: 43.225611 Lon: -77.602500), Call Sign: WCH485,
Assigned Frequencies: 173.396 MHz, Grant Date: 03/08/2022, Expiration Date: 01/10/2032, Registrant: Utilities Technology Council, 2550 South Clark St., Suite 960, Arlington, VA 22202, Phone: (202) 833-6818, Fax: (202) 872-1331, Email:
FCC Registered Microwave Towers:
6- NY-ROC040B, 1450 Portland Avenue (Lat: 43.192750 Lon: -77.582111), Type: Building, Structure height: 64 m, Call Sign: WQHR708,
Assigned Frequencies: 11225.0 MHz, 11465.0 MHz, Grant Date: 09/26/2017, Expiration Date: 10/17/2027, Cancellation Date: 06/28/2019, Certifier: Nadja Sodos-Wallace, Registrant: Sprint Corporation, 12502 Sunrise Valley Drive, M/S: Varesa0209, Reston, VA 20196, Phone: (800) 572-8256, Fax: (703) 433-4483, Email:
- NY-ROC025A, 400 Seneca Road (Lat: 43.216972 Lon: -77.545750), Type: Tank, Structure height: 61 m, Call Sign: WQHY486,
Assigned Frequencies: 11015.0 MHz, 11095.0 MHz, 10735.0 MHz, 10815.0 MHz, 10735.0 MHz, 23025.0 MHz, Grant Date: 11/14/2017, Expiration Date: 11/30/2027, Cancellation Date: 06/28/2019, Certifier: Nadja Sodos-Wallace, Registrant: Sprint Corporation, 12502 Sunrise Valley Drive, M/S: Varesa0209, Reston, VA 20196, Phone: (800) 572-8256, Fax: (703) 433-4483, Email:
- NY-ROC027A, 260 Cooper Road (Lat: 43.217278 Lon: -77.598361), Type: Tower, Structure height: 30.5 m, Call Sign: WQMF643,
Assigned Frequencies: 10735.0 MHz, 10815.0 MHz, Grant Date: 07/27/2010, Expiration Date: 07/27/2020, Cancellation Date: 07/28/2017, Certifier: Nadja S Sodos-Wallace, Registrant: Sprint Corporation, 12502 Sunrise Valley Drive, M/S: Varesa0209, Reston, VA 20196, Phone: (800) 572-8256, Fax: (703) 433-4483, Email:
- NY-ROC024A, 31 Dozier Road (Lat: 43.200750 Lon: -77.546167), Type: Pole, Structure height: 45.7 m, Call Sign: WQMI215,
Assigned Frequencies: 21825.0 MHz, 17815.0 MHz, 21925.0 MHz, 17915.0 MHz, Grant Date: 08/12/2010, Expiration Date: 08/12/2020, Cancellation Date: 05/21/2019, Certifier: Nadja S Sodos-Wallace, Registrant: Sprint Corporation, 12502 Sunrise Valley Drive, M/S: Varesa0209, Reston, VA 20196, Phone: (800) 572-8256, Fax: (703) 433-4483, Email:
- NY-ROC0148, 1500 Ave (Lat: 43.193389 Lon: -77.580917), Type: Bant, Structure height: 36.6 m, Call Sign: WQPP317,
Assigned Frequencies: 11225.0 MHz, 11225.0 MHz, 11305.0 MHz, 11305.0 MHz, Grant Date: 07/11/2012, Expiration Date: 07/11/2022, Cancellation Date: 05/21/2019, Certifier: Nadja S Sodos-Wallace, Registrant: Sprint Corporation, 12502 Sunrise Valley Drive, M/S: Varesa0209, Reston, VA 20196, Phone: (800) 572-8256, Fax: (703) 433-4483, Email:
- IRONDEQUOIT, 400 Seneca Rd (Lat: 43.217000 Lon: -77.545528), Structure height: 41.5 m, Call Sign: WLV365,
Assigned Frequencies: 18605.0 MHz, Grant Date: 01/30/2001, Expiration Date: 01/15/2011, Cancellation Date: 10/07/2010, Certifier: Carol L Tacker, Registrant: At&t Mobility LLC, 5601 Legacy Drive Ms A-3, Plano, TX 75024, Phone: (469) 229-7471, Fax: (469) 229-7297, Email:
FCC Registered Paging Towers:
1- 433 Cooper Rd (Lat: 43.219333 Lon: -77.599667), Type: Tower, Structure height: 25 m, Overall height: 26.8 m, Call Sign: WPWY916,
Assigned Frequencies: 931.312 MHz, Grant Date: 09/27/2022, Expiration Date: 10/30/2032, Certifier: Richard J Verdouw, Registrant: Monroe County Public Safety Communications, 1530 Highland Ave, Rochester, NY 14618, Phone: (585) 428-5679, Fax: (585) 473-7807, Email:
FCC Registered Amateur Radio Licenses:
2- Call Sign: KD2MJB, Licensee ID: L02067496, Grant Date: 12/02/2016, Expiration Date: 12/02/2026, Certifier: Juan D Salguero, Registrant: Juan D Salguero, 922 Edgecreek Trail, Irondequoit, NY 14609
- Call Sign: KM6NJQ, Licensee ID: L02138365, Grant Date: 10/24/2017, Expiration Date: 10/24/2027, Certifier: Robert M English, Registrant: Robert M English, 463 Culver Pkwy, Irondequoit, NY 14609
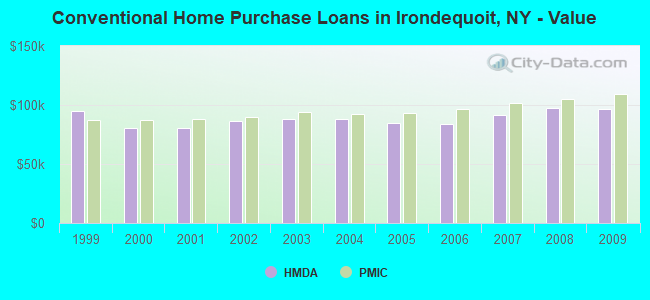
| Home Mortgage Disclosure Act Aggregated Statistics For Year 2009 (Based on 12 full and 1 partial tracts) | ||||||||||||||
| A) FHA, FSA/RHS & VA Home Purchase Loans | B) Conventional Home Purchase Loans | C) Refinancings | D) Home Improvement Loans | E) Loans on Dwellings For 5+ Families | F) Non-occupant Loans on < 5 Family Dwellings (A B C & D) | G) Loans On Manufactured Home Dwelling (A B C & D) | ||||||||
|---|---|---|---|---|---|---|---|---|---|---|---|---|---|---|
| Number | Average Value | Number | Average Value | Number | Average Value | Number | Average Value | Number | Average Value | Number | Average Value | Number | Average Value | |
| LOANS ORIGINATED | 492 | $103,409 | 289 | $96,541 | 530 | $96,531 | 181 | $15,543 | 1 | $3,301,420 | 31 | $85,157 | 0 | $0 |
| APPLICATIONS APPROVED, NOT ACCEPTED | 12 | $100,883 | 13 | $95,622 | 67 | $105,771 | 19 | $31,633 | 0 | $0 | 0 | $0 | 0 | $0 |
| APPLICATIONS DENIED | 35 | $108,011 | 23 | $87,708 | 202 | $103,134 | 108 | $20,852 | 0 | $0 | 11 | $83,910 | 2 | $30,925 |
| APPLICATIONS WITHDRAWN | 32 | $104,889 | 15 | $159,899 | 141 | $102,805 | 14 | $31,204 | 0 | $0 | 6 | $93,067 | 0 | $0 |
| FILES CLOSED FOR INCOMPLETENESS | 5 | $56,064 | 4 | $69,405 | 40 | $108,999 | 3 | $81,347 | 0 | $0 | 2 | $68,935 | 0 | $0 |
Detailed mortgage data for all 13 tracts in Irondequoit, NY
| Private Mortgage Insurance Companies Aggregated Statistics For Year 2009 (Based on 12 full and 1 partial tracts) | ||||||
| A) Conventional Home Purchase Loans | B) Refinancings | C) Non-occupant Loans on < 5 Family Dwellings (A & B) | ||||
|---|---|---|---|---|---|---|
| Number | Average Value | Number | Average Value | Number | Average Value | |
| LOANS ORIGINATED | 87 | $109,430 | 36 | $114,760 | 0 | $0 |
| APPLICATIONS APPROVED, NOT ACCEPTED | 13 | $93,359 | 4 | $175,250 | 3 | $63,783 |
| APPLICATIONS DENIED | 16 | $102,006 | 6 | $103,568 | 0 | $0 |
| APPLICATIONS WITHDRAWN | 4 | $114,188 | 2 | $96,525 | 0 | $0 |
| FILES CLOSED FOR INCOMPLETENESS | 1 | $78,840 | 1 | $156,000 | 0 | $0 |

2012 - 2018 National Fire Incident Reporting System (NFIRS) incidents
- Fire incident types reported to NFIRS in Irondequoit, NY
- 17457.2%Structure Fires
- 9531.2%Outside Fires
- 227.2%Mobile Property/Vehicle Fires
- 134.3%Other
 According to the data from the years 2012 - 2018 the average number of fires per year is 43. The highest number of reported fire incidents - 67 took place in 2016, and the least - 12 in 2012. The data has an increasing trend.
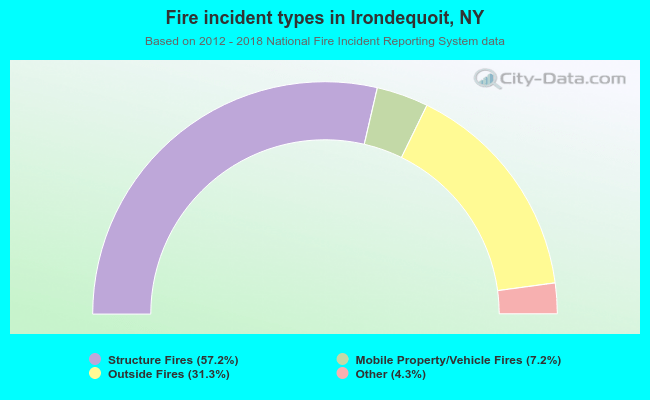 When looking into fire subcategories, the most incidents belonged to: Structure Fires (57.2%), and Outside Fires (31.2%).
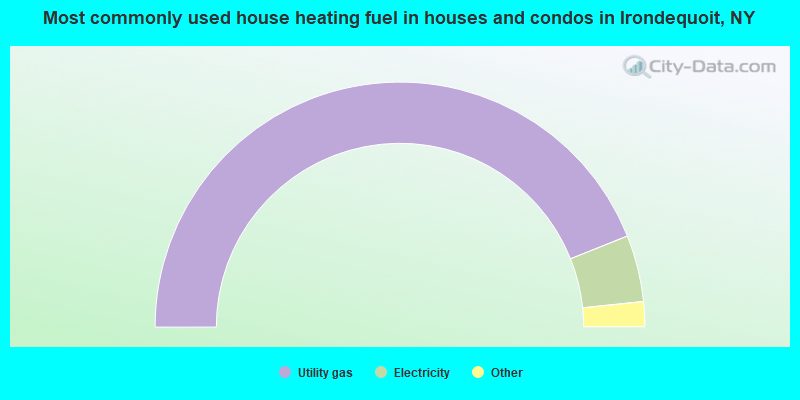
- 87.9%Utility gas
- 8.8%Electricity
- 1.4%Bottled, tank, or LP gas
- 1.4%Fuel oil, kerosene, etc.
- 0.3%Wood
- 0.1%Other fuel
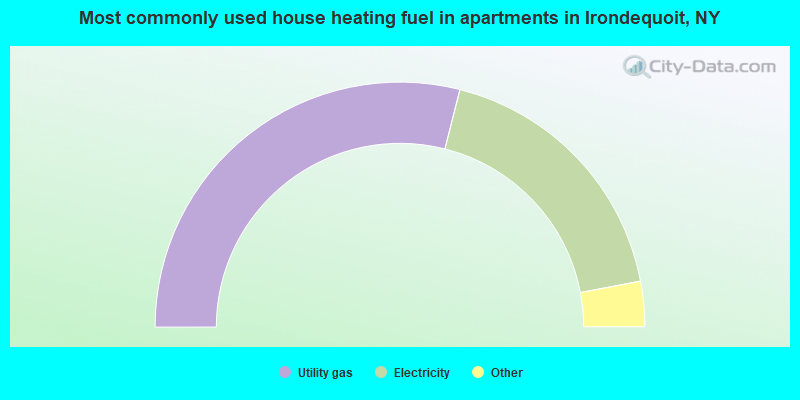
- 57.9%Utility gas
- 36.1%Electricity
- 2.3%Bottled, tank, or LP gas
- 1.9%Fuel oil, kerosene, etc.
- 1.0%Other fuel
- 0.8%No fuel used
Irondequoit compared to New York state average:
- Median house value significantly below state average.
- Unemployed percentage significantly below state average.
- Black race population percentage below state average.
- Hispanic race population percentage below state average.
- Foreign-born population percentage significantly below state average.
- Renting percentage below state average.
- Length of stay since moving in above state average.
Irondequoit on our top lists:
- #8 on the list of "Top 101 cities with the most people born in the same U.S. state as the city (population 50,000+)"
- #23 on the list of "Top 100 cities with the largest percentage of females (pop. 50,000+)"
- #26 on the list of "Top 100 cities with oldest residents (pop. 50,000+)"
- #27 on the list of "Top 101 cities with the lowest number of police officers per 1000 residents (population 50,000+)"
- #29 on the list of "Top 101 cities with the largest percentage of one, detached housing units in structures (20,000+ housing units)"
- #32 on the list of "Top 101 cities with the smallest house values disparities (population 50,000+)"
- #57 on the list of "Top 100 cities with lowest ratio of median house value to median household income (pop. 50,000+)"
- #60 on the list of "Top 101 cities with largest percentage of females in industries: information (population 50,000+)"
- #65 on the list of "Top 101 cities with the lowest average sunshine amount (population 50,000+)"
- #68 on the list of "Top 101 cities with the lowest average temperatures (population 50,000+)"
- #69 on the list of "Top 101 cities with the lowest minimum monthly sunshine amount (population 50,000+)"
- #77 on the list of "Top 100 cities with oldest houses (pop. 50,000+)"
- #84 on the list of "Top 100 cities with declining populations from 2000 to 2014 (pop. 50,000+)"
- #85 on the list of "Top 101 cities that people commute from (largest negative percentage daily daytime population change due to commuting) (population 50,000+)"
- #88 on the list of "Top 101 cities with the least people below 50% of the poverty level (population 50,000+)"
- #88 on the list of "Top 101 cities with the largest percentage of likely lesbian couples (counted as self-reported female-female unmarried-partner households) (population 50,000+)"
- #88 on the list of "Top 101 cities with fewest building permits per 10,000 residents (population 50,000+)"
- #89 on the list of "Top 101 cities with largest percentage of males in occupations: health technologists and technicians (population 50,000+)"
- #98 on the list of "Top 101 cities with the largest wind speed differences during a year (population 50,000+)"
- #100 on the list of "Top 101 cities with largest percentage of females in industries: educational services (population 50,000+)"
- #20 on the list of "Top 101 counties with the highest percentage of residents that visited a dentist within the past year"
- #21 on the list of "Top 101 counties with the largest increase in the number of infant deaths per 1000 residents 2000-2006 to 2007-2013 (pop. 50,000+)"
- #22 on the list of "Top 101 counties with the lowest percentage of residents relocating from other counties between 2010 and 2011 (pop. 50,000+)"
- #33 on the list of "Top 101 counties with the lowest percentage of residents relocating to other counties in 2011"
- #35 on the list of "Top 101 counties with the most Catholic congregations (pop. 50,000+)"

|
|
Total of 71 patent applications in 2008-2024.