Culver City: Fire Incidents, California (CA)
Where are fire incidents reported in Culver City, CA
Something went wrong! Please refresh the page.
|
| |||||||||||||||||||||||||||||||||||||||||||||||||||||||||||||||||||||||||||||||||||||||||||||||||||||||||||||
2005 - 2018 National Fire Incident Reporting System (NFIRS) incidents
- Incident types reported to NFIRS in Culver City, CA
- 17,28372.8%Rescue & EMS
- 2,46210.4%False Alarm
- 1,5836.7%Good Intent Call
- 1,0544.4%Service Call
- 7693.2%Hazardous Condition
- 5012.1%Fire
- 610.3%Overpressure Rupture
- Fire incident types reported to NFIRS in Culver City, CA
- 18035.9%Outside Fires
- 17033.9%Structure Fires
- 11723.4%Mobile Property/Vehicle Fires
- 346.8%Other
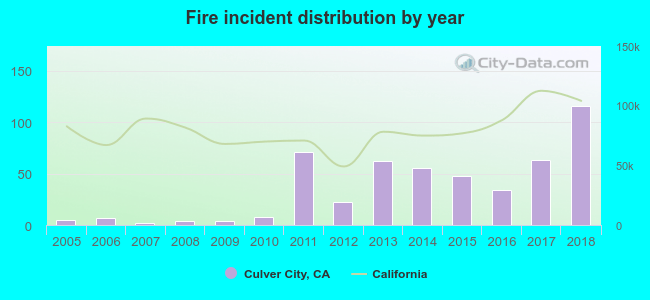 Based on the data from the years 2005 - 2018 the average number of fires per year is 36. The highest number of reported fire incidents - 116 took place in 2018, and the least - 2 in 2007. The data has a rising trend.
The average number of yearly fire incidents per 10k residents in Culver City, CA compared to nearest cities:
(Note: Based on data for the last 3 years, including only cities with population 5,000 and above)
| Culver City: | 17.9 |
| Ladera Heights: | 17.4 |
| Marina del Rey: | 28.9 |
| Beverly Hills: | 24.5 |
| Inglewood: | 23.8 |
| Santa Monica: | 23.0 |
| Lennox: | 13.5 |
| Los Angeles: | 16.6 |
| West Hollywood: | 25.5 |
 The median response time based on all reported fire incidents is 6 minutes. This is similar to the state median value.
The median response time in Culver City, CA compared to nearest cities:
(Note: Based on data for all years, including only cities with at least 500 fire incidents)
| Culver City: | 6 minutes |
| Beverly Hills: | 5 minutes |
| Inglewood: | 4 minutes |
| Santa Monica: | 5 minutes |
| Los Angeles: | 5 minutes |
| West Hollywood: | 4 minutes |
| El Segundo: | 5 minutes |
| Hawthorne: | 4 minutes |
| Manhattan Beach: | 5 minutes |
 35.3% incidents where reported in the morning and 64.7% in the evening. The most fires (17.2%) took place on Friday, and the least (12.2%) on Monday.
 According to the 501 fire incidents from years 2005 - 2018 most fires (13.8%) took place during January, and the least (6.2%) in August.
 Out of all 23,739 cases reported during the years 2005 - 2018, the most belonged to the categories: Rescue & EMS (72.8%), False Alarm (10.4%), and Good Intent Call (6.7%).
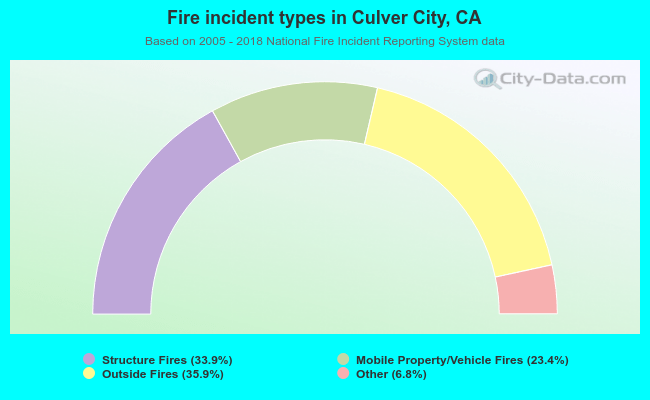 When looking into fire subcategories, the most reports belonged to: Outside Fires (35.9%), and Structure Fires (33.9%).