Marina del Rey: Fire Incidents, California (CA)
Where are fire incidents reported in Marina del Rey, CA
Something went wrong! Please refresh the page.
|
| |||||||||||||||||||||||||||||||||||||||||||||||||||||||||||||||||||||||||||||||||||||||||||||||||||||||||||||
2005 - 2018 National Fire Incident Reporting System (NFIRS) incidents
- Incident types reported to NFIRS in Marina del Rey, CA
- 3,29154.2%Rescue & EMS
- 1,32321.8%Good Intent Call
- 74812.3%False Alarm
- 2694.4%Fire
- 2694.4%Service Call
- 1492.5%Hazardous Condition
- 110.2%Special Incident
- Fire incident types reported to NFIRS in Marina del Rey, CA
- 12345.7%Structure Fires
- 6624.5%Mobile Property/Vehicle Fires
- 5119.0%Outside Fires
- 2910.8%Other
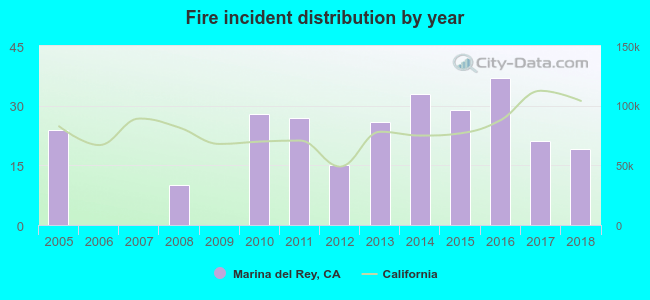 Based on the data from the years 2005 - 2018 the average number of fires per year is 19. The highest number of reported fire incidents - 37 took place in 2016, and the least - 0 in 2006. The data has a decreasing trend.
The average number of yearly fire incidents per 10k residents in Marina del Rey, CA compared to nearest cities:
(Note: Based on data for the last 3 years, including only cities with population 5,000 and above)
| Marina del Rey: | 28.9 |
| Santa Monica: | 23.0 |
| Culver City: | 17.9 |
| Ladera Heights: | 17.4 |
| El Segundo: | 31.3 |
| Lennox: | 13.5 |
| Inglewood: | 23.8 |
| Manhattan Beach: | 13.8 |
| Beverly Hills: | 24.5 |

 34.9% incidents where reported in the morning and 65.1% in the evening. The most fires (18.6%) took place on Saturday, and the least (11.2%) on Tuesday.
 According to the 269 fires from years 2005 - 2018 most fires (10.8%) took place during July, and the least (6.3%) in September.
 Out of all 6,067 cases reported during the years 2005 - 2018, the most belonged to the categories: Rescue & EMS (54.2%), Good Intent Call (21.8%), and False Alarm (12.3%).
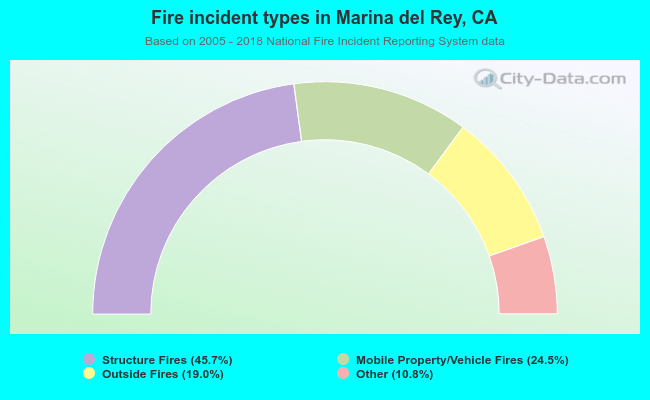 When looking into fire subcategories, the most incidents belonged to: Structure Fires (45.7%), and Mobile Property/Vehicle Fires (24.5%).