Kailua: Fire Incidents, Hawaii (HI)
Where are fire incidents reported in Kailua, HI
Something went wrong! Please refresh the page.
| Fire incidents reported | |
|---|---|
| Sreet name | Count |
| KAILUA RD | 162 |
| KAPAA QUARRY RD | 144 |
| KEOLU DR | 142 |
| KALAHEO AVE | 80 |
| KAWAILOA RD | 76 |
| HAMAKUA DR | 60 |
| KALANIANAOLE HWY | 56 |
| KANEOHE BAY DR | 54 |
| PALI HWY | 54 |
| KAINALU DR | 44 |
| ONEAWA ST | 44 |
| ILIAINA ST | 42 |
| KUULEI RD | 40 |
| KIHAPAI ST | 38 |
| MOKULUA DR | 36 |
| AULOA RD | 34 |
| MOKAPU BLVD | 28 |
| MALUNIU AVE | 26 |
| HEKILI ST | 24 |
| KAI ONE PL | 24 |
| LIHIWAI RD | 24 |
| MAUNAWILI RD | 24 |
| AULIKE ST | 22 |
| ILIHAU ST | 20 |
| ULUKAHIKI ST | 20 |
| AOLOA ST | 18 |
| KAWAINUI ST | 18 |
| AOLOA PL | 16 |
| DUNE CIR | 16 |
| WAILEPO ST | 16 |
2003 - 2018 National Fire Incident Reporting System (NFIRS) incidents
- Incident types reported to NFIRS in Kailua, HI
- 4,35144.5%Rescue & EMS
- 1,57216.1%Good Intent Call
- 1,37914.1%Hazardous Condition
- 1,12811.5%Fire
- 7687.9%Service Call
- 5775.9%False Alarm
- Fire incident types reported to NFIRS in Kailua, HI
- 53247.2%Outside Fires
- 34430.5%Structure Fires
- 24822.0%Mobile Property/Vehicle Fires
- 40.4%Other
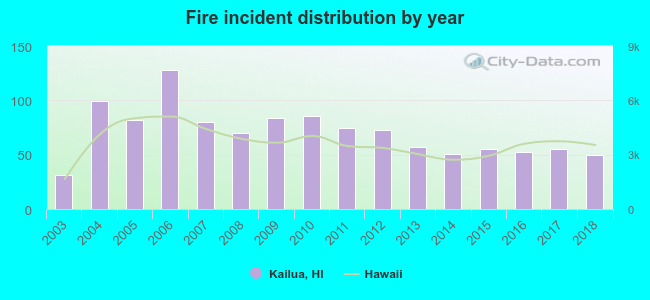 According to the data from the years 2003 - 2018 the average number of fire incidents per year is 71. The highest number of fire incidents - 128 took place in 2006, and the least - 31 in 2003. The data has an increasing trend.
 The median response time based on all reported fire incidents is 6 minutes. This is about the same as the Hawaii median value.
 Based on the reports from the years 2003 - 2018 the average number of fire-related casualties per year is 0. The highest number of reported injuries - 4 took place in 2014, and the lowest - 0 in 2003. The data has a constant trend.
The average number of casualties per 1,000 fires is 6. This indicator was the highest - 78 in 2014, and the lowest 0 in 2003. The trend for casualties per 1,000 fire incidents is constant. Compared to the state value the number of casualties per 1,000 fire incidents is similar.
Based on the reports from the years 2003 - 2018 the average number of fire-related casualties per year is 0. The highest number of reported injuries - 4 took place in 2014, and the lowest - 0 in 2003. The data has a constant trend.
The average number of casualties per 1,000 fires is 6. This indicator was the highest - 78 in 2014, and the lowest 0 in 2003. The trend for casualties per 1,000 fire incidents is constant. Compared to the state value the number of casualties per 1,000 fire incidents is similar.
 36.8% incidents where reported in the morning and 63.2% in the evening. The most fires (18.5%) took place on Saturday, and the least (11.7%) on Tuesday.
 Based on the 1,128 reports from years 2003 - 2018 most fires (13.3%) took place during January, and the least (6.3%) in February.
 Out of all 9,778 cases reported during the years 2003 - 2018, the most belonged to the categories: Rescue & EMS (44.5%), Good Intent Call (16.1%), and Hazardous Condition (14.1%).
 When looking into fire subcategories, the most incidents belonged to: Outside Fires (47.2%), and Structure Fires (30.5%).