Kihei: Fire Incidents, Hawaii (HI)
Where are fire incidents reported in Kihei, HI
Something went wrong! Please refresh the page.
| Fire incidents reported | |
|---|---|
| Sreet name | Count |
| KIHEI RD | 730 |
| PIILANI HWY | 100 |
| MOKULELE HWY | 88 |
| PIILANI HWY | 80 |
| KENOLIO RD | 72 |
| UWAPO RD | 70 |
| LIPOA ST | 56 |
| MAKENA RD | 48 |
| WELAKAHAO RD | 46 |
| PIIKEA AVE | 34 |
| HONOAPIILANI HWY | 22 |
| KANANI RD | 22 |
| KULANIHAKOI ST | 22 |
| LILOA ST | 22 |
| MANINO CIR | 22 |
| OHUKAI RD | 22 |
| ULUNIU RD | 22 |
| WAILEA ALANUI DR | 22 |
| ELEU PL | 20 |
| MOKULELE HWY | 20 |
| HALAMA ST | 18 |
| KAIOLA ST | 18 |
| KAWAILANI CIR | 18 |
| WAIPUILANI RD | 18 |
| HALE KUAI ST | 16 |
| KEALA PL | 16 |
| OE ST | 16 |
| OHUKAI RD | 16 |
| AUHANA RD | 14 |
| HOONANI ST | 14 |
2002 - 2018 National Fire Incident Reporting System (NFIRS) incidents
- Incident types reported to NFIRS in Kihei, HI
- 4,53951.0%Rescue & EMS
- 1,35815.3%Good Intent Call
- 1,30114.6%Fire
- 6337.1%Service Call
- 5316.0%False Alarm
- 5235.9%Hazardous Condition
- 120.1%Severe Weather
- Fire incident types reported to NFIRS in Kihei, HI
- 74157.0%Outside Fires
- 31624.3%Structure Fires
- 23918.4%Mobile Property/Vehicle Fires
- 50.4%Other
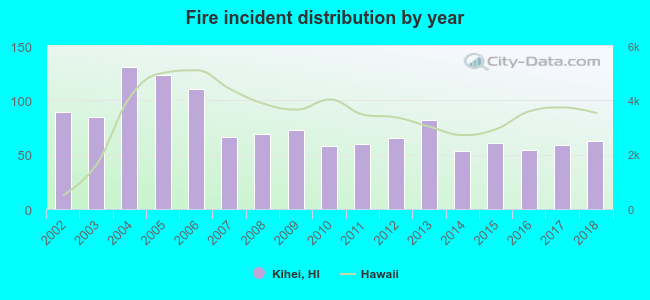 According to the data from the years 2002 - 2018 the average number of fires per year is 77. The highest number of reported fires - 131 took place in 2004, and the least - 53 in 2014. The data has a dropping trend.
The average number of yearly fire incidents per 10k residents in Kihei, HI compared to nearest cities:
(Note: Based on data for the last 3 years, including only cities with population 5,000 and above)
| Kihei: | 28.1 |
| Kula: | 34.5 |
| Kahului: | 29.2 |
| Pukalani: | 20.2 |
| Wailuku: | 23.3 |
| Makawao: | 20.4 |
| Lahaina: | 60.1 |
| Waimea: | 11.6 |
| Kailua: | 43.7 |
 The median response time based on all reported fire incidents is 6 minutes. This is comparable to the state median value.
The median response time in Kihei, HI compared to nearest cities:
(Note: Based on data for all years, including only cities with at least 500 fire incidents)
| Kihei: | 6 minutes |
| Kahului: | 6 minutes |
| Wailuku: | 6 minutes |
| Paia: | 6 minutes |
| Lahaina: | 8 minutes |
| Kailua: | 6 minutes |
| Waimanalo: | 7 minutes |
| Honolulu: | 5 minutes |
| Kaneohe: | 6 minutes |
 37.3% incidents where reported in the morning and 62.7% in the evening. The most fires (15.4%) took place on Sunday, and the least (13.1%) on Wednesday.
 According to the 1,301 fires from years 2002 - 2018 most fires (18.5%) took place during July, and the least (5.6%) in February.
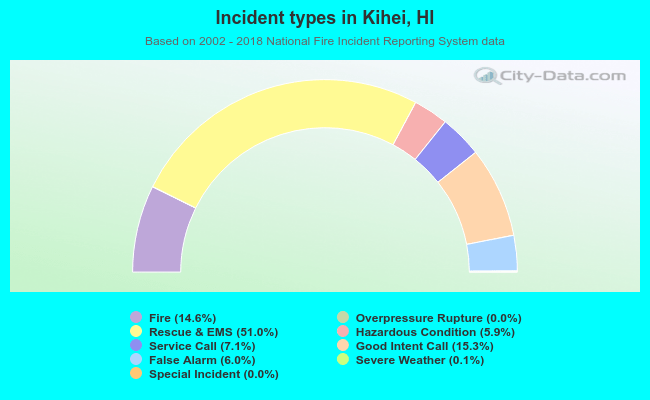 Out of all 8,901 cases reported during the years 2002 - 2018, the most belonged to the categories: Rescue & EMS (51.0%), Good Intent Call (15.3%), and Fire (14.6%).
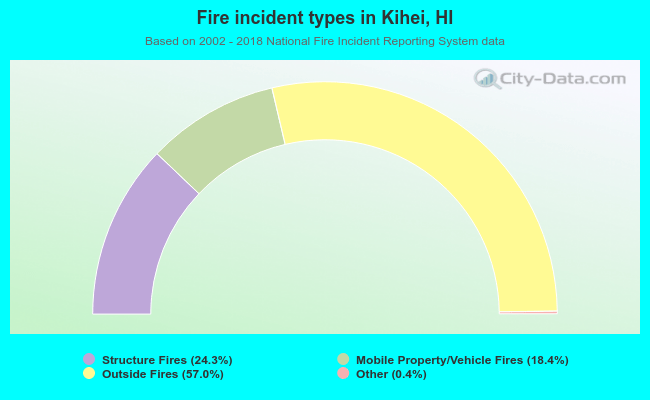 When looking into fire subcategories, the most reports belonged to: Outside Fires (57.0%), and Structure Fires (24.3%).