Lemon Grove, CA (California) Houses and Residents
| Lemon Grove: | $692,503 |
| California: | $715,900 |
Total population: 26,511 (Urban population: 24,954, Rural population: 0)
Houses: 9,636 (9,285 occupied: 5,038 owner occupied, 4,305 renter occupied)
| % of renters here: | 46% |
| State: | 44% |
Housing density: 2,536 houses/condos per square mile
Median price asked for vacant for-sale houses and condos in 2022: $9,271,831.
Median contract rent in 2022: $1,609 (lower quartile is $1,193, upper quartile is over $2,000)
Median rent asked for vacant for-rent units in 2022: $3,010
Median gross rent in Lemon Grove, CA in 2022: $1,720
Housing units in Lemon Grove with a mortgage: 4,158 (358 second mortgage, 0 home equity loan, 210 both second mortgage and home equity loan)
Houses without a mortgage: 41
Median household income for houses/condos with a mortgage: $106,224
Median household income for apartments without a mortgage: $79,840
Median monthly housing costs: $1,913
Compare current foreclosures in Lemon Grove, CA:
| Photo | Address | Area | Beds / Baths | Price | Details |
|---|---|---|---|---|---|

|
#1
Woodrow Ave
Lemon Grove, CA 91945
|
1,239 sq. feet
|
2 baths 3 beds |
show details | |

|
#2
Sherwood Dr
Lemon Grove, CA 91945
|
1,461 sq. feet
|
3 baths 3 beds |
show details | |

|
#3
Alton Dr
Lemon Grove, CA 91945
|
1,723 sq. feet
|
2 baths 3 beds |
show details | |

|
#4
Washington St
Lemon Grove, CA 91945
|
1,592 sq. feet
|
2 baths 4 beds |
show details | |

|
#5
El Prado Ave
Lemon Grove, CA 91945
|
1,666 sq. feet
|
2 baths 3 beds |
show details | |

|
#6
San Pasqual St
Lemon Grove, CA 91945
|
1,306 sq. feet
|
2 baths 3 beds |
show details | |

|
#7
Siegle Dr
Lemon Grove, CA 91945
|
1,406 sq. feet
|
2 baths 4 beds |
show details | |

|
#8
Ramon St
Lemon Grove, CA 91945
|
1,561 sq. feet
|
2 baths 3 beds |
show details | |

|
#9
Dain Dr
Lemon Grove, CA 91945
|
2,062 sq. feet
|
3 baths 4 beds |
show details | |

|
#10
Madera St
Lemon Grove, CA 91945
|
1,250 sq. feet
|
2 baths 3 beds |
show details |
| Photo | Address | Area | Beds / Baths | Price | Details |
|---|---|---|---|---|---|

|
#11
69th St
Lemon Grove, CA 91945
|
1,258 sq. feet
|
2 baths 3 beds |
show details | |

|
#12
Glencoe Dr
Lemon Grove, CA 91945
|
782 sq. feet
|
1 baths 2 beds |
show details | |

|
#13
Elroy Dr
Lemon Grove, CA 91945
|
1,008 sq. feet
|
1 baths 3 beds |
show details | |

|
#14
Golden Ave
Lemon Grove, CA 91945
|
1,242 sq. feet
|
1 baths 3 beds |
show details | |

|
#15
Eldora St
Lemon Grove, CA 91945
|
1,763 sq. feet
|
2 baths 4 beds |
show details | |

|
#16
Crane St
Lemon Grove, CA 91945
|
2,060 sq. feet
|
2 baths 4 beds |
show details | |

|
#17
Angelus Ave
Lemon Grove, CA 91945
|
2,123 sq. feet
|
3 baths 4 beds |
show details | |

|
#18
Primera St
Lemon Grove, CA 91945
|
1,656 sq. feet
|
2 baths 3 beds |
show details | |

|
#19
Blue Ash Dr
Lemon Grove, CA 91945
|
1,611 sq. feet
|
3 baths 4 beds |
show details | |

|
#20
Blossom Hill Dr
Lemon Grove, CA 91945
|
1,167 sq. feet
|
2 baths 3 beds |
show details |
| Photo | Address | Area | Beds / Baths | Price | Details |
|---|---|---|---|---|---|

|
#21
Roy St
Lemon Grove, CA 91945
|
1,270 sq. feet
|
2 baths 3 beds |
show details | |

|
#22
Lemon Grove Ave
Lemon Grove, CA 91945
|
728 sq. feet
|
1 baths 2 beds |
show details | |

|
#23
Loma Dr
Lemon Grove, CA 91945
|
1,220 sq. feet
|
1 baths 2 beds |
show details | |

|
#24
Washington St
Lemon Grove, CA 91945
|
- sq. feet
|
2 baths 3 beds |
show details | |

|
#25
Costada Ct
Lemon Grove, CA 91945
|
- sq. feet
|
- baths - beds |
show details | |

|
#26
New Jersey Ave
Lemon Grove, CA 91945
|
- sq. feet
|
- baths - beds |
show details | |

|
#27
Lermas Ct
Lemon Grove, CA 91945
|
- sq. feet
|
- baths - beds |
show details | |

|
#28
Washington St
Lemon Grove, CA 91945
|
- sq. feet
|
- baths - beds |
show details | |

|
#29
Goodman Ln
Lemon Grove, CA 91945
|
- sq. feet
|
- baths - beds |
show details | |

|
#30
Broadway
Lemon Grove, CA 91945
|
- sq. feet
|
- baths - beds |
show details |
| Photo | Address | Area | Beds / Baths | Price | Details |
|---|---|---|---|---|---|

|
#31
Cedral Pl
Lemon Grove, CA 91945
|
- sq. feet
|
- baths - beds |
show details | |

|
#32
Massachusetts Ave Apt 9
Lemon Grove, CA 91945
|
- sq. feet
|
- baths - beds |
show details | |

|
#33
Harris Street, Apt 16
Lemon Grove, CA 91945
|
- sq. feet
|
- baths - beds |
show details | |

|
#34
North Ave Apt 312
Lemon Grove, CA 91945
|
- sq. feet
|
- baths - beds |
show details | |

|
#35
Dartmoor Dr
Lemon Grove, CA 91945
|
- sq. feet
|
- baths - beds |
show details | |

|
#36
Fairhaven St
Lemon Grove, CA 91945
|
- sq. feet
|
- baths - beds |
show details | |

|
Check over 1 million property listings on Foreclosure.com!
|
browse all offers | |||


 | UT: San Diego home sales hit lowest level in 35 years. (43 replies) |
| Over crowding of Neighborhoods by home owners (43 replies) |
| Cheap Apartments In North County? (3 replies) |
| How's the Lemon Grove area right by Federal Blvd/Sam's Club? (2 replies) |
| How to find Venues / Houses for Party in San Diego? (5 replies) |
| Buying a House Under $400k? (84 replies) |

Median year apartment built: 1975
Household type by relationship:
Households: 27,369- Male householders: 4,594 (1,203 living alone), Female householders: 4,527 (956 living alone)
4,302 spouses (4,288 opposite-sex spouses), 669 unmarried partners, (659 opposite-sex unmarried partners), 8,474 children (8,251 natural, 136 adopted, 86 stepchildren), 1,158 grandchildren, 593 brothers or sisters, 627 parents, 0 foster children, 1,136 other relatives, 1,014 non-relatives
- In group quarters: 271
Size of family households: 2,187 2-persons, 1,811 3-persons, 1,165 4-persons, 545 5-persons, 338 6-persons, 298 7-or-more-persons.
Size of nonfamily households: 2,216 1-person, 649 2-persons, 66 3-persons, 17 4-persons.
3,272 married couples with children.
1,302 single-parent households (154 men, 1,148 women).
61.5% of residents of Lemon Grove speak English at home.
28.9% of residents speak Spanish at home (77% speak English very well, 13% speak English well, 8% speak English not well, 2% don't speak English at all).
1.3% of residents speak other Indo-European language at home (72% speak English very well, 13% speak English well, 1% speak English not well, 13% don't speak English at all).
5.6% of residents speak Asian or Pacific Island language at home (55% speak English very well, 33% speak English well, 11% speak English not well, 1% don't speak English at all).
2.3% of residents speak other language at home (38% speak English very well, 30% speak English well, 24% speak English not well, 7% don't speak English at all).
Foreign born population: 4,599 (16.8%)
(63.8% of them are naturalized citizens)
| Here: | 5.8 |
| State: | 6.0 |
| Here: | 4.0 |
| State: | 3.9 |

- Bedrooms in owner-occupied houses and condos in Lemon Grove, California
- 29no bedroom
- 961 bedroom
- 7392 bedrooms
- 2,9143 bedrooms
- 1,0524 bedrooms
- 2105+ bedrooms

- Bedrooms in renter-occupied apartments in Lemon Grove, California
- 260no bedroom
- 9241 bedroom
- 2,0412 bedrooms
- 8213 bedrooms
- 2444 bedrooms
- 145+ bedrooms

- Cars and other vehicles available in Lemon Grove in owner-occupied houses/condos
- 102no vehicle
- 7811 vehicle
- 2,1982 vehicles
- 1,2673 vehicles
- 2694 vehicles
- 4205+ vehicles

- Cars and other vehicles available in Lemon Grove in renter-occupied apartments
- 346no vehicle
- 1,7621 vehicle
- 1,3702 vehicles
- 5733 vehicles
- 1564 vehicles
- 985+ vehicles

- Rooms in owner-occupied houses in Lemon Grove, California
- 161 room
- 642 rooms
- 773 rooms
- 5894 rooms
- 1,3785 rooms
- 1,3826 rooms
- 7667 rooms
- 4548 rooms
- 3129+ rooms

- Rooms in renter-occupied apartments in Lemon Grove, California
- 2511 room
- 3112 rooms
- 8383 rooms
- 1,4014 rooms
- 9965 rooms
- 2946 rooms
- 1157 rooms
- 608 rooms
- 409+ rooms


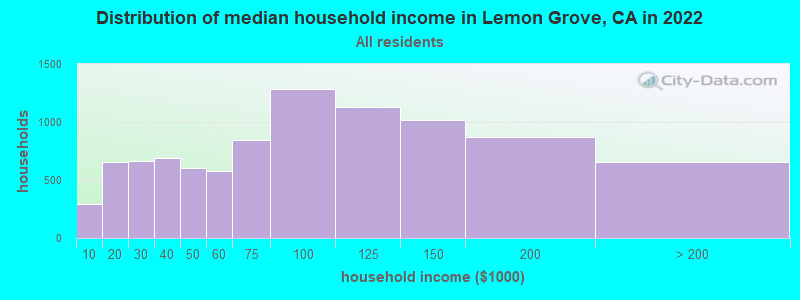
Lemon Grove, CA household income distribution

- 296Less than $10,000
- 657$10,000 to $19,999
- 667$20,000 to $29,999
- 687$30,000 to $39,999
- 606$40,000 to $49,999
- 576$50,000 to $59,999
- 845$60,000 to $74,999
- 1,282$75,000 to $99,999
- 1,129$100,000 to $124,999
- 1,014$125,000 to $149,999
- 868$150,000 to $199,999
- 657$200,000 or more
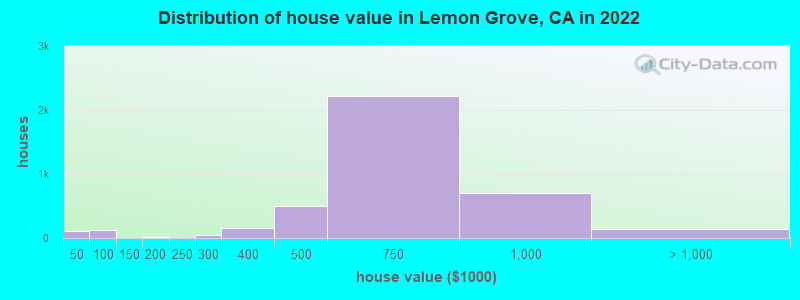
Home value of owner - occupied houses in 2022 in Lemon Grove, CA
-
- 67Less than $10,000
- 23$10,000 to $14,999
- 19$40,000 to $49,999
- 48$50,000 to $59,999
- 43$60,000 to $69,999
- 13$70,000 to $79,999
- 7$100,000 to $124,999
- 13$150,000 to $174,999
- 44$250,000 to $299,999
- 156$300,000 to $399,999
- 496$400,000 to $499,999
- 2,223$500,000 to $749,999
- 703$750,000 to $999,999
- 87$1,000,000 to $1,499,999
- 51$2,000,000 or more
Rent paid by renters in 2022 in Lemon Grove, CA
-
- 53$250 to $299
- 24$300 to $349
- 35$400 to $449
- 47$500 to $549
- 26$550 to $599
- 25$600 to $649
- 26$650 to $699
- 9$750 to $799
- 71$800 to $899
- 246$900 to $999
- 622$1,000 to $1,249
- 602$1,250 to $1,499
- 1,221$1,500 to $1,999
- 770$2,000 to $2,499
- 228$2,500 to $2,999
- 14$3,000 to $3,499
- 35$3,500 or more
- 94No cash rent


Percentage of workers working in this county: 98.7%
Number of people working at home: 1,962 (14.8% of all workers)
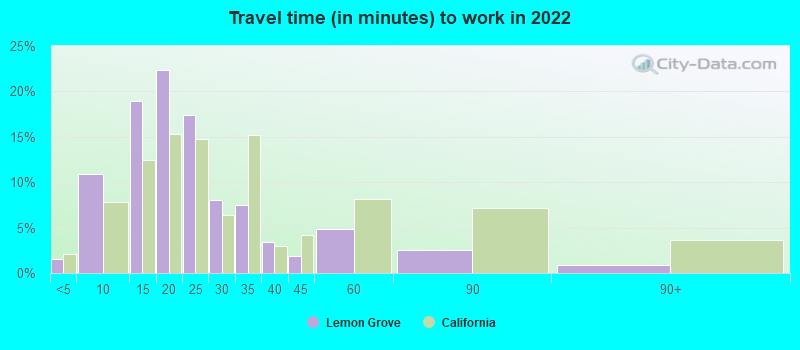
Travel time to work (commute)
- Less than 5 minutes: 87
- 5 to 9 minutes: 556
- 10 to 14 minutes: 1,086
- 15 to 19 minutes: 1,916
- 20 to 24 minutes: 2,087
- 25 to 29 minutes: 1,035
- 30 to 34 minutes: 2,040
- 35 to 39 minutes: 347
- 40 to 44 minutes: 444
- 45 to 59 minutes: 766
- 60 to 89 minutes: 366
- 90 or more minutes: 444
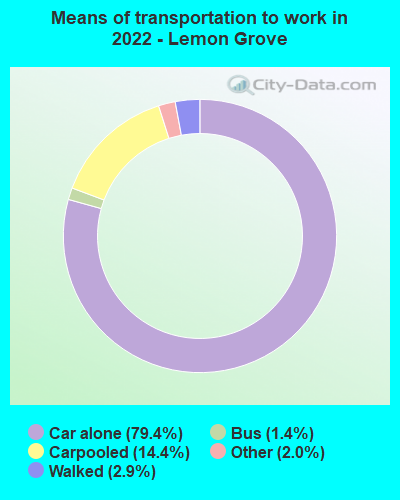
Means of transportation to work:
- Drove a car alone: 4,122 (58.6%)
- Carpooled: 780 (11.1%)
- Bus: 64 (0.9%)
- Taxi: 109 (1.5%)
- Walked: 165 (2.3%)
- Worked at home: 1,962 (27.9%)

- Unemployment by race in 2022
- Unemployment rate for White non-Hispanic residents
- 9.3%Males
- 7.1%Females
- Unemployment rate for Black residents
- 5.6%Males
- 4.1%Females
- Unemployment rate for American Indian and Alaska Native residents
- 4.4%Females
- Unemployment rate for Asian residents
- 2.7%Males
- 5.4%Females
- Unemployment rate for other race residents
- 4.7%Males
- 6.3%Females
- Unemployment rate for two or more race residents
- 8.2%Males
- 7.9%Females
- Unemployment rate for Hispanic or Latino residents
- 4.6%Males
- 5.8%Females

- Year of entry for the foreign-born population in Lemon Grove, California
- 1,0242010 or later
- 7482000 to 2009
- 9091990 to 1999
- 1,1521980 to 1989
- 7141970 to 1979
- 610Before 1970

First ancestries reported:
- Irish: 353 (2.3%)
- American: 341 (2.2%)
- German: 338 (2.2%)
- Italian: 316 (2.1%)
- African: 315 (2.1%)
- Ethiopian: 237 (1.5%)
- English: 216 (1.4%)
- Nigerian: 143 (0.9%)
- Somali: 140 (0.9%)
- Polish: 108 (0.7%)
- Norwegian: 93 (0.6%)
- Dutch: 78 (0.5%)
- European: 66 (0.4%)
- Jamaican: 59 (0.4%)
- Russian: 50 (0.3%)
- Portuguese: 38 (0.2%)
- Czech: 31 (0.2%)
- French: 28 (0.2%)
- Scandinavian: 25 (0.2%)
- Swedish: 25 (0.2%)
- Kenyan: 22 (0.1%)
- Scottish: 20 (0.1%)
- Celtic: 15 (0.10%)
- Pennsylvania German: 13 (0.08%)
- Brazilian: 12 (0.08%)
- Austrian: 11 (0.07%)
- Belgian: 10 (0.07%)
- Iranian: 10 (0.07%)
- French Canadian: 9 (0.06%)
- Northern European: 8 (0.05%)
- Bulgarian: 8 (0.05%)
- British: 7 (0.05%)
- Danish: 7 (0.05%)
- Barbadian: 7 (0.05%)
- Hungarian: 6 (0.04%)
- Finnish: 4 (0.03%)
- Australian: 3 (0.02%)
Most common places of birth for foreign-born residents (%):
| Lemon Grove: | 50.6% (2,328) |
| California: | 37.2% (3,881,193) |
| Lemon Grove: | 13.2% (608) |
| California: | 7.8% (818,297) |
| Lemon Grove: | 4.6% (212) |
| California: | 4.9% (512,335) |
| Lemon Grove: | 4.0% (185) |
| California: | 0.3% (35,557) |
| Lemon Grove: | 3.2% (145) |
| California: | 0.1% (6,853) |
| Lemon Grove: | 1.6% (72) |
| California: | 0.4% (40,941) |
Place of birth for U.S.-born residents:
- This state: 17,677
- Other state: 4,680
- Northeast: 931
- Midwest: 1,339
- South: 1,560
- West: 848
91.9% of Lemon Grove residents lived in the same house 1 years ago.
Out of people who lived in different houses, 44.1% lived in this county.
Out of people who lived in different counties, 38.2% lived in California.
| Lemon Grove: | 91.9% |
| State average: | 88.9% |
Education attainment for males 25 years and older:
- No schooling: 332
- Nursery to 4th grade: 40
- 5th and 6th grade: 149
- 7th and 8th grade: 52
- 9th grade: 31
- 10th grade: 30
- 11th grade: 173
- 12th grade, no diploma: 330
- High school graduate (or equivalency): 2,555
- Less than 1 year of college: 1,054
- Some college more than 1 year, no degree: 1,947
- Associate degree: 1,037
- Bachelor's degree: 1,071
- Master's degree: 533
- Professional school degree: 75
- Doctorate degree: 23

Education attainment for females 25 years and older:
- No schooling: 294
- Nursery to 4th grade: 102
- 5th and 6th grade: 94
- 7th and 8th grade: 81
- 9th grade: 47
- 10th grade: 119
- 11th grade: 80
- 12th grade, no diploma: 307
- High school graduate (or equivalency): 2,420
- Less than 1 year of college: 1,154
- Some college more than 1 year, no degree: 1,802
- Associate degree: 627
- Bachelor's degree: 1,388
- Master's degree: 659
- Professional school degree: 132
- Doctorate degree: 80


Housing units in structures:
- One, detached: 6,310
- One, attached: 777
- Two: 372
- 3 or 4: 342
- 5 to 9: 357
- 10 to 19: 317
- 20 to 49: 466
- 50 or more: 667
- Mobile homes: 13
- Boats, RVs, vans, etc.: 12
Housing units lacking complete kitchen facilities in 2022: 1.5%
House/condo owner moved in on average 18 years ago
Renter moved in on average 6 years ago

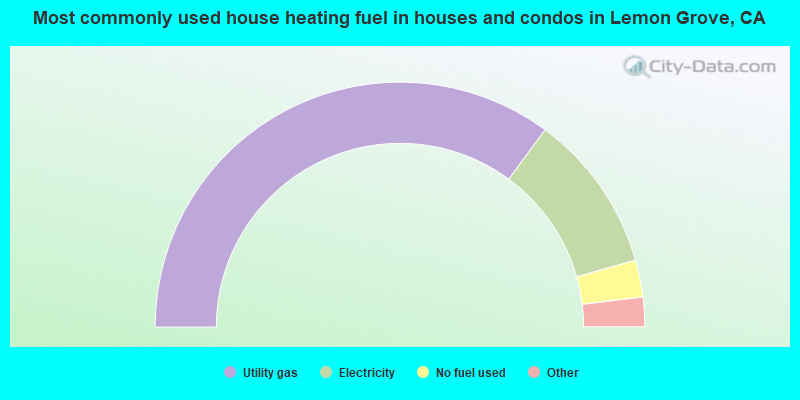
- 70.2%Utility gas
- 21.0%Electricity
- 4.9%No fuel used
- 1.8%Bottled, tank, or LP gas
- 1.4%Solar energy
- 0.6%Wood
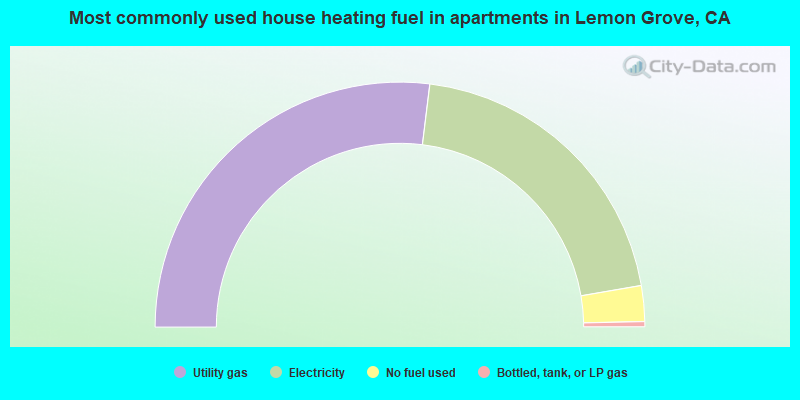
- 53.9%Utility gas
- 40.7%Electricity
- 4.7%No fuel used
- 0.7%Bottled, tank, or LP gas
Private vs. public school enrollment:
| Here: | 7.4% |
| California: | 10.5% |
| Here: | 2.0% |
| California: | 8.5% |
| Here: | 23.0% |
| California: | 15.9% |


