Manville, NJ (New Jersey) Houses and Residents
| Manville: | $306,040 |
| New Jersey: | $428,900 |
Mean price in 2022:
Detached houses: $323,728
Here: $323,728 State: $537,591 Townhouses or other attached units: $354,885
Here: $354,885 State: $381,113 In 2-unit structures: $283,109
Here: $283,109 State: $444,476
Total population: 10,388 (Urban population: 10,307, Rural population: 0)
Houses: 4,663 (4,438 occupied: 3,395 owner occupied, 1,085 renter occupied)
| % of renters here: | 24% |
| State: | 35% |
Housing density: 1,879 houses/condos per square mile
Median price asked for vacant for-sale houses and condos in 2022: $101,611.
Median contract rent in 2022: $1,423 (lower quartile is $1,220, upper quartile is $1,857)
Median rent asked for vacant for-rent units in 2022: $1,687
Median gross rent in Manville, NJ in 2022: $1,692
Housing units in Manville with a mortgage: 1,993 (211 second mortgage, 0 home equity loan, 176 both second mortgage and home equity loan)
Houses without a mortgage: 85
Median household income for houses/condos with a mortgage: $118,841
Median household income for apartments without a mortgage: $64,313
Median monthly housing costs: $1,577
Compare current foreclosures in Manville, NJ:
| Photo | Address | Area | Beds / Baths | Price | Details |
|---|---|---|---|---|---|

|
#1
Huff Ave
Manville, NJ 08835
|
1,430 sq. feet
|
- baths - beds |
show details | |

|
#2
Rabens Ave
Manville, NJ 08835
|
1,050 sq. feet
|
- baths - beds |
show details | |

|
#3
Huff Ave
Manville, NJ 08835
|
1,887 sq. feet
|
- baths - beds |
show details | |

|
#4
E Camplain Rd
Manville, NJ 08835
|
1,370 sq. feet
|
- baths - beds |
show details | |

|
#5
S 8th Ave
Manville, NJ 08835
|
1,040 sq. feet
|
- baths - beds |
show details | |

|
#6
N 6th Ave
Manville, NJ 08835
|
2,576 sq. feet
|
- baths - beds |
show details | |

|
#7
Dukes Pkwy
Manville, NJ 08835
|
1,092 sq. feet
|
- baths - beds |
show details | |

|
#8
Wyoming Pl
Manville, NJ 08835
|
- sq. feet
|
- baths - beds |
show details | |

|
#9
Brooks Blvd
Manville, NJ 08835
|
3,354 sq. feet
|
- baths - beds |
show details | |

|
#10
Huff Ave
Manville, NJ 08835
|
1,152 sq. feet
|
- baths - beds |
show details |
| Photo | Address | Area | Beds / Baths | Price | Details |
|---|---|---|---|---|---|

|
#11
Jackson Ave
Manville, NJ 08835
|
936 sq. feet
|
- baths - beds |
show details | |

|
#12
S 13th Ave
Manville, NJ 08835
|
2,970 sq. feet
|
- baths - beds |
show details | |

|
#13
Huff Ave
Manville, NJ 08835
|
1,170 sq. feet
|
- baths - beds |
show details | |

|
#14
& 416 West Camplain Road
Manville, NJ Array
|
- sq. feet
|
- baths - beds |
show details | |

|
#15
W Camplain Rd
Manville, NJ 08835
|
- sq. feet
|
- baths - beds |
show details | |

|
#16
W Camplain Rd
Manville, NJ 08835
|
- sq. feet
|
- baths - beds |
show details | |

|
#17
N Weiss St
Manville, NJ 08835
|
- sq. feet
|
- baths - beds |
show details | |

|
#18
N 4th Ave
Manville, NJ 08835
|
1,181 sq. feet
|
- baths - beds |
show details | |

|
#19
S Main St
Manville, NJ 08835
|
- sq. feet
|
- baths - beds |
show details | |

|
#20
Clinton Ave
Manville, NJ 08835
|
- sq. feet
|
- baths - beds |
show details |
| Photo | Address | Area | Beds / Baths | Price | Details |
|---|---|---|---|---|---|

|
#21
N 1st Ave
Manville, NJ 08835
|
- sq. feet
|
- baths - beds |
show details | |

|
#22
Beekman St
Manville, NJ 08835
|
- sq. feet
|
- baths - beds |
show details | |

|
#23
Saint John St
Manville, NJ 08835
|
- sq. feet
|
- baths - beds |
show details | |

|
#24
S 13th Ave
Manville, NJ 08835
|
- sq. feet
|
- baths - beds |
show details | |

|
#25
White Ave
Manville, NJ 08835
|
- sq. feet
|
- baths - beds |
show details | |

|
#26
Lincoln Ave
Manville, NJ 08835
|
- sq. feet
|
- baths - beds |
show details | |

|
#27
S 18th Ave
Manville, NJ 08835
|
- sq. feet
|
- baths - beds |
show details | |

|
#28
Brooks Blvd
Manville, NJ 08835
|
- sq. feet
|
- baths - beds |
show details | |

|
#29
N 8th Ave
Manville, NJ 08835
|
- sq. feet
|
- baths - beds |
show details | |

|
#30
Boesel Ave
Manville, NJ 08835
|
- sq. feet
|
- baths - beds |
show details |
| Photo | Address | Area | Beds / Baths | Price | Details |
|---|---|---|---|---|---|

|
#31
Valerie Dr
Manville, NJ 08835
|
- sq. feet
|
- baths - beds |
show details | |

|
#32
E Camplain Rd
Manville, NJ 08835
|
- sq. feet
|
- baths - beds |
show details | |

|
#33
Louis St
Manville, NJ 08835
|
- sq. feet
|
- baths - beds |
show details | |

|
#34
S 3rd Ave
Manville, NJ 08835
|
- sq. feet
|
- baths - beds |
show details | |

|
#35
N 10th Ave
Manville, NJ 08835
|
- sq. feet
|
- baths - beds |
show details | |

|
#36
S 5th Ave
Manville, NJ 08835
|
- sq. feet
|
- baths - beds |
show details | |

|
Check over 1 million property listings on Foreclosure.com!
|
browse all offers | |||

Latest news about housing in Manville, NJ collected exclusively by city-data.com from local newspapers, TV, and radio stations

 | Decided not to purchase home for the 5th time. Thinking about leaving NJ for good. (95 replies) |
| Bridgewater Commons (26 replies) |
| First time home buyer..300k..Good Schools.. (42 replies) |
| Which areas are best for Multi-Family Houses? (1 reply) |
| Train noise in Manville (1 reply) |
| First Time Homebuyer! Manville? Need Advice! (4 replies) |

Median year apartment built: 1961
Household type by relationship:
Households: 10,951- Male householders: 2,043 (518 living alone), Female householders: 2,371 (774 living alone)
2,065 spouses (2,058 opposite-sex spouses), 435 unmarried partners, (429 opposite-sex unmarried partners), 3,142 children (3,032 natural, 21 adopted, 88 stepchildren), 169 grandchildren, 181 brothers or sisters, 191 parents, 0 foster children, 99 other relatives, 243 non-relatives
- In group quarters: 8
Size of family households: 1,323 2-persons, 701 3-persons, 517 4-persons, 265 5-persons, 70 6-persons, 58 7-or-more-persons.
Size of nonfamily households: 1,276 1-person, 239 2-persons, 15 3-persons.
1,131 married couples with children.
623 single-parent households (149 men, 474 women).
75.8% of residents of Manville speak English at home.
12.4% of residents speak Spanish at home (60% speak English very well, 35% speak English well, 3% speak English not well, 2% don't speak English at all).
8.0% of residents speak other Indo-European language at home (73% speak English very well, 23% speak English well, 4% speak English not well).
1.5% of residents speak Asian or Pacific Island language at home (27% speak English very well, 46% speak English well, 20% speak English not well, 7% don't speak English at all).
2.3% of residents speak other language at home (89% speak English very well, 11% speak English well).
Foreign born population: 1,930 (17.6%)
(69.9% of them are naturalized citizens)
| Here: | 6.1 |
| State: | 6.8 |
| Here: | 4.1 |
| State: | 3.9 |

- Bedrooms in owner-occupied houses and condos in Manville, New Jersey
- 12no bedroom
- 431 bedroom
- 5782 bedrooms
- 1,8033 bedrooms
- 7774 bedrooms
- 1835+ bedrooms

- Bedrooms in renter-occupied apartments in Manville, New Jersey
- 95no bedroom
- 2851 bedroom
- 4452 bedrooms
- 2233 bedrooms
- 384 bedrooms
- 05+ bedrooms

- Cars and other vehicles available in Manville in owner-occupied houses/condos
- 208no vehicle
- 1,1761 vehicle
- 1,0602 vehicles
- 6533 vehicles
- 2564 vehicles
- 425+ vehicles

- Cars and other vehicles available in Manville in renter-occupied apartments
- 272no vehicle
- 5001 vehicle
- 2082 vehicles
- 813 vehicles
- 104 vehicles
- 145+ vehicles

- Rooms in owner-occupied houses in Manville, New Jersey
- 121 room
- 02 rooms
- 143 rooms
- 3024 rooms
- 8555 rooms
- 7666 rooms
- 7247 rooms
- 4288 rooms
- 2949+ rooms

- Rooms in renter-occupied apartments in Manville, New Jersey
- 951 room
- 512 rooms
- 1953 rooms
- 2764 rooms
- 3705 rooms
- 816 rooms
- 07 rooms
- 98 rooms
- 99+ rooms


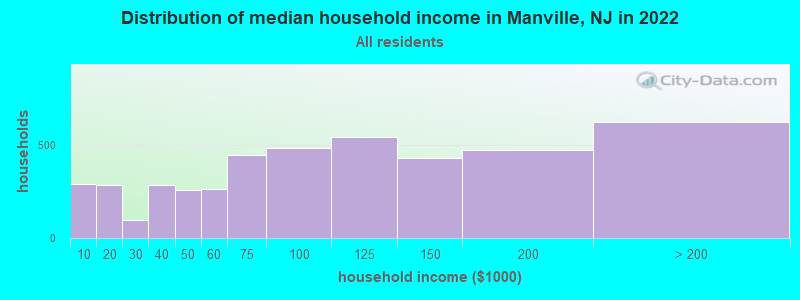
Manville, NJ household income distribution

- 289Less than $10,000
- 286$10,000 to $19,999
- 99$20,000 to $29,999
- 283$30,000 to $39,999
- 258$40,000 to $49,999
- 264$50,000 to $59,999
- 447$60,000 to $74,999
- 484$75,000 to $99,999
- 543$100,000 to $124,999
- 428$125,000 to $149,999
- 472$150,000 to $199,999
- 624$200,000 or more
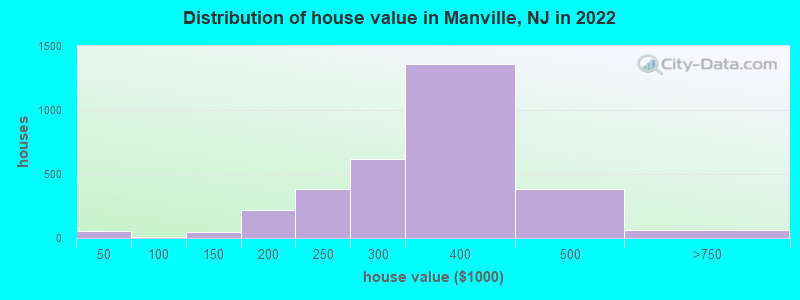
Home value of owner - occupied houses in 2022 in Manville, NJ
-
- 50Less than $10,000
- 5$40,000 to $49,999
- 24$100,000 to $124,999
- 23$125,000 to $149,999
- 8$150,000 to $174,999
- 212$175,000 to $199,999
- 383$200,000 to $249,999
- 620$250,000 to $299,999
- 1,360$300,000 to $399,999
- 380$400,000 to $499,999
- 48$500,000 to $749,999
- 16$750,000 to $999,999
Rent paid by renters in 2022 in Manville, NJ
-
- 21$150 to $199
- 43$600 to $649
- 19$700 to $749
- 28$900 to $999
- 178$1,000 to $1,249
- 300$1,250 to $1,499
- 283$1,500 to $1,999
- 142$2,000 to $2,499
- 30No cash rent


Percentage of workers working in this county: 74.9%
Number of people working at home: 806 (13.4% of all workers)
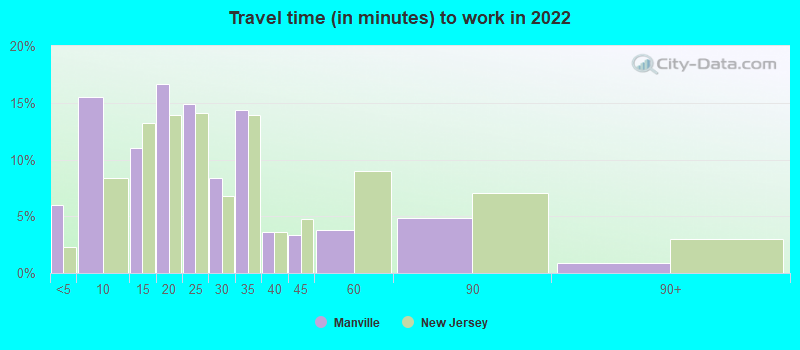
Travel time to work (commute)
- Less than 5 minutes: 161
- 5 to 9 minutes: 483
- 10 to 14 minutes: 928
- 15 to 19 minutes: 700
- 20 to 24 minutes: 879
- 25 to 29 minutes: 583
- 30 to 34 minutes: 432
- 35 to 39 minutes: 197
- 40 to 44 minutes: 206
- 45 to 59 minutes: 426
- 60 to 89 minutes: 104
- 90 or more minutes: 45
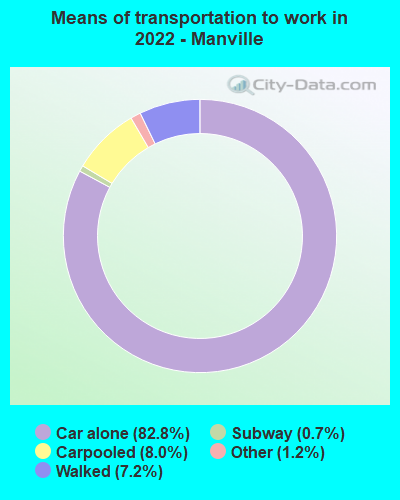
Means of transportation to work:
- Drove a car alone: 2,072 (62.0%)
- Carpooled: 249 (7.4%)
- Long-distance train or commuter rail: 16 (0.5%)
- Taxi: 35 (1.0%)
- Walked: 267 (8.0%)
- Worked at home: 806 (24.1%)

- Unemployment by race in 2022
- Unemployment rate for White non-Hispanic residents
- 3.5%Males
- 1.8%Females
- Unemployment rate for Black residents
- 4.2%Males
- Unemployment rate for other race residents
- 6.9%Males
- Unemployment rate for two or more race residents
- 3.8%Males
- Unemployment rate for Hispanic or Latino residents
- 11.1%Males

- Year of entry for the foreign-born population in Manville, New Jersey
- 5142010 or later
- 5312000 to 2009
- 5261990 to 1999
- 2861980 to 1989
- 1611970 to 1979
- 318Before 1970

First ancestries reported:
- American: 850 (15.8%)
- Polish: 791 (14.7%)
- Italian: 368 (6.9%)
- Irish: 224 (4.2%)
- European: 82 (1.5%)
- Hungarian: 75 (1.4%)
- Slovak: 63 (1.2%)
- Ukrainian: 63 (1.2%)
- German: 52 (1.0%)
- Eastern European: 43 (0.8%)
- English: 41 (0.8%)
- Haitian: 38 (0.7%)
- Portuguese: 31 (0.6%)
- Lithuanian: 30 (0.6%)
- Russian: 24 (0.4%)
- French: 19 (0.4%)
- African: 18 (0.3%)
- Slavic: 13 (0.2%)
- Carpatho Rusyn: 12 (0.2%)
- Czechoslovakian: 10 (0.2%)
- Finnish: 9 (0.2%)
- Lebanese: 7 (0.1%)
Most common places of birth for foreign-born residents (%):
| Manville: | 11.6% (229) |
| New Jersey: | 2.3% (48,811) |
| Manville: | 8.5% (168) |
| New Jersey: | 0.7% (14,848) |
| Manville: | 7.2% (142) |
| New Jersey: | 4.4% (95,275) |
| Manville: | 6.2% (122) |
| New Jersey: | 2.3% (48,885) |
| Manville: | 5.9% (116) |
| New Jersey: | 4.2% (90,817) |
| Manville: | 5.7% (113) |
| New Jersey: | 1.1% (22,760) |
| Manville: | 4.7% (93) |
| New Jersey: | 0.1% (2,747) |
| Manville: | 4.5% (89) |
| New Jersey: | 1.7% (37,335) |
| Manville: | 4.4% (86) |
| New Jersey: | 0.8% (17,217) |
| Manville: | 4.0% (79) |
| New Jersey: | 4.8% (102,527) |
| Manville: | 3.2% (62) |
| New Jersey: | 0.9% (20,371) |
| Manville: | 3.1% (60) |
| New Jersey: | 12.8% (274,609) |
| Manville: | 2.7% (54) |
| New Jersey: | 3.7% (78,969) |
| Manville: | 2.7% (54) |
| New Jersey: | 0.7% (15,644) |
| Manville: | 2.6% (52) |
| New Jersey: | 2.2% (46,813) |
| Manville: | 2.6% (51) |
| New Jersey: | 4.0% (85,934) |
| Manville: | 2.5% (50) |
| New Jersey: | 9.7% (209,055) |
| Manville: | 1.8% (35) |
| New Jersey: | 2.7% (58,563) |
| Manville: | 1.7% (33) |
| New Jersey: | 0.0% (584) |
Place of birth for U.S.-born residents:
- This state: 7,229
- Other state: 1,593
- Northeast: 1,308
- Midwest: 73
- South: 162
- West: 66
93.8% of Manville residents lived in the same house 1 years ago.
Out of people who lived in different houses, 40.0% lived in this county.
Out of people who lived in different counties, 100.0% lived in New Jersey.
| Manville: | 93.8% |
| State average: | 90.4% |
Education attainment for males 25 years and older:
- No schooling: 21
- Nursery to 4th grade: 0
- 5th and 6th grade: 27
- 7th and 8th grade: 0
- 9th grade: 123
- 10th grade: 8
- 11th grade: 51
- 12th grade, no diploma: 127
- High school graduate (or equivalency): 1,490
- Less than 1 year of college: 385
- Some college more than 1 year, no degree: 238
- Associate degree: 173
- Bachelor's degree: 875
- Master's degree: 312
- Professional school degree: 16
- Doctorate degree: 15

Education attainment for females 25 years and older:
- No schooling: 0
- Nursery to 4th grade: 0
- 5th and 6th grade: 0
- 7th and 8th grade: 60
- 9th grade: 0
- 10th grade: 13
- 11th grade: 25
- 12th grade, no diploma: 81
- High school graduate (or equivalency): 1,370
- Less than 1 year of college: 422
- Some college more than 1 year, no degree: 316
- Associate degree: 436
- Bachelor's degree: 686
- Master's degree: 327
- Professional school degree: 74
- Doctorate degree: 13


Housing units in structures:
- One, detached: 3,309
- One, attached: 200
- Two: 764
- 3 or 4: 104
- 5 to 9: 120
- 10 to 19: 164
Housing units lacking complete kitchen facilities in 2022: 2.4%
House/condo owner moved in on average 19 years ago
Renter moved in on average 6 years ago

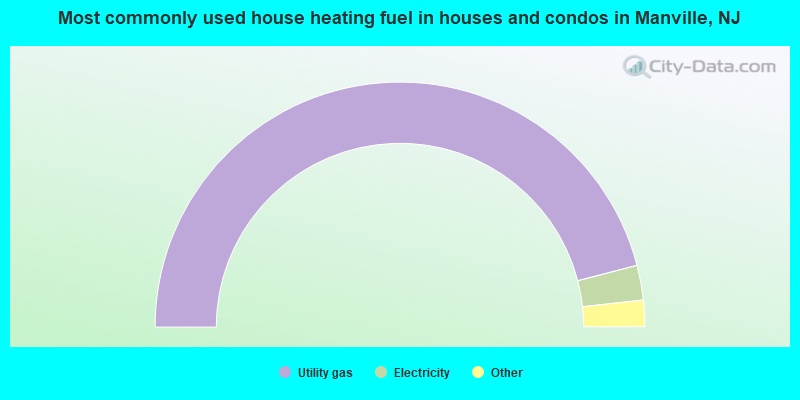
- 91.9%Utility gas
- 4.6%Electricity
- 2.1%No fuel used
- 0.5%Fuel oil, kerosene, etc.
- 0.3%Solar energy
- 0.3%Other fuel
- 0.2%Bottled, tank, or LP gas
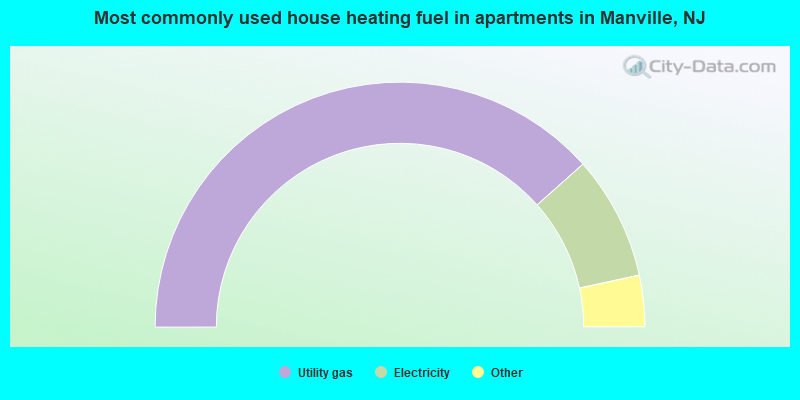
- 77.0%Utility gas
- 16.4%Electricity
- 3.6%Fuel oil, kerosene, etc.
- 1.8%Bottled, tank, or LP gas
- 1.3%No fuel used
Private vs. public school enrollment:
| Here: | 2.8% |
| New Jersey: | 12.3% |
| Here: | 2.5% |
| New Jersey: | 13.1% |
| Here: | 31.9% |
| New Jersey: | 33.2% |


