Mira Loma, CA (California) Houses and Residents
| Mira Loma: | $642,207 |
| California: | $715,900 |
Mean price in 2022:
Detached houses: $498,275
Here: $498,275 State: $988,808 Townhouses or other attached units: $513,191
Here: $513,191 State: $838,546 Mobile homes: $235,724
Here: $235,724 State: $184,506
Total population: 21,930 (Urban population: 17,833, Rural population: 0)
Houses: 5,902 (5,591 occupied: 4,412 owner occupied, 1,297 renter occupied)
| % of renters here: | 23% |
| State: | 44% |
Housing density: 916 houses/condos per square mile
Median price asked for vacant for-sale houses and condos in 2011_5yr: $251,563.
Median contract rent in 2022: $1,698 (lower quartile is $1,226, upper quartile is over $2,000)
Median rent asked for vacant for-rent units in 2022: $2,627
Median gross rent in Mira Loma, CA in 2022: $1,899
Housing units in Mira Loma with a mortgage: 3,308 (76 second mortgage, 265 home equity loan, 6 both second mortgage and home equity loan)
Houses without a mortgage: 619
Median household income for houses/condos with a mortgage: $112,341
Median household income for apartments without a mortgage: $79,181
Median monthly housing costs: $2,118


 | Suggestions for getting our first house (89 replies) |
| Lots Of People Leaving California? (338 replies) |
| Home prices in Carmichael, Fair Oaks and Folsom (33 replies) |
| The ideal Sacramento suburb (105 replies) |
| why are the home lots so big in the Mira Loma area? (3 replies) |
| Good schools, Best location to rent (7 replies) |

Median year apartment built: 1968
Household type by relationship:
Households: 23,484- In family households: 22,292 (2,630 male householders, 2,189 female householders)
3,853 spouses, 8,900 children (8,252 natural, 264 adopted, 383 stepchildren), 1,209 grandchildren, 671 brothers or sisters, 742 parents, 19 foster children, 1,500 other relatives, 595 non-relatives
- In nonfamily households: 1,100 (365 male householders (286 living alone)), 457 female householders (357 living alone)), 277 nonrelatives
- In group quarters: 91
Size of family households: 1,100 2-persons, 902 3-persons, 773 4-persons, 1,016 5-persons, 355 6-persons, 558 7-or-more-persons.
Size of nonfamily households: 636 1-person, 133 2-persons, 63 3-persons.
3,538 married couples with children.
1,272 single-parent households (353 men, 919 women).
41.8% of residents of Mira Loma speak English at home.
54.5% of residents speak Spanish at home (64% speak English very well, 20% speak English well, 12% speak English not well, 4% don't speak English at all).
1.5% of residents speak other Indo-European language at home (64% speak English very well, 36% speak English not well).
1.0% of residents speak Asian or Pacific Island language at home (53% speak English very well, 16% speak English well, 31% speak English not well).
Foreign born population: 6,350 (28.0%)
(41.3% of them are naturalized citizens)
| Here: | 6.4 |
| State: | 6.0 |
| Here: | 4.8 |
| State: | 3.9 |

- Bedrooms in owner-occupied houses and condos in Mira Loma, California
- 80no bedroom
- 361 bedroom
- 5102 bedrooms
- 1,5943 bedrooms
- 1,8184 bedrooms
- 3755+ bedrooms

- Bedrooms in renter-occupied apartments in Mira Loma, California
- 80no bedroom
- 1331 bedroom
- 4792 bedrooms
- 4553 bedrooms
- 1044 bedrooms
- 475+ bedrooms

- Cars and other vehicles available in Mira Loma in owner-occupied houses/condos
- 57no vehicle
- 6151 vehicle
- 1,6132 vehicles
- 1,0943 vehicles
- 6714 vehicles
- 3635+ vehicles

- Cars and other vehicles available in Mira Loma in renter-occupied apartments
- 22no vehicle
- 4591 vehicle
- 6102 vehicles
- 1843 vehicles
- 04 vehicles
- 235+ vehicles

- Rooms in owner-occupied houses in Mira Loma, California
- 801 room
- 92 rooms
- 03 rooms
- 3234 rooms
- 7065 rooms
- 1,3826 rooms
- 1,0997 rooms
- 5558 rooms
- 2599+ rooms

- Rooms in renter-occupied apartments in Mira Loma, California
- 731 room
- 252 rooms
- 2113 rooms
- 2364 rooms
- 4125 rooms
- 1786 rooms
- 387 rooms
- 1018 rooms
- 239+ rooms


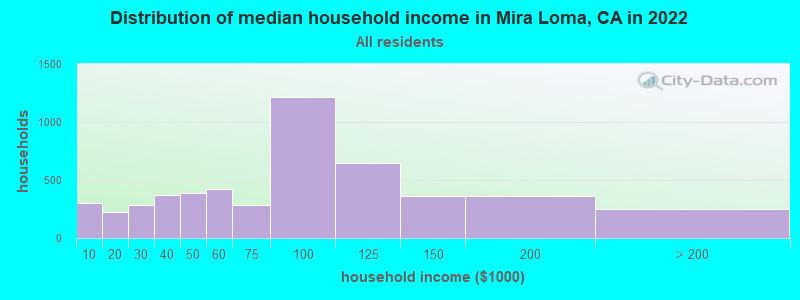
Mira Loma, CA household income distribution

- 306Less than $10,000
- 221$10,000 to $19,999
- 284$20,000 to $29,999
- 371$30,000 to $39,999
- 387$40,000 to $49,999
- 425$50,000 to $59,999
- 286$60,000 to $74,999
- 1,212$75,000 to $99,999
- 646$100,000 to $124,999
- 362$125,000 to $149,999
- 362$150,000 to $199,999
- 251$200,000 or more
Rent paid by renters in 2011_5yr in Mira Loma, CA
-
- 12$300 to $349
- 25$400 to $449
- 22$500 to $549
- 63$600 to $649
- 83$650 to $699
- 36$700 to $749
- 81$750 to $799
- 89$800 to $899
- 96$900 to $999
- 488$1,000 to $1,249
- 223$1,250 to $1,499
- 89$1,500 to $1,999
- 165$2,000 or more
- 63No cash rent

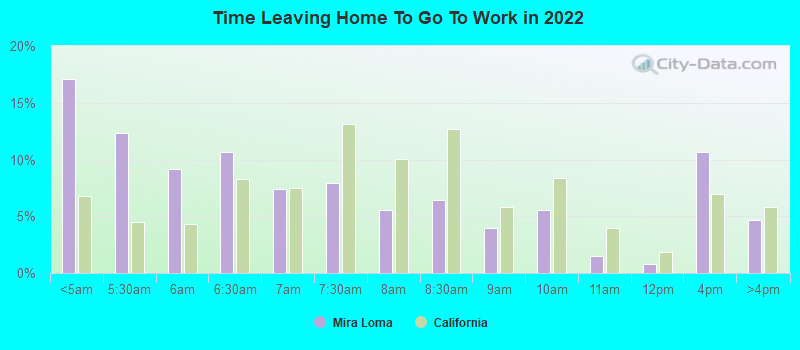
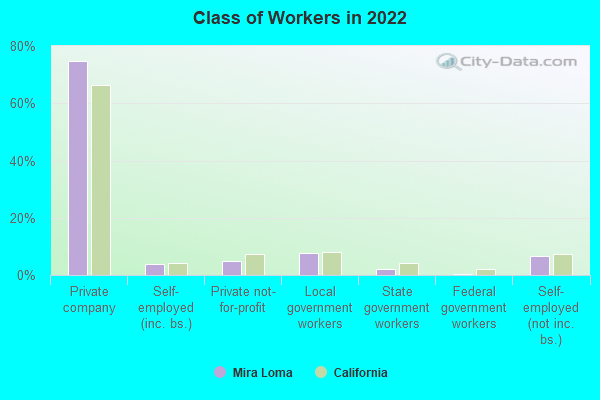
Percentage of workers working in this county: 46.9%
Number of people working at home: 1,227 (13.2% of all workers)
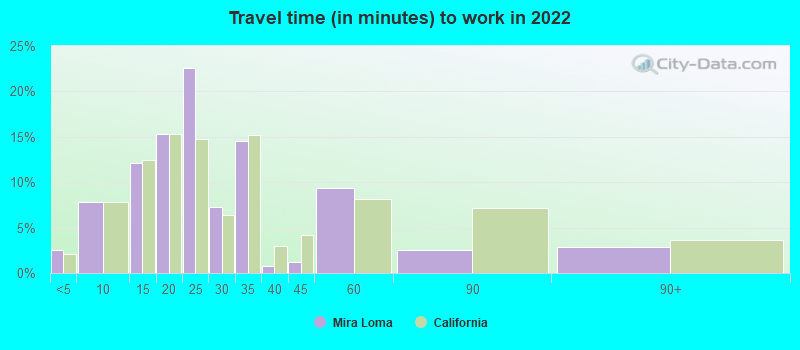
Travel time to work (commute)
- Less than 5 minutes: 112
- 5 to 9 minutes: 664
- 10 to 14 minutes: 905
- 15 to 19 minutes: 988
- 20 to 24 minutes: 1,176
- 25 to 29 minutes: 346
- 30 to 34 minutes: 1,515
- 35 to 39 minutes: 198
- 40 to 44 minutes: 186
- 45 to 59 minutes: 805
- 60 to 89 minutes: 874
- 90 or more minutes: 695
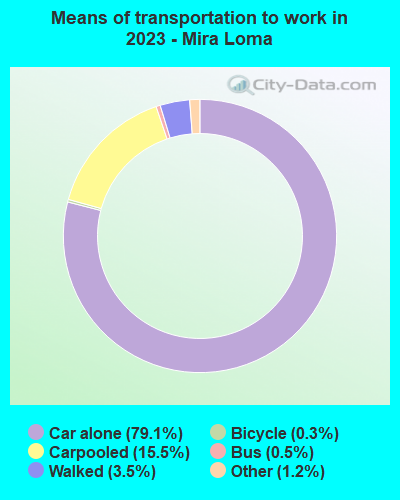
Means of transportation to work:
- Drove a car alone: 3,315 (69.1%)
- Carpooled: 493 (10.3%)
- Bus or trolley bus: 9 (0.2%)
- Taxi: 59 (1.2%)
- Bicycle: 9 (0.2%)
- Walked: 98 (2.0%)
- Worked at home: 1,227 (25.6%)
- Unemployment by race in 2022
- Unemployment rate for White non-Hispanic residents
- 11.9%Males
- 17.7%Females
- Unemployment rate for Black residents
- 15.2%Males
- Unemployment rate for Asian residents
- 9.3%Males
- 18.9%Females
- Unemployment rate for other race residents
- 8.7%Males
- 20.9%Females
- Unemployment rate for two or more race residents
- 10.3%Males
- 18.7%Females
- Unemployment rate for Hispanic or Latino residents
- 9.3%Males
- 11.9%Females

- Year of entry for the foreign-born population in Mira Loma, California
- 1212010 or later
- 02000 to 2009
- 251990 to 1999
- 1,0791980 to 1989
- 1,0931970 to 1979
- 655Before 1970

First ancestries reported:
- German: 429 (2.9%)
- American: 291 (2.0%)
- Irish: 168 (1.2%)
- English: 166 (1.1%)
- Italian: 121 (0.8%)
- Portuguese: 106 (0.7%)
- Scandinavian: 83 (0.6%)
- European: 82 (0.6%)
- Dutch: 68 (0.5%)
- Iranian: 47 (0.3%)
- Swedish: 47 (0.3%)
- Guyanese: 43 (0.3%)
- British: 38 (0.3%)
- Russian: 38 (0.3%)
- Polish: 33 (0.2%)
- Norwegian: 32 (0.2%)
- French: 23 (0.2%)
- Swiss: 23 (0.2%)
- Danish: 22 (0.2%)
- Canadian: 15 (0.1%)
- Scottish: 12 (0.08%)
- Czech: 6 (0.04%)
- Greek: 6 (0.04%)
- Scotch-Irish: 5 (0.03%)
- Austrian: 3 (0.02%)
Most common places of birth for foreign-born residents (%):
| Mira Loma: | 83.2% (4,783) |
| California: | 100.0% (-1) |
| Mira Loma: | 3.4% (194) |
| California: | 100.0% (-1) |
| Mira Loma: | 1.6% (94) |
| California: | 100.0% (-1) |
Place of birth for U.S.-born residents:
- This state: 14,202
- Other state: 2,189
- Northeast: 408
- Midwest: 634
- South: 750
- West: 396
88.5% of Mira Loma residents lived in the same house 1 years ago.
Out of people who lived in different houses, 38.5% lived in this county.
Out of people who lived in different counties, 77.5% lived in California.
| Mira Loma: | 88.5% |
| State average: | 88.9% |
Education attainment for males 25 years and older:
- No schooling: 613
- Nursery to 4th grade: 190
- 5th and 6th grade: 450
- 7th and 8th grade: 125
- 9th grade: 137
- 10th grade: 129
- 11th grade: 175
- 12th grade, no diploma: 340
- High school graduate (or equivalency): 2,634
- Less than 1 year of college: 409
- Some college more than 1 year, no degree: 810
- Associate degree: 258
- Bachelor's degree: 590
- Master's degree: 72
- Professional school degree: 49
- Doctorate degree: 0

Education attainment for females 25 years and older:
- No schooling: 537
- Nursery to 4th grade: 170
- 5th and 6th grade: 231
- 7th and 8th grade: 116
- 9th grade: 355
- 10th grade: 164
- 11th grade: 128
- 12th grade, no diploma: 139
- High school graduate (or equivalency): 1,972
- Less than 1 year of college: 513
- Some college more than 1 year, no degree: 868
- Associate degree: 432
- Bachelor's degree: 596
- Master's degree: 198
- Professional school degree: 21
- Doctorate degree: 27


Housing units in structures:
- One, detached: 5,841
- One, attached: 130
- 3 or 4: 51
- 20 to 49: 6
- 50 or more: 13
- Mobile homes: 122
Median worth of mobile homes: $248,417
Housing units lacking complete kitchen facilities in 2022: 6.0%
House/condo owner moved in on average 18 years ago
Renter moved in on average 6 years ago

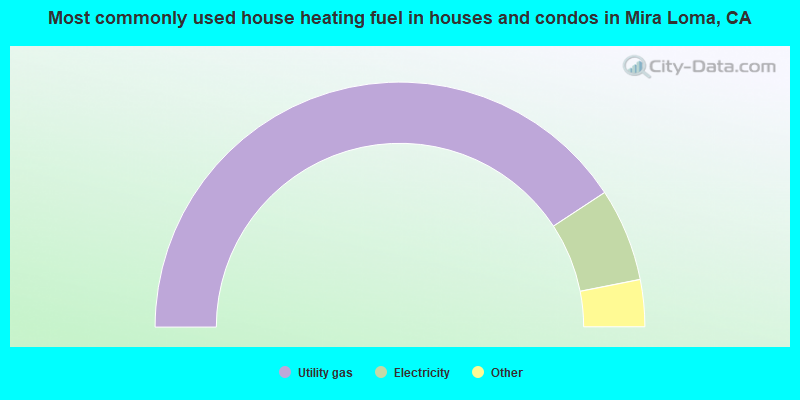
- 81.5%Utility gas
- 12.3%Electricity
- 2.8%No fuel used
- 2.0%Wood
- 1.4%Bottled, tank, or LP gas
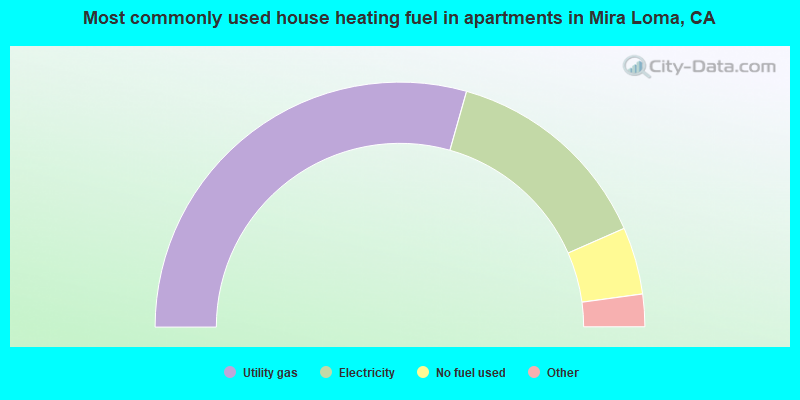
- 58.9%Utility gas
- 28.1%Electricity
- 8.9%No fuel used
- 1.8%Wood
- 1.2%Bottled, tank, or LP gas
- 1.1%Other fuel
Private vs. public school enrollment:
| Here: | 1.7% |
| California: | 10.5% |
| Here: | 3.5% |
| California: | 8.5% |
| Here: | 8.1% |
| California: | 15.9% |


