Oakdale, NY (New York) Houses and Residents
| Oakdale: | $620,306 |
| New York: | $400,400 |
Mean price in 2022:
Detached houses: $647,536
Here: $647,536 State: $476,719 Townhouses or other attached units: $406,877
Here: $406,877 State: $699,270 In 3-to-4-unit structures: $167,146
Here: $167,146 State: $764,568 In 5-or-more-unit structures: $238,012
Here: $238,012 State: $912,009
Total population: 7,974 (All urban)
Houses: 3,009 (2,817 occupied: 2,255 owner occupied, 560 renter occupied)
| % of renters here: | 20% |
| State: | 46% |
Housing density: 906 houses/condos per square mile
Median price asked for vacant for-sale houses and condos in 2022: $427,327.
Median contract rent in 2022: $1,960
Median rent asked for vacant for-rent units in 2022: $3,355
Median gross rent in Oakdale, NY in 2022: over $2,000
Housing units in Oakdale with a mortgage: 1,200 (167 second mortgage, 0 home equity loan, 145 both second mortgage and home equity loan)
Houses without a mortgage: 58
Median household income for houses/condos with a mortgage: $197,749
Median household income for apartments without a mortgage: $87,545
Median monthly housing costs: $2,087
Compare current foreclosures near Oakdale, NY:
| Photo | Address | Area | Beds / Baths | Price | Details |
|---|---|---|---|---|---|

|
#1
Jack Street
Oakdale, NY 11769
|
- sq. feet
|
- baths - beds |
show details | |

|
#2
Ockers Dr
Oakdale, NY 11769
|
- sq. feet
|
- baths - beds |
show details | |

|
#3
Meredith Ln
Oakdale, NY 11769
|
- sq. feet
|
- baths - beds |
show details | |

|
#4
Wilshire Ln
Oakdale, NY 11769
|
- sq. feet
|
- baths - beds |
show details | |

|
#5
Timber Ridge Dr
Commack, NY 11725
|
2,564 sq. feet
|
2 baths 4 beds |
$884,000
|
show details |

|
#6
Lorring St
Patchogue, NY 11772
|
1,230 sq. feet
|
2 baths 3 beds |
$342,400
|
show details |

|
#7
Harrison Ave Apt 83i
Amityville, NY 11701
|
900 sq. feet
|
1 baths 1 beds |
$272,000
|
show details |

|
#8
Bayview Ave
Patchogue, NY 11772
|
1,488 sq. feet
|
1 baths 4 beds |
$585,000
|
show details |

|
#9
Laurel Ln
Shirley, NY 11967
|
1,032 sq. feet
|
1 baths 3 beds |
$469,900
|
show details |

|
#10
Silverleaf Ln
Islandia, NY 11749
|
1,932 sq. feet
|
3 baths 3 beds |
$655,000
|
show details |
| Photo | Address | Area | Beds / Baths | Price | Details |
|---|---|---|---|---|---|

|
#11
Jillit Dr
Smithtown, NY 11787
|
1,480 sq. feet
|
1 baths 3 beds |
$760,000
|
show details |

|
#12
Ford Dr N
Massapequa, NY 11758
|
2,000 sq. feet
|
2 baths 5 beds |
$789,900
|
show details |

|
#13
6th Ave Apt A
Huntington Station, NY 11746
|
3,300 sq. feet
|
4 baths 7 beds |
$999,900
|
show details |

|
#14
Van Bomel Blvd
Oakdale, NY 11769
|
- sq. feet
|
- baths - beds |
show details | |

|
#15
Connetquot Rd
Oakdale, NY 11769
|
- sq. feet
|
- baths - beds |
show details | |

|
#16
Woodlawn Ave
Oakdale, NY 11769
|
- sq. feet
|
- baths - beds |
show details | |

|
#17
Woody Ln
Oakdale, NY 11769
|
- sq. feet
|
- baths - beds |
show details | |

|
#18
Wichard Dr
Oakdale, NY 11769
|
- sq. feet
|
- baths - beds |
show details | |

|
#19
Locust Ave
Oakdale, NY 11769
|
- sq. feet
|
- baths - beds |
show details | |

|
#20
Lincoln Dr
Oakdale, NY 11769
|
- sq. feet
|
- baths - beds |
show details |
| Photo | Address | Area | Beds / Baths | Price | Details |
|---|---|---|---|---|---|

|
#21
Connetquot Dr
Oakdale, NY 11769
|
- sq. feet
|
- baths - beds |
show details | |

|
#22
Guilford Ave
Oakdale, NY 11769
|
- sq. feet
|
- baths - beds |
show details | |

|
#23
Windmill Rd
Oakdale, NY 11769
|
- sq. feet
|
- baths - beds |
show details | |

|
#24
Connetquot Dr
Oakdale, NY 11769
|
- sq. feet
|
- baths - beds |
show details | |

|
#25
Lakeside Dr
Oakdale, NY 11769
|
- sq. feet
|
- baths - beds |
show details | |

|
#26
Shore Dr
Oakdale, NY 11769
|
- sq. feet
|
- baths - beds |
show details | |

|
#27
W Shore Rd
Oakdale, NY 11769
|
- sq. feet
|
- baths - beds |
show details | |

|
#28
Greentree Dr
Oakdale, NY 11769
|
- sq. feet
|
- baths - beds |
show details | |

|
#29
Dale Dr
Oakdale, NY 11769
|
- sq. feet
|
- baths - beds |
show details | |

|
#30
Vincent Pl
Oakdale, NY 11769
|
- sq. feet
|
- baths - beds |
show details |
| Photo | Address | Area | Beds / Baths | Price | Details |
|---|---|---|---|---|---|

|
#31
Riverdale Ave
Oakdale, NY 11769
|
- sq. feet
|
- baths - beds |
show details | |

|
#32
Pearl St
Bohemia, NY 11716
|
- sq. feet
|
2 baths 4 beds |
$475,000
|
show details |

|
#33
Herman Ave
North Babylon, NY 11703
|
- sq. feet
|
3 baths 5 beds |
$599,900
|
show details |

|
#34
Wall St
Farmingdale, NY 11735
|
- sq. feet
|
1 baths 3 beds |
$442,000
|
show details |

|
#35
Whiskey Rd
Coram, NY 11727
|
- sq. feet
|
3 baths 4 beds |
$549,900
|
show details |

|
#36
28th St
Copiague, NY 11726
|
- sq. feet
|
4 baths 5 beds |
$499,900
|
show details |

|
#37
Kirby Ln
Central Islip, NY 11722
|
- sq. feet
|
1 baths 3 beds |
$395,200
|
show details |

|
#38
Buena Vista Blvd
Lindenhurst, NY 11757
|
- sq. feet
|
2 baths 4 beds |
$441,750
|
show details |

|
#39
E 21st St
Huntington Station, NY 11746
|
- sq. feet
|
1 baths 3 beds |
$384,500
|
show details |

|
#40
Superior St
Port Jefferson Station, NY 11776
|
- sq. feet
|
1 baths 3 beds |
$265,200
|
show details |
| Photo | Address | Area | Beds / Baths | Price | Details |
|---|---|---|---|---|---|

|
#41
Mill Dr
Mastic Beach, NY 11951
|
- sq. feet
|
1 baths 1 beds |
$244,900
|
show details |

|
#42
Victor Dr
East Northport, NY 11731
|
- sq. feet
|
2 baths 4 beds |
$624,000
|
show details |

|
#43
Hayfield Ct
Commack, NY 11725
|
- sq. feet
|
1 baths 3 beds |
$603,250
|
show details |

|
#44
Brentwood Pkwy
Brentwood, NY 11717
|
- sq. feet
|
4 baths 5 beds |
$468,000
|
show details |

|
#45
Rowland St
Patchogue, NY 11772
|
1,152 sq. feet
|
2 baths 3 beds |
show details | |

|
#46
Fairlane Dr
Selden, NY 11784
|
1,796 sq. feet
|
1 baths 4 beds |
show details | |

|
#47
Lakeside Dr
Ronkonkoma, NY 11779
|
2,648 sq. feet
|
1 baths 4 beds |
show details | |

|
#48
Brian St
Holbrook, NY 11741
|
1,456 sq. feet
|
3 baths 4 beds |
show details | |

|
#49
Woodbrook Cir
Holtsville, NY 11742
|
2,636 sq. feet
|
2 baths 4 beds |
show details | |

|
Check over 1 million property listings on Foreclosure.com!
|
browse all offers | |||

Latest news about housing in Oakdale, NY collected exclusively by city-data.com from local newspapers, TV, and radio stations


Median year apartment built: 1981
Household type by relationship:
Households: 7,369- Male householders: 1,492 (432 living alone), Female householders: 1,317 (470 living alone)
1,445 spouses (1,427 opposite-sex spouses), 122 unmarried partners, (122 opposite-sex unmarried partners), 2,105 children (1,925 natural, 52 adopted, 128 stepchildren), 199 grandchildren, 96 brothers or sisters, 89 parents, 0 foster children, 155 other relatives, 291 non-relatives
- In group quarters: 55
Size of family households: 780 2-persons, 422 3-persons, 280 4-persons, 195 5-persons, 94 6-persons, 25 7-or-more-persons.
Size of nonfamily households: 909 1-person, 60 2-persons, 41 3-persons.
815 married couples with children.
52 single-parent households (0 men, 52 women).
95.4% of residents of Oakdale speak English at home.
0.9% of residents speak Spanish at home (89% speak English very well, 11% don't speak English at all).
0.4% of residents speak other Indo-European language at home (67% speak English very well, 33% speak English not well).
0.9% of residents speak Asian or Pacific Island language at home (51% speak English very well, 26% speak English well, 23% don't speak English at all).
1.6% of residents speak other language at home (100% speak English very well).
Foreign born population: 284 (3.9%)
(79.2% of them are naturalized citizens)
| Here: | 7.1 |
| State: | 6.3 |
| Here: | 3.9 |
| State: | 3.8 |

- Bedrooms in owner-occupied houses and condos in Oakdale, New York
- 0no bedroom
- 1711 bedroom
- 3712 bedrooms
- 7153 bedrooms
- 8334 bedrooms
- 1655+ bedrooms

- Bedrooms in renter-occupied apartments in Oakdale, New York
- 73no bedroom
- 1711 bedroom
- 2242 bedrooms
- 713 bedrooms
- 214 bedrooms
- 05+ bedrooms

- Cars and other vehicles available in Oakdale in owner-occupied houses/condos
- 67no vehicle
- 4811 vehicle
- 9282 vehicles
- 3693 vehicles
- 2654 vehicles
- 1455+ vehicles

- Cars and other vehicles available in Oakdale in renter-occupied apartments
- 111no vehicle
- 2801 vehicle
- 982 vehicles
- 163 vehicles
- 554 vehicles
- 05+ vehicles

- Rooms in owner-occupied houses in Oakdale, New York
- 01 room
- 02 rooms
- 853 rooms
- 2364 rooms
- 2205 rooms
- 2946 rooms
- 4417 rooms
- 3418 rooms
- 6409+ rooms

- Rooms in renter-occupied apartments in Oakdale, New York
- 731 room
- 322 rooms
- 993 rooms
- 2174 rooms
- 635 rooms
- 06 rooms
- 07 rooms
- 588 rooms
- 189+ rooms


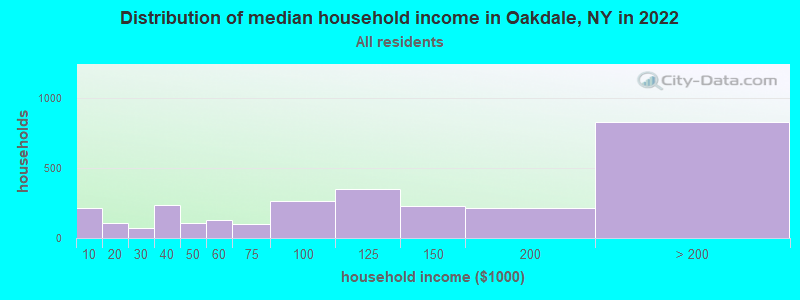
Oakdale, NY household income distribution

- 213Less than $10,000
- 110$10,000 to $19,999
- 71$20,000 to $29,999
- 236$30,000 to $39,999
- 110$40,000 to $49,999
- 128$50,000 to $59,999
- 103$60,000 to $74,999
- 268$75,000 to $99,999
- 349$100,000 to $124,999
- 231$125,000 to $149,999
- 215$150,000 to $199,999
- 831$200,000 or more
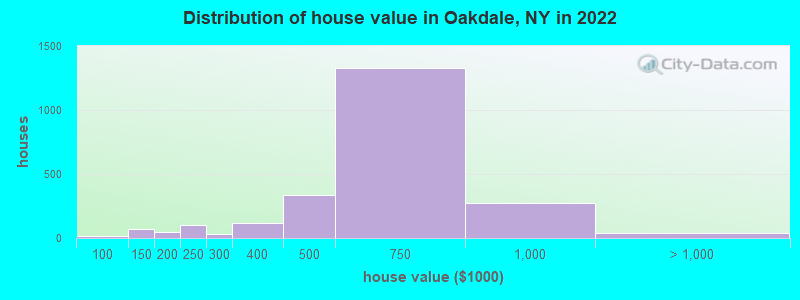
Home value of owner - occupied houses in 2022 in Oakdale, NY
-
- 6Less than $10,000
- 18$70,000 to $79,999
- 71$100,000 to $124,999
- 43$175,000 to $199,999
- 101$200,000 to $249,999
- 33$250,000 to $299,999
- 117$300,000 to $399,999
- 338$400,000 to $499,999
- 1,328$500,000 to $749,999
- 272$750,000 to $999,999
- 15$1,000,000 to $1,499,999
- 8$1,500,000 to $1,999,999
- 16$2,000,000 or more
Rent paid by renters in 2022 in Oakdale, NY
-
- 9$200 to $249
- 73$250 to $299
- 8$300 to $349
- 28$400 to $449
- 9$1,000 to $1,249
- 74$1,250 to $1,499
- 66$1,500 to $1,999
- 236$2,000 to $2,499
- 45$2,500 to $2,999


Percentage of workers working in this county: 89.5%
Number of people working at home: 410 (9.6% of all workers)
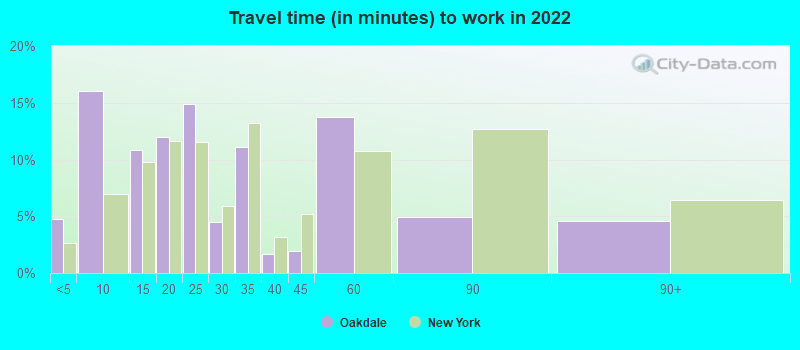
Travel time to work (commute)
- Less than 5 minutes: 74
- 5 to 9 minutes: 288
- 10 to 14 minutes: 435
- 15 to 19 minutes: 662
- 20 to 24 minutes: 427
- 25 to 29 minutes: 172
- 30 to 34 minutes: 793
- 35 to 39 minutes: 148
- 40 to 44 minutes: 174
- 45 to 59 minutes: 327
- 60 to 89 minutes: 98
- 90 or more minutes: 166
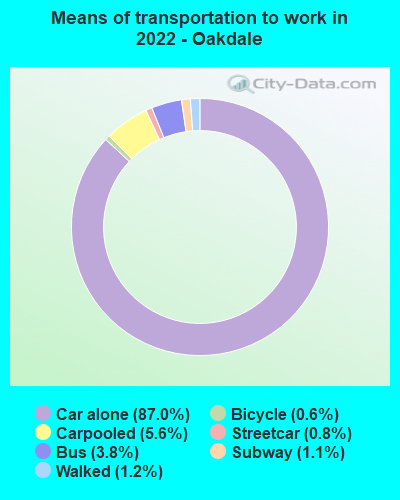
Means of transportation to work:
- Drove a car alone: 1,797 (72.0%)
- Carpooled: 133 (5.3%)
- Bus: 71 (2.8%)
- Subway or elevated rail: 16 (0.6%)
- Long-distance train or commuter rail: 23 (0.9%)
- Bicycle: 9 (0.4%)
- Walked: 25 (1.0%)
- Worked at home: 410 (16.4%)

- Unemployment by race in 2022
- Unemployment rate for White non-Hispanic residents
- 2.0%Males
- 6.4%Females

- Year of entry for the foreign-born population in Oakdale, New York
- 192010 or later
- 572000 to 2009
- 441990 to 1999
- 661980 to 1989
- 71970 to 1979
- 163Before 1970

First ancestries reported:
- Italian: 1,115 (35.3%)
- American: 585 (18.5%)
- Irish: 259 (8.2%)
- German: 254 (8.0%)
- Polish: 145 (4.6%)
- English: 98 (3.1%)
- European: 54 (1.7%)
- Norwegian: 20 (0.6%)
- Scandinavian: 19 (0.6%)
- Jamaican: 18 (0.6%)
- Estonian: 16 (0.5%)
- Greek: 13 (0.4%)
- French Canadian: 12 (0.4%)
- Lithuanian: 11 (0.3%)
- Ukrainian: 10 (0.3%)
- Maltese: 9 (0.3%)
- Syrian: 8 (0.3%)
- Pennsylvania German: 5 (0.2%)
- Dutch: 4 (0.1%)
- Hungarian: 2 (0.06%)
Most common places of birth for foreign-born residents (%):
| Oakdale: | 27.5% (72) |
| New York: | 1.8% (81,374) |
| Oakdale: | 19.8% (52) |
| New York: | 1.4% (65,102) |
| Oakdale: | 11.1% (29) |
| New York: | 9.1% (410,910) |
| Oakdale: | 10.7% (28) |
| New York: | 0.9% (38,713) |
| Oakdale: | 6.5% (17) |
| New York: | 1.7% (75,802) |
| Oakdale: | 6.1% (16) |
| New York: | 0.6% (26,772) |
| Oakdale: | 4.6% (12) |
| New York: | 5.0% (227,557) |
| Oakdale: | 2.7% (7) |
| New York: | 0.7% (30,619) |
| Oakdale: | 2.3% (6) |
| New York: | 0.0% (1,655) |
Place of birth for U.S.-born residents:
- This state: 6,696
- Other state: 300
- Northeast: 93
- Midwest: 37
- South: 36
- West: 155
94.8% of Oakdale residents lived in the same house 1 years ago.
Out of people who lived in different houses, 42.9% lived in this county.
Out of people who lived in different counties, 8.1% lived in New York.
| Oakdale: | 94.8% |
| State average: | 89.6% |
Education attainment for males 25 years and older:
- No schooling: 41
- Nursery to 4th grade: 0
- 5th and 6th grade: 0
- 7th and 8th grade: 0
- 9th grade: 0
- 10th grade: 24
- 11th grade: 0
- 12th grade, no diploma: 0
- High school graduate (or equivalency): 624
- Less than 1 year of college: 213
- Some college more than 1 year, no degree: 224
- Associate degree: 295
- Bachelor's degree: 839
- Master's degree: 378
- Professional school degree: 49
- Doctorate degree: 91

Education attainment for females 25 years and older:
- No schooling: 19
- Nursery to 4th grade: 0
- 5th and 6th grade: 0
- 7th and 8th grade: 0
- 9th grade: 4
- 10th grade: 0
- 11th grade: 24
- 12th grade, no diploma: 34
- High school graduate (or equivalency): 679
- Less than 1 year of college: 192
- Some college more than 1 year, no degree: 232
- Associate degree: 348
- Bachelor's degree: 807
- Master's degree: 605
- Professional school degree: 37
- Doctorate degree: 30


Housing units in structures:
- One, detached: 1,991
- One, attached: 227
- Two: 189
- 3 or 4: 151
- 5 to 9: 86
- 10 to 19: 249
- 20 to 49: 16
- 50 or more: 97
House/condo owner moved in on average 18 years ago
Renter moved in on average 8 years ago

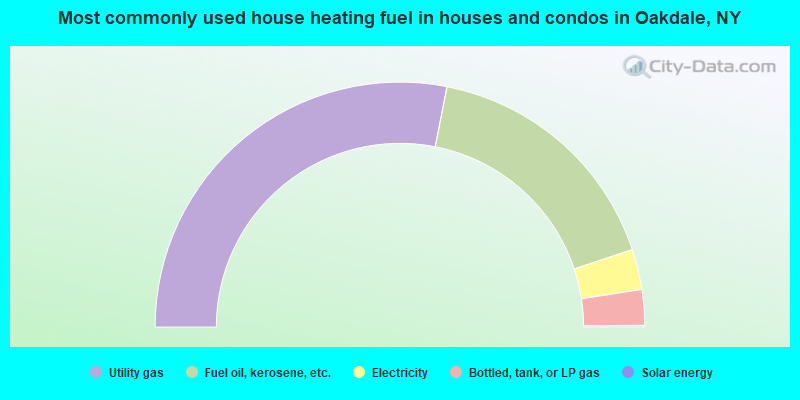
- 56.1%Utility gas
- 33.6%Fuel oil, kerosene, etc.
- 5.3%Electricity
- 4.7%Bottled, tank, or LP gas
- 0.2%Solar energy
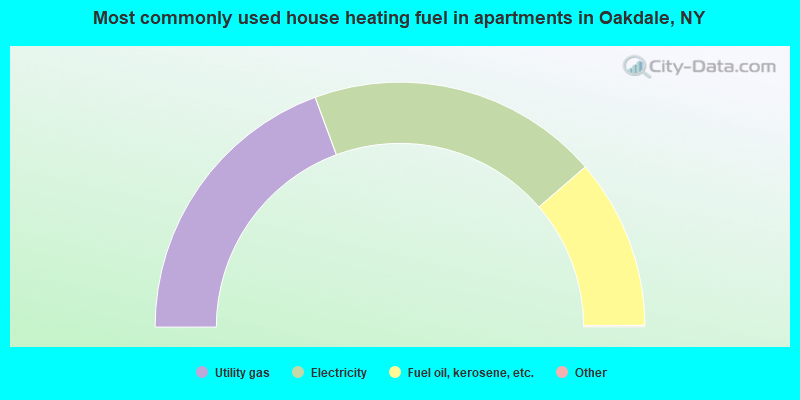
- 38.8%Utility gas
- 38.6%Electricity
- 22.5%Fuel oil, kerosene, etc.
Private vs. public school enrollment:
| Here: | 8.0% |
| New York: | 15.6% |
| Here: | 14.9% |
| New York: | 15.0% |
| Here: | 37.5% |
| New York: | 39.2% |


