Santaquin, UT (Utah) Houses and Residents
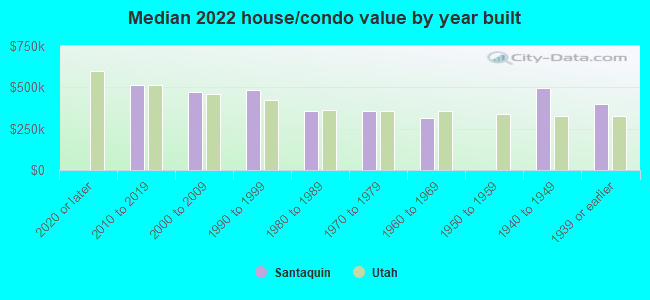
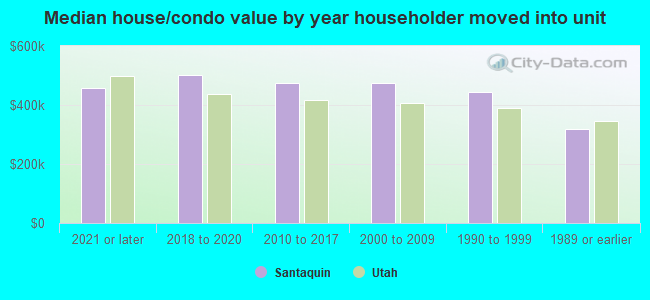
| Santaquin: | $468,050 |
| Utah: | $499,500 |
Total population: 10,106 (Urban population: 4,900 (all inside urban clusters), Rural population: 0)
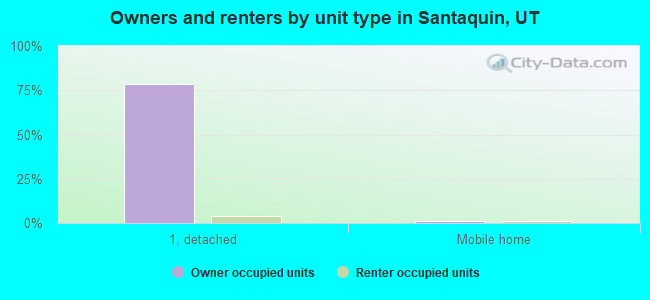
Houses: 4,169 (4,124 occupied: 3,607 owner occupied, 526 renter occupied)
| % of renters here: | 13% |
| State: | 29% |
Housing density: 1,594 houses/condos per square mile
Median price asked for vacant for-sale houses and condos in 2022 in this county: $1,282,768.
Median contract rent in 2022: $1,076 (lower quartile is $613, upper quartile is $1,443)
Median rent asked for vacant for-rent units in 2022: $1,037
Median gross rent in Santaquin, UT in 2022: $1,165
Housing units in Santaquin with a mortgage: 2,847 (556 second mortgage, 50 home equity loan, 459 both second mortgage and home equity loan)
Houses without a mortgage: 19
Median household income for houses/condos with a mortgage: $104,350
Median household income for apartments without a mortgage: $76,946
Median monthly housing costs: $1,569
Compare current foreclosures near Santaquin, UT:
| Photo | Address | Area | Beds / Baths | Price | Details |
|---|---|---|---|---|---|

|
#1
N 240 W
Santaquin, UT 84655
|
1,218 sq. feet
|
2 baths 3 beds |
show details | |

|
#2
N 200 E
Santaquin, UT 84655
|
1,040 sq. feet
|
1 baths 2 beds |
show details | |

|
#3
Slate Dr
Santaquin, UT 84655
|
1,500 sq. feet
|
3 baths 3 beds |
show details | |

|
#4
W 400 N
Santaquin, UT 84655
|
1,326 sq. feet
|
2 baths 3 beds |
show details | |

|
#5
W 550 S
Santaquin, UT 84655
|
975 sq. feet
|
2 baths 3 beds |
show details | |

|
#6
E 180 N
Santaquin, UT 84655
|
- sq. feet
|
2 baths 3 beds |
show details | |

|
#7
N 90 W
Santaquin, UT 84655
|
1,973 sq. feet
|
3 baths 4 beds |
show details | |

|
#8
S Canyon Rd
Santaquin, UT 84655
|
1,970 sq. feet
|
2 baths 3 beds |
show details | |

|
#9
E 400 N
Santaquin, UT 84655
|
1,345 sq. feet
|
2 baths 3 beds |
show details | |

|
#10
N Cherry Ln
Santaquin, UT 84655
|
2,468 sq. feet
|
3 baths 3 beds |
show details |
| Photo | Address | Area | Beds / Baths | Price | Details |
|---|---|---|---|---|---|

|
#11
Stonebrook Ln
Santaquin, UT 84655
|
1,486 sq. feet
|
2 baths 3 beds |
show details | |

|
#12
N 280 W
Santaquin, UT 84655
|
1,312 sq. feet
|
2 baths 3 beds |
show details | |

|
#13
N Peach St
Santaquin, UT 84655
|
936 sq. feet
|
1 baths 3 beds |
show details | |

|
#14
N Peach St
Santaquin, UT 84655
|
1,627 sq. feet
|
2 baths 3 beds |
show details | |

|
#15
E Main St, Trlr 11
Santaquin, UT 84655
|
- sq. feet
|
- baths - beds |
show details | |

|
#16
S Center St Apt 4
Santaquin, UT 84655
|
- sq. feet
|
- baths - beds |
show details | |

|
#17
S Joelle Way
Santaquin, UT 84655
|
- sq. feet
|
- baths - beds |
show details | |

|
#18
Sageberry Dr
Santaquin, UT 84655
|
- sq. feet
|
- baths - beds |
show details | |

|
#19
N 90 W
Santaquin, UT 84655
|
- sq. feet
|
- baths - beds |
show details | |

|
#20
W Dogwood Dr
Santaquin, UT 84655
|
- sq. feet
|
- baths - beds |
show details |
| Photo | Address | Area | Beds / Baths | Price | Details |
|---|---|---|---|---|---|

|
#21
E 1040 N
Santaquin, UT 84655
|
- sq. feet
|
- baths - beds |
show details | |

|
#22
S Center St Apt 6
Santaquin, UT 84655
|
- sq. feet
|
- baths - beds |
show details | |

|
#23
N 500 W
Santaquin, UT 84655
|
- sq. feet
|
- baths - beds |
show details | |

|
#24
S Center St
Santaquin, UT 84655
|
- sq. feet
|
- baths - beds |
show details | |

|
#25
W Divide Dr
Santaquin, UT 84655
|
- sq. feet
|
- baths - beds |
show details | |

|
#26
W 550 N
Springville, UT 84663
|
1,062 sq. feet
|
1 baths 3 beds |
show details | |

|
#27
N 600 W
Payson, UT 84651
|
910 sq. feet
|
2 baths 3 beds |
show details | |

|
#28
S Canyon Dr
Springville, UT 84663
|
1,479 sq. feet
|
2 baths 5 beds |
show details | |

|
#29
E 400 S
Spanish Fork, UT 84660
|
1,150 sq. feet
|
1 baths 4 beds |
show details | |

|
#30
E 150 S
Spanish Fork, UT 84660
|
1,264 sq. feet
|
3 baths 3 beds |
show details |
| Photo | Address | Area | Beds / Baths | Price | Details |
|---|---|---|---|---|---|

|
#31
N Powell Rd
Payson, UT 84651
|
1,921 sq. feet
|
3 baths 3 beds |
show details | |

|
#32
E 500 S
Spanish Fork, UT 84660
|
1,122 sq. feet
|
2 baths 7 beds |
show details | |

|
#33
W Haleys Lookout
Payson, UT 84651
|
1,817 sq. feet
|
2 baths 3 beds |
show details | |

|
#34
E 300 N
Payson, UT 84651
|
894 sq. feet
|
2 baths 3 beds |
show details | |

|
#35
E 200 S
Payson, UT 84651
|
1,380 sq. feet
|
1 baths 3 beds |
show details | |

|
#36
E 500 S
Spanish Fork, UT 84660
|
1,142 sq. feet
|
2 baths 3 beds |
show details | |

|
#37
E 1850 S
Spanish Fork, UT 84660
|
2,158 sq. feet
|
3 baths 2 beds |
show details | |

|
#38
River Bottom Rd
Springville, UT 84663
|
1,461 sq. feet
|
2 baths 3 beds |
show details | |

|
#39
Eldorado Dr
Springville, UT 84663
|
1,044 sq. feet
|
2 baths 2 beds |
show details | |

|
#40
E 400 N
Payson, UT 84651
|
1,604 sq. feet
|
1 baths 3 beds |
show details |
| Photo | Address | Area | Beds / Baths | Price | Details |
|---|---|---|---|---|---|

|
#41
W Center St
Salem, UT 84653
|
2,754 sq. feet
|
3 baths 2 beds |
show details | |

|
#42
S 650 W # A6
Springville, UT 84663
|
1,310 sq. feet
|
2 baths 3 beds |
show details | |

|
#43
W Center St
Spanish Fork, UT 84660
|
1,586 sq. feet
|
2 baths 4 beds |
show details | |

|
#44
W 600 N
Mapleton, UT 84664
|
1,062 sq. feet
|
2 baths 5 beds |
show details | |

|
#45
S 1000 W
Payson, UT 84651
|
1,020 sq. feet
|
1 baths 2 beds |
show details | |

|
#46
E Maple St
Mapleton, UT 84664
|
4,008 sq. feet
|
4 baths 4 beds |
show details | |

|
#47
S Main St
Springville, UT 84663
|
1,276 sq. feet
|
2 baths 4 beds |
show details | |

|
#48
S Chrisman Dr
Salem, UT 84653
|
2,838 sq. feet
|
3 baths 6 beds |
show details | |

|
#49
W 150 S
Springville, UT 84663
|
1,788 sq. feet
|
2 baths 4 beds |
show details | |

|
Check over 1 million property listings on Foreclosure.com!
|
browse all offers | |||

Latest news about housing in Santaquin, UT collected exclusively by city-data.com from local newspapers, TV, and radio stations

 | Possible move to Cedar City, UT (61 replies) |
| Inversion Cap Elevation? (40 replies) |
| Power Plant Eyesore in Vineyard (59 replies) |
| Single mom looking for low income housing (not public housing) (5 replies) |
| Affordable places to live in Utah?? Help! (15 replies) |
| What will happen when the Wasatch Front runs out of buildable land? (19 replies) |

Median year apartment built: 1996
Household type by relationship:
Households: 15,253- Male householders: 2,145 (159 living alone), Female householders: 1,848 (200 living alone)
3,138 spouses (3,124 opposite-sex spouses), 111 unmarried partners, (107 opposite-sex unmarried partners), 7,128 children (6,708 natural, 122 adopted, 297 stepchildren), 305 grandchildren, 208 brothers or sisters, 182 parents, 0 foster children, 123 other relatives, 58 non-relatives
- In group quarters: 2
Size of family households: 651 2-persons, 803 3-persons, 757 4-persons, 757 5-persons, 510 6-persons, 197 7-or-more-persons.
Size of nonfamily households: 386 1-person, 58 2-persons, 1 3-persons.
4,996 married couples with children.
663 single-parent households (253 men, 410 women).
88.0% of residents of Santaquin speak English at home.
9.8% of residents speak Spanish at home (72% speak English very well, 9% speak English well, 13% speak English not well, 6% don't speak English at all).
1.0% of residents speak other Indo-European language at home (77% speak English very well, 5% speak English well, 18% speak English not well).
0.6% of residents speak Asian or Pacific Island language at home (95% speak English very well, 5% speak English well).
Foreign born population: 574 (3.8%)
(39.2% of them are naturalized citizens)
| Here: | 7.1 |
| State: | 7.6 |
| Here: | 4.6 |
| State: | 4.3 |
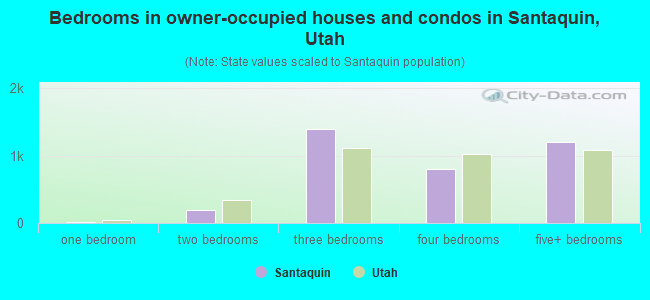
- Bedrooms in owner-occupied houses and condos in Santaquin, Utah
- 0no bedroom
- 211 bedroom
- 1862 bedrooms
- 1,3963 bedrooms
- 8084 bedrooms
- 1,1975+ bedrooms
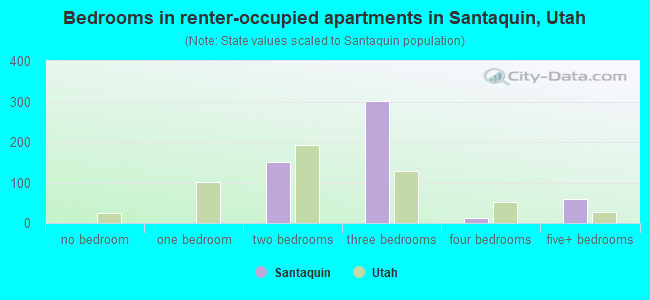
- Bedrooms in renter-occupied apartments in Santaquin, Utah
- 0no bedroom
- 11 bedroom
- 1512 bedrooms
- 3023 bedrooms
- 134 bedrooms
- 595+ bedrooms
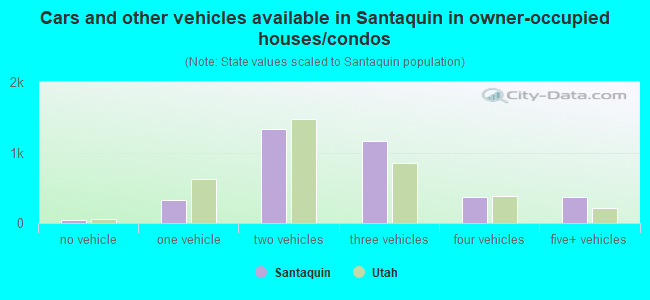
- Cars and other vehicles available in Santaquin in owner-occupied houses/condos
- 40no vehicle
- 3231 vehicle
- 1,3382 vehicles
- 1,1693 vehicles
- 3704 vehicles
- 3675+ vehicles
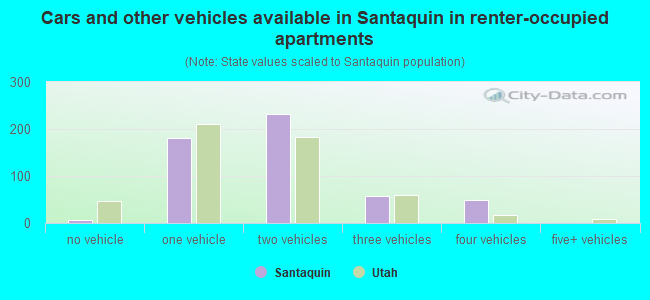
- Cars and other vehicles available in Santaquin in renter-occupied apartments
- 7no vehicle
- 1811 vehicle
- 2322 vehicles
- 573 vehicles
- 494 vehicles
- 05+ vehicles
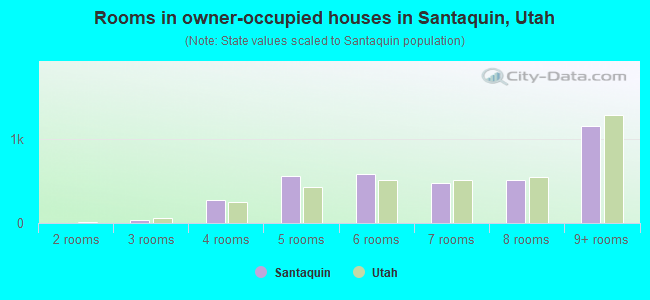
- Rooms in owner-occupied houses in Santaquin, Utah
- 01 room
- 02 rooms
- 403 rooms
- 2734 rooms
- 5585 rooms
- 5886 rooms
- 4787 rooms
- 5098 rooms
- 1,1619+ rooms
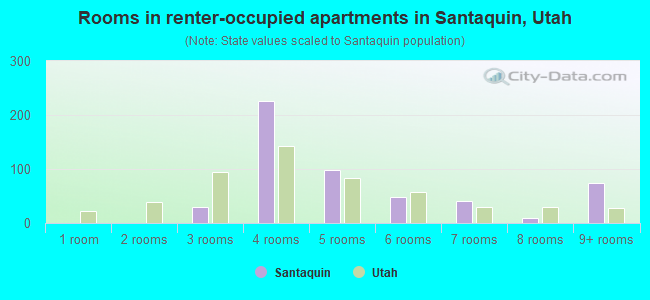
- Rooms in renter-occupied apartments in Santaquin, Utah
- 01 room
- 02 rooms
- 293 rooms
- 2254 rooms
- 995 rooms
- 496 rooms
- 407 rooms
- 98 rooms
- 749+ rooms
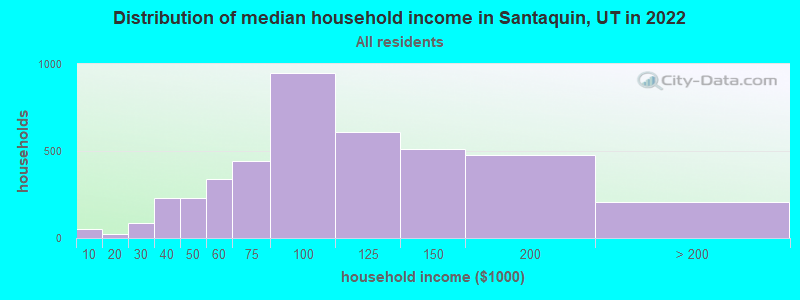
Santaquin, UT household income distribution

- 51Less than $10,000
- 22$10,000 to $19,999
- 86$20,000 to $29,999
- 231$30,000 to $39,999
- 229$40,000 to $49,999
- 339$50,000 to $59,999
- 444$60,000 to $74,999
- 946$75,000 to $99,999
- 609$100,000 to $124,999
- 511$125,000 to $149,999
- 479$150,000 to $199,999
- 207$200,000 or more
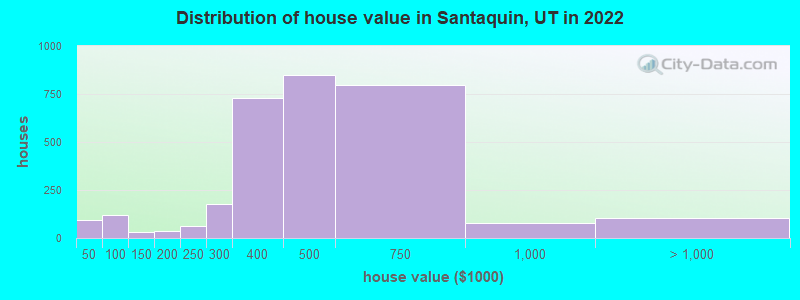
Home value of owner - occupied houses in 2022 in Santaquin, UT
-
- 22Less than $10,000
- 9$20,000 to $24,999
- 41$25,000 to $29,999
- 3$30,000 to $34,999
- 17$40,000 to $49,999
- 3$50,000 to $59,999
- 83$60,000 to $69,999
- 13$70,000 to $79,999
- 28$100,000 to $124,999
- 2$125,000 to $149,999
- 18$150,000 to $174,999
- 17$175,000 to $199,999
- 61$200,000 to $249,999
- 175$250,000 to $299,999
- 729$300,000 to $399,999
- 848$400,000 to $499,999
- 796$500,000 to $749,999
- 80$750,000 to $999,999
- 103$1,000,000 to $1,499,999
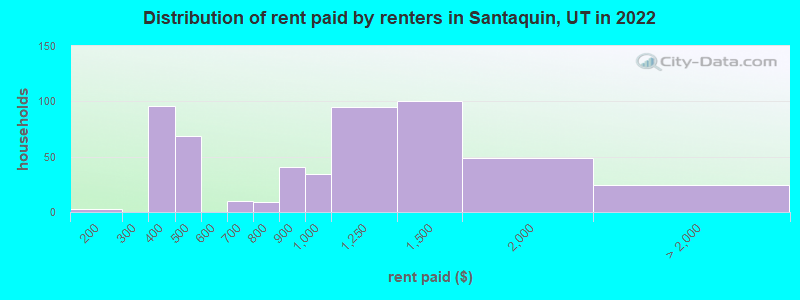
Rent paid by renters in 2022 in Santaquin, UT
-
- 3$150 to $199
- 12$300 to $349
- 84$350 to $399
- 68$450 to $499
- 9$600 to $649
- 8$700 to $749
- 41$800 to $899
- 33$900 to $999
- 95$1,000 to $1,249
- 100$1,250 to $1,499
- 49$1,500 to $1,999
- 9$2,000 to $2,499
- 15No cash rent
Percentage of workers working in this county: 91.6%
Number of people working at home: 1,048 (15.0% of all workers)
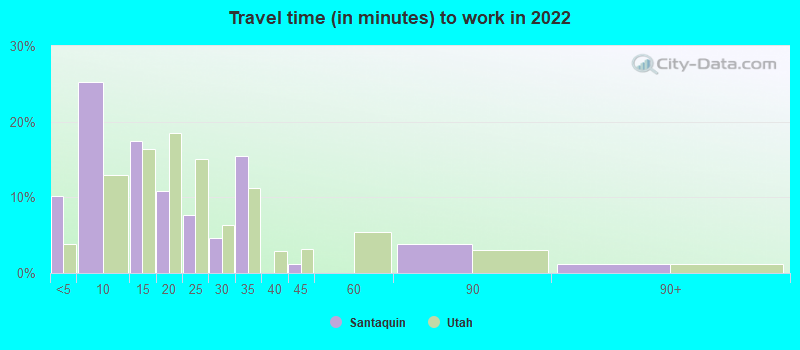
Travel time to work (commute)
- Less than 5 minutes: 112
- 5 to 9 minutes: 598
- 10 to 14 minutes: 801
- 15 to 19 minutes: 790
- 20 to 24 minutes: 824
- 25 to 29 minutes: 392
- 30 to 34 minutes: 1,068
- 35 to 39 minutes: 349
- 40 to 44 minutes: 154
- 45 to 59 minutes: 265
- 60 to 89 minutes: 400
- 90 or more minutes: 78
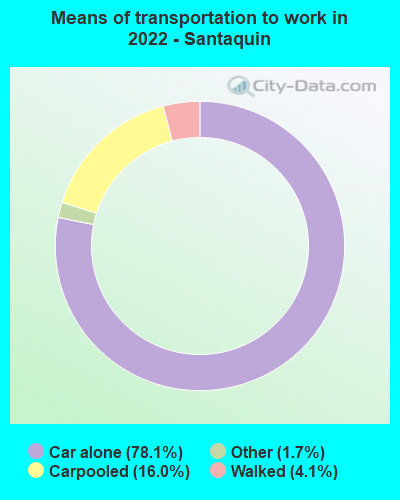
Means of transportation to work:
- Drove a car alone: 1,110 (48.2%)
- Carpooled: 224 (9.7%)
- Taxi: 26 (1.1%)
- Walked: 43 (1.9%)
- Worked at home: 1,048 (45.5%)
- Unemployment by race in 2022
- Unemployment rate for White non-Hispanic residents
- 1.4%Males
- 3.9%Females
- Unemployment rate for other race residents
- 23.1%Females
- Unemployment rate for Hispanic or Latino residents
- 1.1%Males
- 7.5%Females
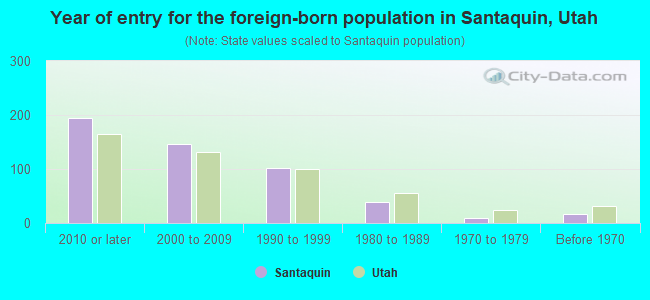
- Year of entry for the foreign-born population in Santaquin, Utah
- 1942010 or later
- 1462000 to 2009
- 1021990 to 1999
- 391980 to 1989
- 91970 to 1979
- 17Before 1970
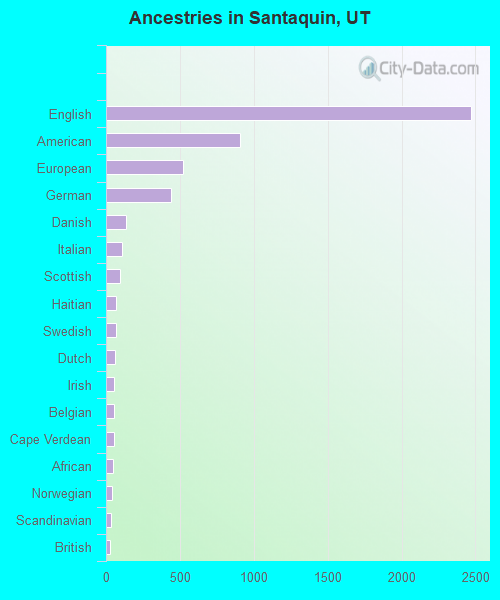
First ancestries reported:
- English: 2,468 (34.1%)
- American: 905 (12.5%)
- European: 521 (7.2%)
- German: 437 (6.0%)
- Danish: 135 (1.9%)
- Italian: 107 (1.5%)
- Scottish: 98 (1.4%)
- Haitian: 68 (0.9%)
- Swedish: 66 (0.9%)
- Dutch: 64 (0.9%)
- Irish: 53 (0.7%)
- Belgian: 51 (0.7%)
- Cape Verdean: 51 (0.7%)
- African: 44 (0.6%)
- Norwegian: 43 (0.6%)
- Scandinavian: 35 (0.5%)
- British: 30 (0.4%)
- French: 21 (0.3%)
- Northern European: 19 (0.3%)
- Swiss: 10 (0.1%)
- Greek: 7 (0.10%)
- Icelander: 6 (0.08%)
- Polish: 3 (0.04%)
- Eastern European: 2 (0.03%)
Most common places of birth for foreign-born residents (%):
| Santaquin: | 63.0% (336) |
| Utah: | 36.1% (99,740) |
| Santaquin: | 13.5% (72) |
| Utah: | 2.9% (7,901) |
| Santaquin: | 9.6% (51) |
| Utah: | 0.1% (257) |
| Santaquin: | 4.3% (23) |
| Utah: | 2.7% (7,472) |
| Santaquin: | 2.8% (15) |
| Utah: | 2.8% (7,644) |
| Santaquin: | 2.1% (11) |
| Utah: | 2.1% (5,902) |
| Santaquin: | 1.5% (8) |
| Utah: | 0.4% (977) |
Place of birth for U.S.-born residents:
- This state: 11,907
- Other state: 2,651
- Northeast: 117
- Midwest: 226
- South: 394
- West: 1,912
88.2% of Santaquin residents lived in the same house 1 years ago.
Out of people who lived in different houses, 35.3% lived in this county.
Out of people who lived in different counties, 48.0% lived in Utah.
| Santaquin: | 88.2% |
| State average: | 85.7% |
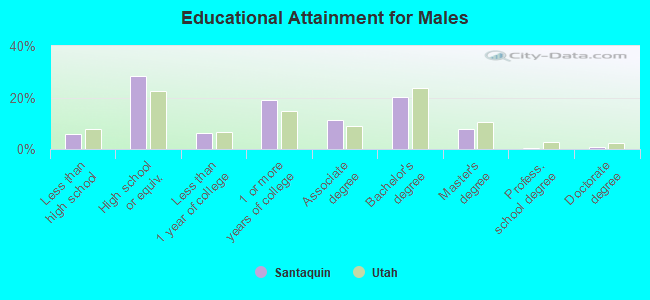
Education attainment for males 25 years and older:
- No schooling: 11
- Nursery to 4th grade: 35
- 5th and 6th grade: 23
- 7th and 8th grade: 0
- 9th grade: 1
- 10th grade: 46
- 11th grade: 47
- 12th grade, no diploma: 56
- High school graduate (or equivalency): 1,084
- Less than 1 year of college: 235
- Some college more than 1 year, no degree: 727
- Associate degree: 437
- Bachelor's degree: 776
- Master's degree: 304
- Professional school degree: 15
- Doctorate degree: 34
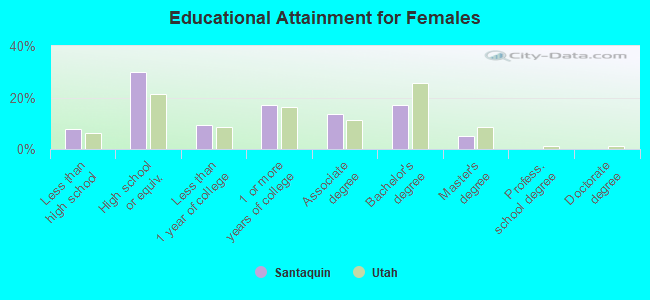
Education attainment for females 25 years and older:
- No schooling: 95
- Nursery to 4th grade: 31
- 5th and 6th grade: 17
- 7th and 8th grade: 0
- 9th grade: 0
- 10th grade: 23
- 11th grade: 58
- 12th grade, no diploma: 86
- High school graduate (or equivalency): 1,193
- Less than 1 year of college: 366
- Some college more than 1 year, no degree: 691
- Associate degree: 537
- Bachelor's degree: 687
- Master's degree: 207
- Professional school degree: 0
- Doctorate degree: 7


Housing units in structures:
- One, detached: 3,511
- One, attached: 224
- Two: 56
- 3 or 4: 49
- 5 to 9: 65
- 10 to 19: 52
- 20 to 49: 52
- Mobile homes: 157
Median worth of mobile homes: $42,865
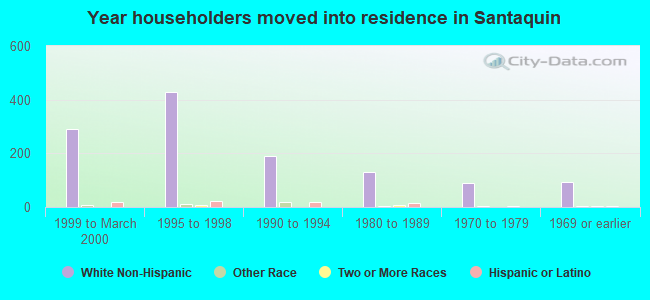
House/condo owner moved in on average 6 years ago
Renter moved in on average 4 years ago
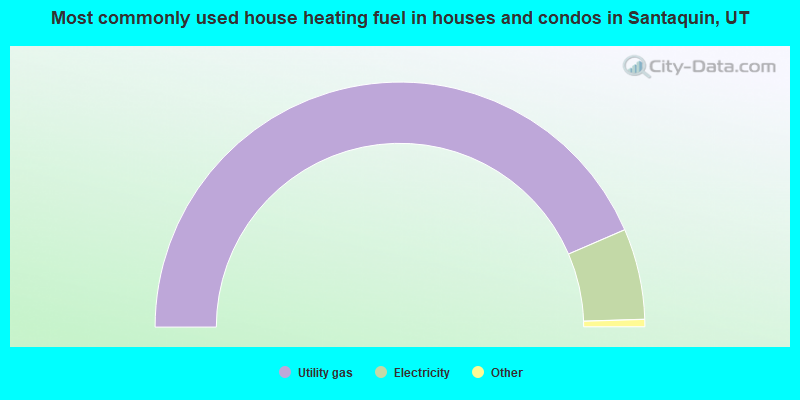
- 87.0%Utility gas
- 12.0%Electricity
- 0.6%Bottled, tank, or LP gas
- 0.4%Wood
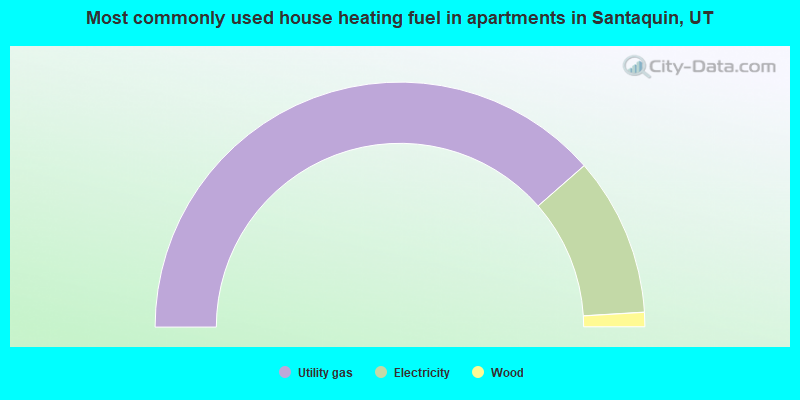
- 77.2%Utility gas
- 21.0%Electricity
- 1.9%Wood
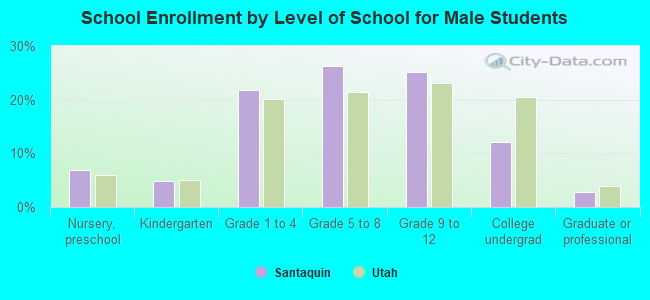
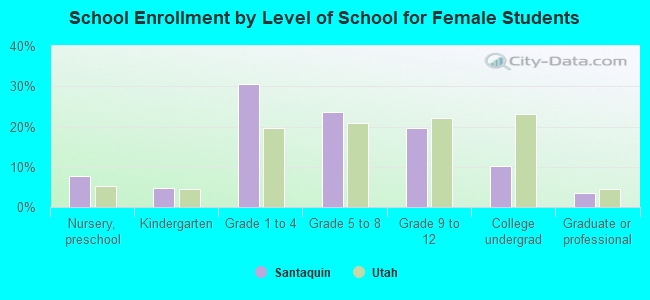
Private vs. public school enrollment:
| Here: | 15.2% |
| Utah: | 7.2% |
| Here: | 5.9% |
| Utah: | 5.3% |
| Here: | 30.8% |
| Utah: | 26.7% |