Races in Fairmount, New York (NY) Detailed Stats
Ancestries, Foreign-born residents, place of birth
Settings
X


Recent posts about races in Fairmount, New York on our local forum with over 2,400,000 registered users:
 | Diversity in the Sedgwick Farms Neighborhood, Syracuse, NY (60 replies) |
| Top Syracuse, NY area Tourist Attractions (17 replies) |
| What's So Great About Syracuse? (15 replies) |
| 30 year old female professional relocating (58 replies) |
| Possible move to Syracuse (59 replies) |
| Thinking of buying a home in the Syracuse Area (44 replies) |
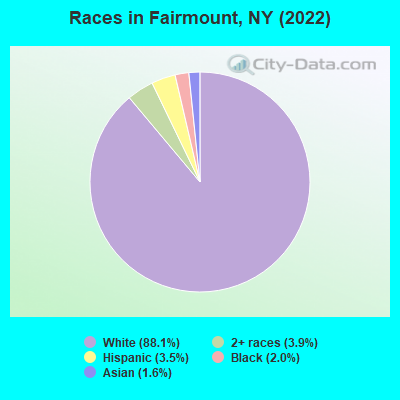
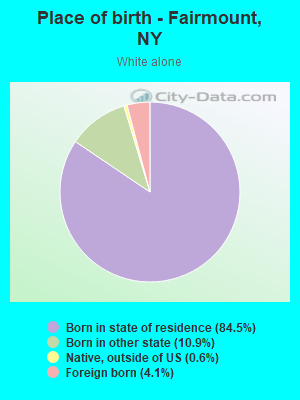
According to 2022 data, the most numerous races in Fairmount, NY are White alone (8,707 residents), Hispanic (350 residents), and Black alone (193 residents). 95.1% of Fairmount residents speak English at home. 6.3% of Fairmount, NY residents are foreign-born (2.5% born in Europe, 2.1% born in Asia, 1.0% born in Latin America), which is 248.0% less than the foreign-born rate of 22.0% across the entire state of New York.
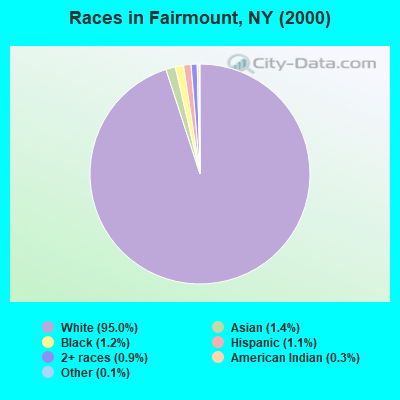
Race distribution in Fairmount
2000
2022

- 10,25995.0%White alone
- 1461.4%Asian alone
- 1291.2%Black alone
- 1151.1%Hispanic
- 960.9%Two or more races
- 330.3%American Indian alone
- 150.1%Other race alone
- 20.02%Native Hawaiian and Other
Pacific Islander alone
-
- 8,70788.1%White alone
- 3883.9%Two or more races
- 3503.5%Hispanic
- 1932.0%Black alone
- 1591.6%Asian alone
- 90.09%American Indian alone
2000
2022
-
- 11,760,98162.0%White alone
- 2,867,58315.1%Hispanic
- 2,812,62314.8%Black alone
- 1,035,9265.5%Asian alone
- 366,1161.9%Two or more races
- 75,4990.4%Other race alone
- 52,4990.3%American Indian alone
- 5,2300.03%Native Hawaiian and Other
Pacific Islander alone

-
- 10,408,93352.9%White alone
- 3,867,29919.7%Hispanic
- 2,633,84013.4%Black alone
- 1,776,2869.0%Asian alone
- 732,6703.7%Two or more races
- 216,1101.1%Other race alone
- 35,0820.2%American Indian alone
- 6,9310.04%Native Hawaiian and Other
Pacific Islander alone

Income and house value in Fairmount
- Median household income in 2022
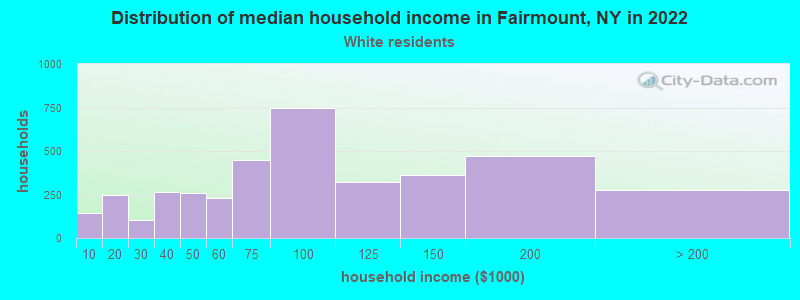
- $80,362White non-Hispanic householders
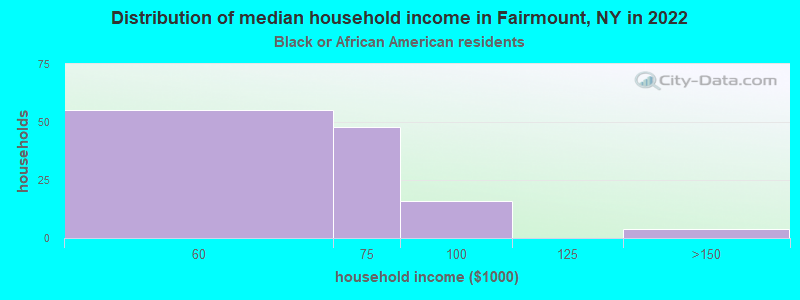
- $58,340Black householders
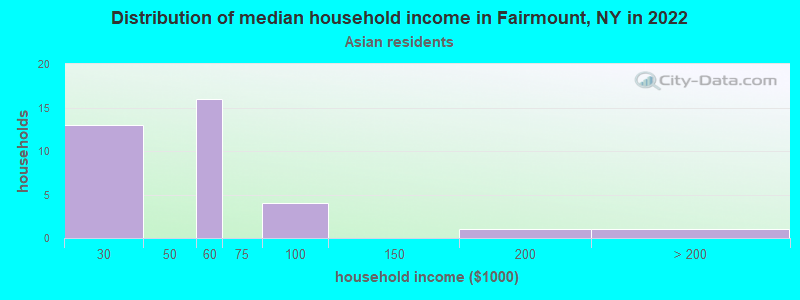
- $46,375Asian householders
- $158,675Two or more races householders
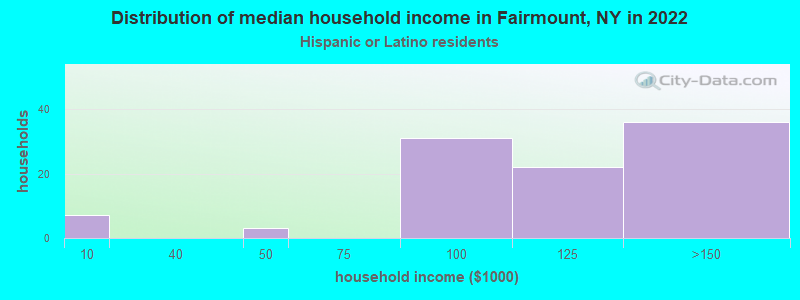
- $103,533Hispanic or Latino race householders
- Median 2022 house value
- $168,495White Non-Hispanic householders
- $80,080Black or African American householders
- $279,470American Indian or Alaska Native householders
- $159,755Asian householders
- $225,812Two or more races householders
- $647,965Hispanic or Latino householders
Household income for White non-Hispanic householders
Household income for Black householders
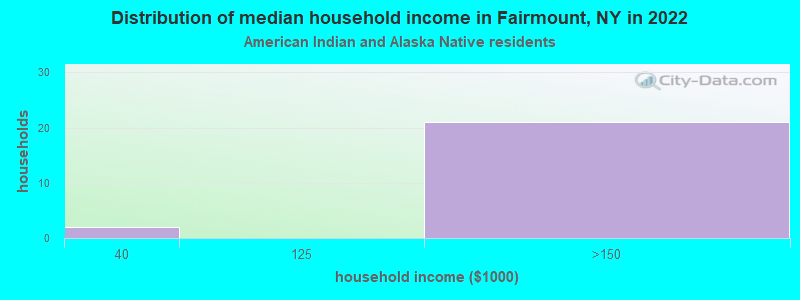
Household income for American Indian and Alaska Native householders
Household income for Asian householders
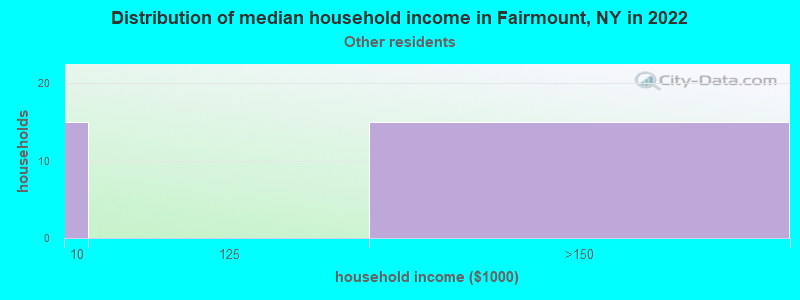
Household income for Some other race householders
Household income for Two or more races householders
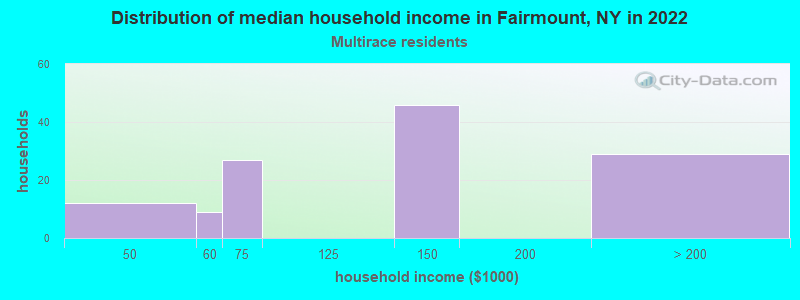
Household income for Hispanic or Latino race householders
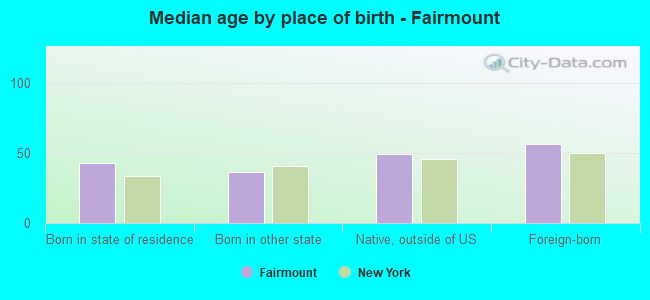
Median age by race in Fairmount
- 45.1Median age for White residents
- 44.5Males
- 46.1Females
- 50.4Median age for Black or African American residents
- 51.5Males
- 38.9Females
- -652,291,104.5Median age for American Indian / Alaska Native residents
- -678,663,238.4Males
- -555,555,555.0Females
- 33.0Median age for Asian residents
- 12.5Males
- 38.9Females
- -487,992,314.6Median age for Native Hawaiian / Pacific Islander residents
- -477,502,295.2Males
- -497,387,669.3Females
- 26.9Median age for Other race residents
- -936,446,172.9Males
- 24.9Females
- 21.0Median age for Two or more races residents
- 19.5Males
- 31.4Females
- 45.0Median age for White alone residents
- 44.8Males
- 47.2Females
- 27.6Median age for Hispanic or Latino residents
- 32.1Males
- 23.6Females
Owner/renter occupied households by race in Fairmount
- House owners and renters - White residents
- 3,12781.2%Owner occupied
- 72618.8%Renter occupied
- House owners and renters - Black or African American residents
- 2824.9%Owner occupied
- 8475.1%Renter occupied
- House owners and renters - American Indian / Alaska Native residents
- 14100.0%Owner occupied
- House owners and renters - Asian residents
- 1033.9%Owner occupied
- 1966.1%Renter occupied
- House owners and renters - Other race residents
- 27100.0%Owner occupied
- House owners and renters - Two or more races residents
- 8064.1%Owner occupied
- 4535.9%Renter occupied
- House owners and renters - White alone residents
- 3,12781.5%Owner occupied
- 71118.5%Renter occupied
- House owners and renters - Hispanic or Latino residents
- 5967.1%Owner occupied
- 2932.9%Renter occupied
Language usage in Fairmount
- English speakers - Total
- 95.1% of residents of Fairmount speak English at home.
- 1.1% of residents speak Spanish at home
- 7474.0%Speak English very well
- 2626.0%Speak English less than very well
- 3.7% of residents speak other language at home
- 16749.7%Speak English very well
- 16950.3%Speak English less than very well
- English speakers - Born in the United States
- 98.3% of residents of Fairmount speak English at home.
- English speakers - Native, born elsewhere
- 76.1% of residents of Fairmount speak English at home.
- 7.5% of residents speak other language at home
- 5100.0%Speak English very well
- English speakers - Foreign-born
- 41.4% of residents of Fairmount speak English at home.
- 4.8% of residents speak Spanish at home
- 1765.4%Speak English very well
- 934.6%Speak English less than very well
- 52.9% of residents speak other language at home
- 12744.6%Speak English very well
- 15855.4%Speak English less than very well
White (Caucasian) - Speak only English
| Native: | 99.6% (7,801) |
| Foreign-born: | 50.4% (177) |
White (Caucasian) - Speak another language
| Native: | 0.7% (54) |
| Foreign-born: | 53.5% (187) |
Black or African American - Speak only English
| Native: | 98.8% (154) |
| Foreign-born: | 55.7% (18) |
Asian - Speak another language
| Native: | 100.0% (1) |
| Foreign-born: | 69.2% (80) |
Two or more races - Speak only English
| Native: | 88.4% (423) |
| Foreign-born: | 50.0% (18) |
Two or more races - Speak another language
| Native: | 8.4% (40) |
| Foreign-born: | 54.6% (19) |
White alone - Speak only English
| Native: | 99.5% (7,755) |
| Foreign-born: | 43.3% (152) |
White alone - Speak another language
| Native: | 0.6% (47) |
| Foreign-born: | 58.4% (206) |
Hispanic or Latino - Speak only English
| Native: | 83.3% (181) |
| Foreign-born: | 67.6% (42) |
Hispanic or Latino - Speak another language
| Native: | 17.4% (38) |
| Foreign-born: | 43.3% (27) |
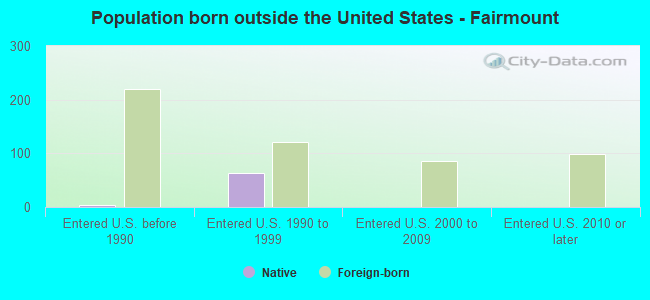
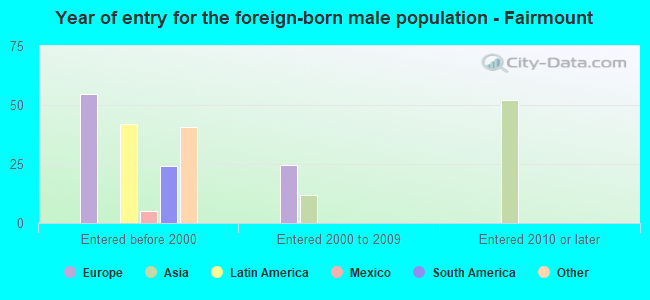
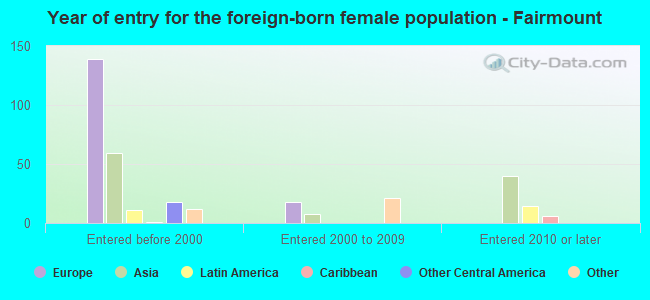
Foreign-born residents in Fairmount
625 residents are foreign born (2.5% Europe, 2.1% Asia, 1.0% Latin America).
| This city: | 6.3% |
| New York: | 22.6% |

Marital status for residents in Fairmount
Marital status - White (Caucasian) population 15 years and over
- Males
- 28.4%Never married
- 51.2%Now married
- 0.1%Separated
- 9.0%Widowed
- 11.3%Divorced
- Females
- 26.1%Never married
- 46.3%Now married
- 0.9%Separated
- 9.7%Widowed
- 16.9%Divorced
Women who gave birth in the past 12 months
| Now married: | 79.9% (132) |
| Unmarried: | 20.1% (33) |
Women who did not give birth in the past 12 months
| Now married: | 35.7% (623) |
| Unmarried: | 64.3% (1,123) |
Marital status - Black or African American population 15 years and over
- Males
- 18.8%Never married
- 32.7%Now married
- 48.5%Separated
- 0.0%Widowed
- 0.0%Divorced
- Females
- 65.3%Never married
- 31.9%Now married
- 2.8%Separated
- 0.0%Widowed
- 0.0%Divorced
Women who did not give birth in the past 12 months
| Now married: | 34.1% (15) |
| Unmarried: | 65.9% (29) |
Marital status - Asian population 15 years and over
- Males
- 15.4%Never married
- 84.6%Now married
- 0.0%Separated
- 0.0%Widowed
- 0.0%Divorced
- Females
- 8.5%Never married
- 90.4%Now married
- 0.0%Separated
- 0.0%Widowed
- 1.1%Divorced
Women who did not give birth in the past 12 months
| Now married: | 88.7% (65) |
| Unmarried: | 11.3% (8) |
Marital status - Other race population 15 years and over
- Males
- 0.0%Never married
- 0.0%Now married
- 0.0%Separated
- 0.0%Widowed
- 100.0%Divorced
- Females
- 51.1%Never married
- 23.4%Now married
- 0.0%Separated
- 0.0%Widowed
- 25.5%Divorced
Women who did not give birth in the past 12 months
| Now married: | 0.0% (0) |
| Unmarried: | 100.0% (26) |
Marital status - Two or more races population 15 years and over
- Males
- 40.8%Never married
- 54.1%Now married
- 0.0%Separated
- 0.0%Widowed
- 5.1%Divorced
- Females
- 38.9%Never married
- 50.0%Now married
- 0.0%Separated
- 0.0%Widowed
- 11.1%Divorced
Women who did not give birth in the past 12 months
| Now married: | 43.1% (40) |
| Unmarried: | 56.9% (53) |
Marital status - White alone, not Hispanic / Latino population 15 years and over
- Males
- 28.8%Never married
- 50.4%Now married
- 0.1%Separated
- 9.2%Widowed
- 11.6%Divorced
- Females
- 26.0%Never married
- 46.3%Now married
- 0.9%Separated
- 9.8%Widowed
- 17.0%Divorced
Women who gave birth in the past 12 months
| Now married: | 79.9% (133) |
| Unmarried: | 20.1% (33) |
Women who did not give birth in the past 12 months
| Now married: | 35.4% (613) |
| Unmarried: | 64.6% (1,117) |
Marital status - Hispanic or Latino population 15 years and over
- Males
- 23.4%Never married
- 69.0%Now married
- 0.0%Separated
- 0.0%Widowed
- 7.6%Divorced
- Females
- 42.4%Never married
- 47.5%Now married
- 0.0%Separated
- 0.0%Widowed
- 10.2%Divorced
Women who did not give birth in the past 12 months
| Now married: | 35.1% (27) |
| Unmarried: | 64.9% (51) |
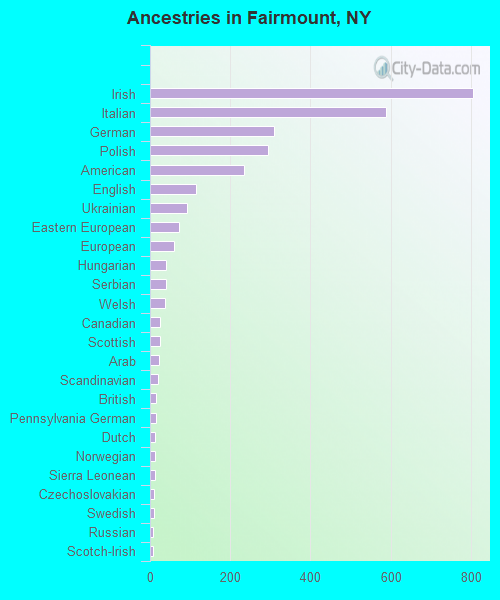
Ancestries in Fairmount

- 80524.0%Irish
- 58817.5%Italian
- 3109.2%German
- 2948.7%Polish
- 2357.0%American
- 1143.4%English
- 922.7%Ukrainian
- 732.2%Eastern European
- 611.8%European
- 401.2%Hungarian
- 391.2%Serbian
- 371.1%Welsh
- 250.7%Canadian
- 240.7%Scottish
- 220.7%Arab
- 200.6%Scandinavian
- 160.5%British
- 140.4%Pennsylvania German
- 130.4%Dutch
- 130.4%Norwegian
- 120.4%Sierra Leonean
- 110.3%Czechoslovakian
- 110.3%Swedish
- 80.2%Russian
- 80.2%Scotch-Irish
- 70.2%Austrian
- 70.2%French
- 70.2%French Canadian
- 50.1%Lebanese
- 10.03%Jamaican
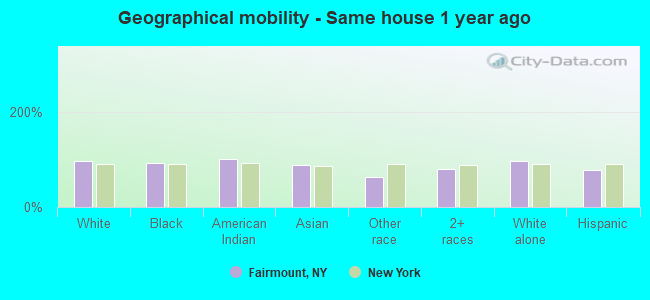
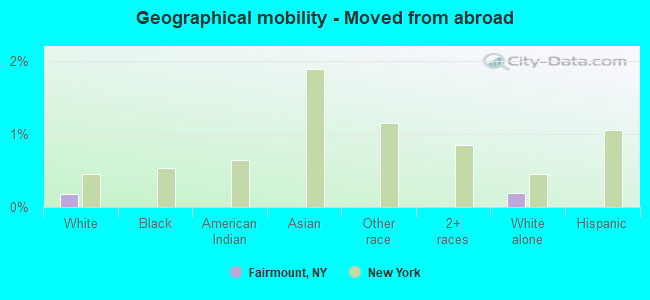
Geographical mobility in Fairmount

- Same house 1 year ago
- 8,19295.9%White (Caucasian)
- 18092.3%Black or African American
- 14100.0%American Indian / Alaska Native
- 14088.8%Asian
- 3562.8%Other race
- 44779.2%Two or more races
- 8,16296.0%White alone, not Hispanic / Latino
- 24277.7%Hispanic or Latino
-
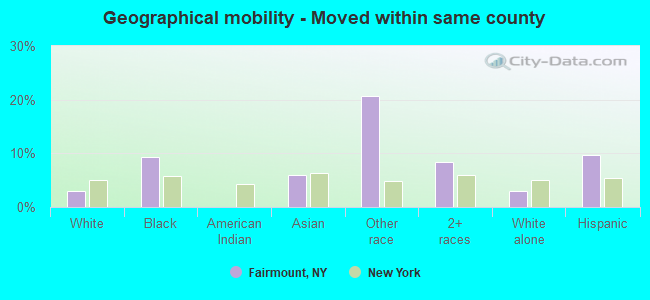
- Moved within same county
- 2623.1%White / Caucasian
- 189.3%Black or African American
- 96.0%Asian
- 1120.6%Other race
- 488.5%Two or more races
- 2513.0%White alone, not Hispanic / Latino
- 309.7%Hispanic or Latino
-
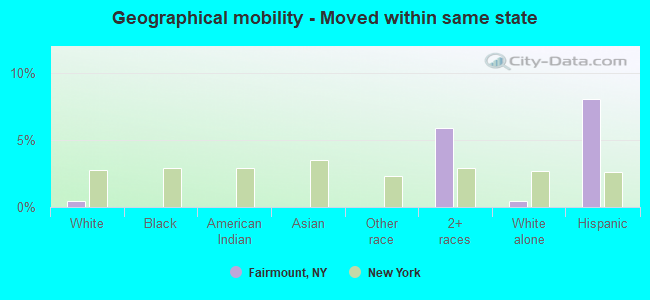
- Moved within same state
- 350.4%White / Caucasian
- 335.9%Two or more races
- 360.4%White alone, not Hispanic / Latino
- 258.1%Hispanic or Latino
-
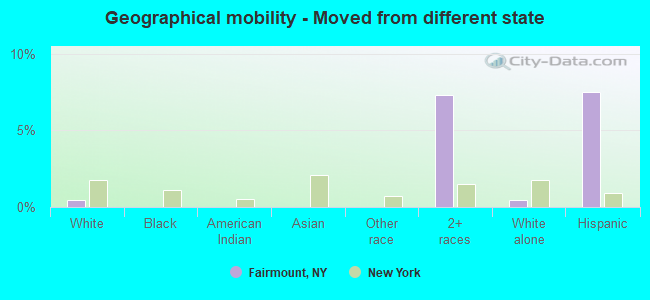
- Moved from different state
- 370.4%White / Caucasian
- 417.3%Two or more races
- 370.4%White alone, not Hispanic / Latino
- 237.5%Hispanic or Latino
-
- Moved from abroad
- 150.2%White
- 170.2%White alone, not Hispanic / Latino
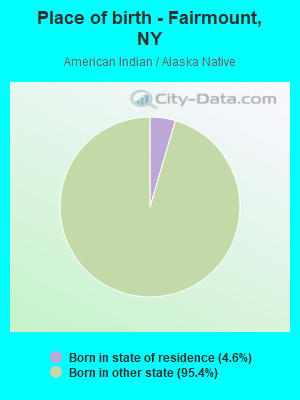
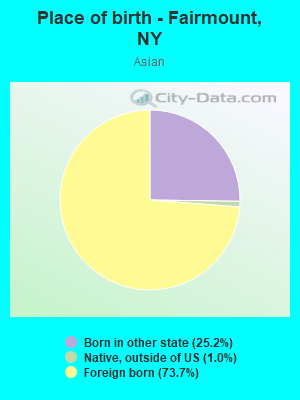
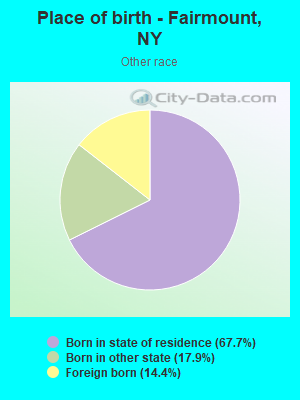
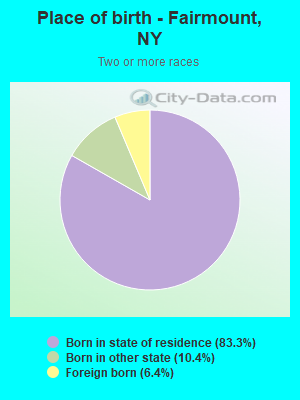
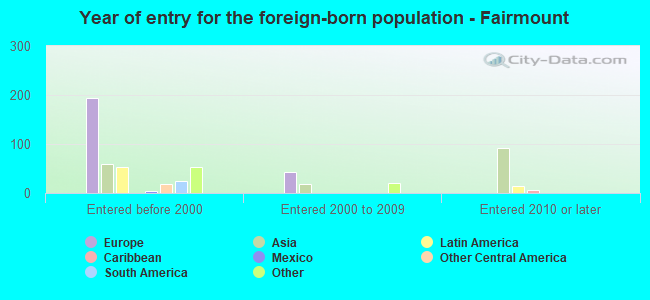
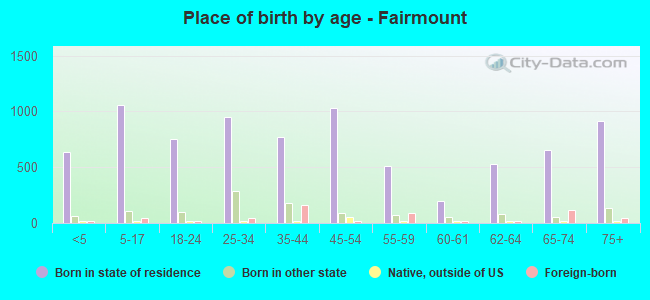
Children Nativity (place of birth) in Fairmount
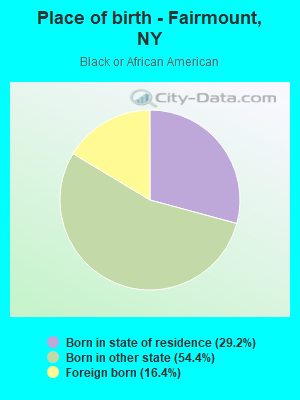
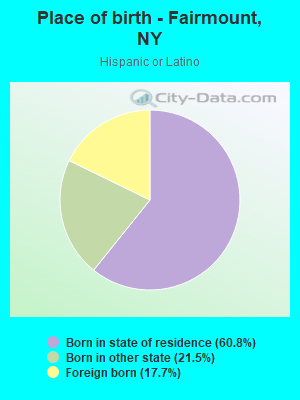
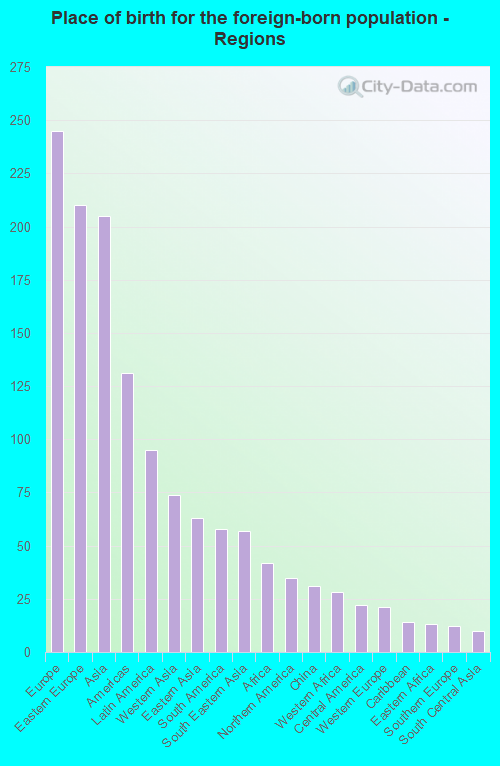
Place of birth for residents in Fairmount
![Place of birth for the foreign-born population - Regions]()
- 245Europe
- 210Eastern Europe
- 205Asia
- 131Americas
- 95Latin America
- 74Western Asia
- 63Eastern Asia
- 58South America
- 57South Eastern Asia
- 42Africa
- 35Northern America
- 31China
- 28Western Africa
- 22Central America
- 21Western Europe
- 14Caribbean
- 13Eastern Africa
- 12Southern Europe
- 10South Central Asia
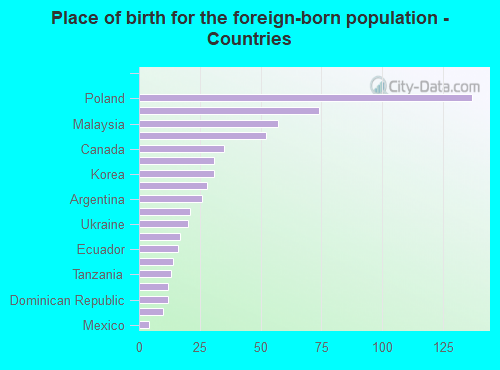
![Place of birth for the foreign-born population - Countries]()
- 137Poland
- 74Syria
- 57Malaysia
- 52Bosnia and Herzegovina
- 35Canada
- 31China
- 31Korea
- 28Sierra Leone
- 26Argentina
- 21Germany
- 20Ukraine
- 17Costa Rica
- 16Ecuador
- 14Brazil
- 13Tanzania
- 12Italy
- 12Dominican Republic
- 10India
- 4Mexico
- 1Jamaica