Races in Greenwood, South Carolina (SC) Detailed Stats
Data:
Races - White alone (%)
Races - White alone (% change since 2000)
Races - Black alone (%)
Races - Black alone (% change since 2000)
Races - American Indian alone (%)
Races - American Indian alone (% change since 2000)
Races - Asian alone (%)
Races - Asian alone (% change since 2000)
Races - Hispanic (%)
Races - Hispanic (% change since 2000)
Races - Native Hawaiian and Other Pacific Islander alone (%)
Races - Native Hawaiian and Other Pacific Islander alone (% change since 2000)
Races - Two or more races(%)
Races - Two or more races(% change since 2000)
Races - Other race alone (%)
Races - Other race alone (% change since 2000)
Racial diversity
Place of birth - Born in state of residence (%)
Place of birth - Born in state of residence (%) - White
Place of birth - Born in state of residence (%) - Black or African American
Place of birth - Born in state of residence (%) - Asian
Place of birth - Born in state of residence (%) - Hispanic or Latino
Place of birth - Born in state of residence (%) - American Indian and Alaska Native
Place of birth - Born in state of residence (%) - Multirace
Place of birth - Born in state of residence (%) - Other Race
Place of birth - Born in other state (%)
Place of birth - Born in other state (%) - White
Place of birth - Born in other state (%) - Black or African American
Place of birth - Born in other state (%) - Asian
Place of birth - Born in other state (%) - Hispanic or Latino
Place of birth - Born in other state (%) - American Indian and Alaska Native
Place of birth - Born in other state (%) - Multirace
Place of birth - Born in other state (%) - Other Race
Place of birth - Native, outside of US (%)
Place of birth - Native, outside of US (%) - White
Place of birth - Native, outside of US (%) - Black or African American
Place of birth - Native, outside of US (%) - Asian
Place of birth - Native, outside of US (%) - Hispanic or Latino
Place of birth - Native, outside of US (%) - American Indian and Alaska Native
Place of birth - Native, outside of US (%) - Multirace
Place of birth - Native, outside of US (%) - Other Race
Place of birth - Foreign born (%)
Place of birth - Foreign born (%) - White
Place of birth - Foreign born (%) - Black or African American
Place of birth - Foreign born (%) - Asian
Place of birth - Foreign born (%) - Hispanic or Latino
Place of birth - Foreign born (%) - American Indian and Alaska Native
Place of birth - Foreign born (%) - Multirace
Place of birth - Foreign born (%) - Other Race
Residents speaking English at home (%)
Residents speaking English at home - Born in the United States (%)
Residents speaking English at home - Native, born elsewhere (%)
Residents speaking English at home - Foreign born (%)
Residents speaking Spanish at home (%)
Residents speaking Spanish at home - Born in the United States (%)
Residents speaking Spanish at home - Native, born elsewhere (%)
Residents speaking Spanish at home - Foreign born (%)
Residents speaking other language at home (%)
Residents speaking other language at home - Born in the United States (%)
Residents speaking other language at home - Native, born elsewhere (%)
Residents speaking other language at home - Foreign born (%)
Marital status - Never married (%)
Marital status - Now married (%)
Marital status - Separated (%)
Marital status - Widowed (%)
Marital status - Divorced (%)
Ancestries Reported - Arab (%)
Ancestries Reported - Czech (%)
Ancestries Reported - Danish (%)
Ancestries Reported - Dutch (%)
Ancestries Reported - English (%)
Ancestries Reported - French (%)
Ancestries Reported - French Canadian (%)
Ancestries Reported - German (%)
Ancestries Reported - Greek (%)
Ancestries Reported - Hungarian (%)
Ancestries Reported - Irish (%)
Ancestries Reported - Italian (%)
Ancestries Reported - Lithuanian (%)
Ancestries Reported - Norwegian (%)
Ancestries Reported - Polish (%)
Ancestries Reported - Portuguese (%)
Ancestries Reported - Russian (%)
Ancestries Reported - Scotch-Irish (%)
Ancestries Reported - Scottish (%)
Ancestries Reported - Slovak (%)
Ancestries Reported - Subsaharan African (%)
Ancestries Reported - Swedish (%)
Ancestries Reported - Swiss (%)
Ancestries Reported - Ukrainian (%)
Ancestries Reported - United States (%)
Ancestries Reported - Welsh (%)
Ancestries Reported - West Indian (%)
Ancestries Reported - Other (%)
Geographical mobility - Same house 1 year ago (%)
Geographical mobility - Same house 1 year ago (%) - White
Geographical mobility - Same house 1 year ago (%) - Black or African American
Geographical mobility - Same house 1 year ago (%) - Asian
Geographical mobility - Same house 1 year ago (%) - Hispanic or Latino
Geographical mobility - Same house 1 year ago (%) - American Indian and Alaska Native
Geographical mobility - Same house 1 year ago (%) - Multirace
Geographical mobility - Same house 1 year ago (%) - Other Race
Geographical mobility - Moved within same county (%)
Geographical mobility - Moved within same county (%) - White
Geographical mobility - Moved within same county (%) - Black or African American
Geographical mobility - Moved within same county (%) - Asian
Geographical mobility - Moved within same county (%) - Hispanic or Latino
Geographical mobility - Moved within same county (%) - American Indian and Alaska Native
Geographical mobility - Moved within same county (%) - Multirace
Geographical mobility - Moved within same county (%) - Other Race
Geographical mobility - Moved from different county within same state (%)
Geographical mobility - Moved from different county within same state (%) - White
Geographical mobility - Moved from different county within same state (%) - Black or African American
Geographical mobility - Moved from different county within same state (%) - Asian
Geographical mobility - Moved from different county within same state (%) - Hispanic or Latino
Geographical mobility - Moved from different county within same state (%) - American Indian and Alaska Native
Geographical mobility - Moved from different county within same state (%) - Multirace
Geographical mobility - Moved from different county within same state (%) - Other Race
Geographical mobility - Moved from different state (%)
Geographical mobility - Moved from different state (%) - White
Geographical mobility - Moved from different state (%) - Black or African American
Geographical mobility - Moved from different state (%) - Asian
Geographical mobility - Moved from different state (%) - Hispanic or Latino
Geographical mobility - Moved from different state (%) - American Indian and Alaska Native
Geographical mobility - Moved from different state (%) - Multirace
Geographical mobility - Moved from different state (%) - Other Race
Geographical mobility - Moved from abroad (%)
Geographical mobility - Moved from abroad (%) - White
Geographical mobility - Moved from abroad (%) - Black or African American
Geographical mobility - Moved from abroad (%) - Asian
Geographical mobility - Moved from abroad (%) - Hispanic or Latino
Geographical mobility - Moved from abroad (%) - American Indian and Alaska Native
Geographical mobility - Moved from abroad (%) - Multirace
Geographical mobility - Moved from abroad (%) - Other Race
Place of birth for the foreign-born population - Ireland (%)
Place of birth for the foreign-born population - Denmark (%)
Place of birth for the foreign-born population - Norway (%)
Place of birth for the foreign-born population - Sweden (%)
Place of birth for the foreign-born population - United Kingdom (%)
Place of birth for the foreign-born population - England (%)
Place of birth for the foreign-born population - Scotland (%)
Place of birth for the foreign-born population - Other Northern Europe (%)
Place of birth for the foreign-born population - Austria (%)
Place of birth for the foreign-born population - Belgium (%)
Place of birth for the foreign-born population - France (%)
Place of birth for the foreign-born population - Germany (%)
Place of birth for the foreign-born population - Netherlands (%)
Place of birth for the foreign-born population - Switzerland (%)
Place of birth for the foreign-born population - Other Western Europe (%)
Place of birth for the foreign-born population - Greece (%)
Place of birth for the foreign-born population - Italy (%)
Place of birth for the foreign-born population - Portugal (%)
Place of birth for the foreign-born population - Spain (%)
Place of birth for the foreign-born population - Other Southern Europe (%)
Place of birth for the foreign-born population - Albania (%)
Place of birth for the foreign-born population - Belarus (%)
Place of birth for the foreign-born population - Bosnia and Herzegovina (%)
Place of birth for the foreign-born population - Bulgaria (%)
Place of birth for the foreign-born population - Croatia (%)
Place of birth for the foreign-born population - Czechoslovakia (%)
Place of birth for the foreign-born population - Hungary (%)
Place of birth for the foreign-born population - Latvia (%)
Place of birth for the foreign-born population - Lithuania (%)
Place of birth for the foreign-born population - North Macedonia (Macedonia) (%)
Place of birth for the foreign-born population - Moldova (%)
Place of birth for the foreign-born population - Poland (%)
Place of birth for the foreign-born population - Romania (%)
Place of birth for the foreign-born population - Russia (%)
Place of birth for the foreign-born population - Serbia (%)
Place of birth for the foreign-born population - Ukraine (%)
Place of birth for the foreign-born population - Other Eastern Europe (%)
Place of birth for the foreign-born population - China (%)
Place of birth for the foreign-born population - Hong Kong (%)
Place of birth for the foreign-born population - Taiwan (%)
Place of birth for the foreign-born population - Japan (%)
Place of birth for the foreign-born population - Korea (%)
Place of birth for the foreign-born population - Other Eastern Asia (%)
Place of birth for the foreign-born population - Afghanistan (%)
Place of birth for the foreign-born population - Bangladesh (%)
Place of birth for the foreign-born population - India (%)
Place of birth for the foreign-born population - Iran (%)
Place of birth for the foreign-born population - Kazakhstan (%)
Place of birth for the foreign-born population - Nepal (%)
Place of birth for the foreign-born population - Pakistan (%)
Place of birth for the foreign-born population - Sri Lanka (%)
Place of birth for the foreign-born population - Uzbekistan (%)
Place of birth for the foreign-born population - Other South Central Asia (%)
Place of birth for the foreign-born population - Burma (%)
Place of birth for the foreign-born population - Cambodia (%)
Place of birth for the foreign-born population - Indonesia (%)
Place of birth for the foreign-born population - Laos (%)
Place of birth for the foreign-born population - Malaysia (%)
Place of birth for the foreign-born population - Philippines (%)
Place of birth for the foreign-born population - Singapore (%)
Place of birth for the foreign-born population - Thailand (%)
Place of birth for the foreign-born population - Vietnam (%)
Place of birth for the foreign-born population - Other South Eastern Asia (%)
Place of birth for the foreign-born population - Armenia (%)
Place of birth for the foreign-born population - Iraq (%)
Place of birth for the foreign-born population - Israel (%)
Place of birth for the foreign-born population - Jordan (%)
Place of birth for the foreign-born population - Kuwait (%)
Place of birth for the foreign-born population - Lebanon (%)
Place of birth for the foreign-born population - Saudi Arabia (%)
Place of birth for the foreign-born population - Syria (%)
Place of birth for the foreign-born population - Turkey (%)
Place of birth for the foreign-born population - Yemen (%)
Place of birth for the foreign-born population - Other Western Asia (%)
Place of birth for the foreign-born population - Eritrea (%)
Place of birth for the foreign-born population - Ethiopia (%)
Place of birth for the foreign-born population - Kenya (%)
Place of birth for the foreign-born population - Somalia (%)
Place of birth for the foreign-born population - Uganda (%)
Place of birth for the foreign-born population - Zimbabwe (%)
Place of birth for the foreign-born population - Other Eastern Africa (%)
Place of birth for the foreign-born population - Cameroon (%)
Place of birth for the foreign-born population - Congo (%)
Place of birth for the foreign-born population - Democratic Republic of Congo (Zaire) (%)
Place of birth for the foreign-born population - Other Middle Africa (%)
Place of birth for the foreign-born population - Egypt (%)
Place of birth for the foreign-born population - Morocco (%)
Place of birth for the foreign-born population - Sudan (%)
Place of birth for the foreign-born population - Other Northern Africa (%)
Place of birth for the foreign-born population - South Africa (%)
Place of birth for the foreign-born population - Other Southern Africa (%)
Place of birth for the foreign-born population - Cabo Verde (%)
Place of birth for the foreign-born population - Ghana (%)
Place of birth for the foreign-born population - Liberia (%)
Place of birth for the foreign-born population - Nigeria (%)
Place of birth for the foreign-born population - Senegal (%)
Place of birth for the foreign-born population - Sierra Leone (%)
Place of birth for the foreign-born population - Other Western Africa (%)
Place of birth for the foreign-born population - Australia (%)
Place of birth for the foreign-born population - New Zealand (%)
Place of birth for the foreign-born population - Fiji (%)
Place of birth for the foreign-born population - Micronesia (%)
Place of birth for the foreign-born population - Bahamas (%)
Place of birth for the foreign-born population - Barbados (%)
Place of birth for the foreign-born population - Cuba (%)
Place of birth for the foreign-born population - Dominica (%)
Place of birth for the foreign-born population - Dominican Republic (%)
Place of birth for the foreign-born population - Grenada (%)
Place of birth for the foreign-born population - Haiti (%)
Place of birth for the foreign-born population - Jamaica (%)
Place of birth for the foreign-born population - St. Vincent and the Grenadines (%)
Place of birth for the foreign-born population - Trinidad and Tobago (%)
Place of birth for the foreign-born population - West Indies (%)
Place of birth for the foreign-born population - Other Caribbean (%)
Place of birth for the foreign-born population - Belize (%)
Place of birth for the foreign-born population - Costa Rica (%)
Place of birth for the foreign-born population - El Salvador (%)
Place of birth for the foreign-born population - Guatemala (%)
Place of birth for the foreign-born population - Honduras (%)
Place of birth for the foreign-born population - Mexico (%)
Place of birth for the foreign-born population - Nicaragua (%)
Place of birth for the foreign-born population - Panama (%)
Place of birth for the foreign-born population - Other Central America (%)
Place of birth for the foreign-born population - Argentina (%)
Place of birth for the foreign-born population - Bolivia (%)
Place of birth for the foreign-born population - Brazil (%)
Place of birth for the foreign-born population - Chile (%)
Place of birth for the foreign-born population - Colombia (%)
Place of birth for the foreign-born population - Ecuador (%)
Place of birth for the foreign-born population - Guyana (%)
Place of birth for the foreign-born population - Peru (%)
Place of birth for the foreign-born population - Uruguay (%)
Place of birth for the foreign-born population - Venezuela (%)
Place of birth for the foreign-born population - Other South America (%)
Place of birth for the foreign-born population - Canada (%)
Place of birth for the foreign-born population - Other Northern America (%)
Place of birth for the foreign-born population - Other (%)
Latest news about races in Greenwood, SC collected exclusively by city-data.com from local newspapers, TV, and radio stations
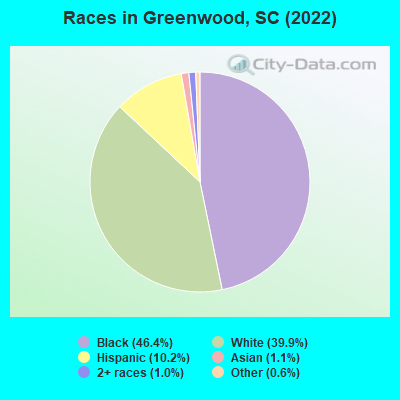
According to 2022 data, the most numerous races in Greenwood, SC are White alone (9,240 residents), Black alone (10,729 residents), and Hispanic (2,363 residents). 90.6% of Greenwood residents speak English at home. 4.8% of Greenwood, SC residents are foreign-born (3.4% born in Latin America, 0.7% born in Asia), which is 4.9% less than the foreign-born rate of 5.0% across the entire state of South Carolina.
Race distribution in Greenwood
2000 2022
2,652,291 66.1% White alone 1,178,486 29.4% Black alone 95,076 2.4% Hispanic 35,568 0.9% Asian alone 33,290 0.8% Two or more races 12,765 0.3% American Indian alone 3,266 0.08% Other race alone 1,270 0.03% Native Hawaiian and Other
3,301,739 62.5% White alone 1,313,290 24.9% Black alone 343,783 6.5% Hispanic 190,508 3.6% Two or more races 89,888 1.7% Asian alone 29,390 0.6% Other race alone 12,112 0.2% American Indian alone 1,924 0.04% Native Hawaiian and Other
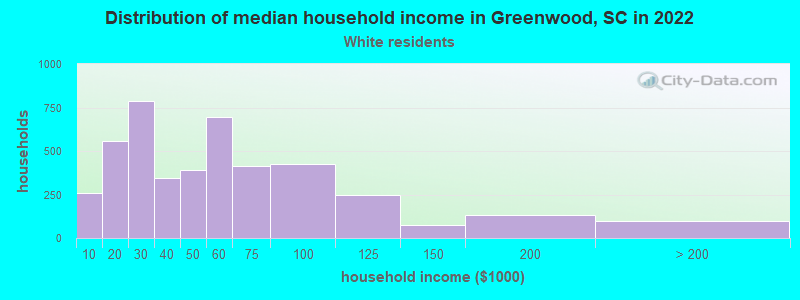
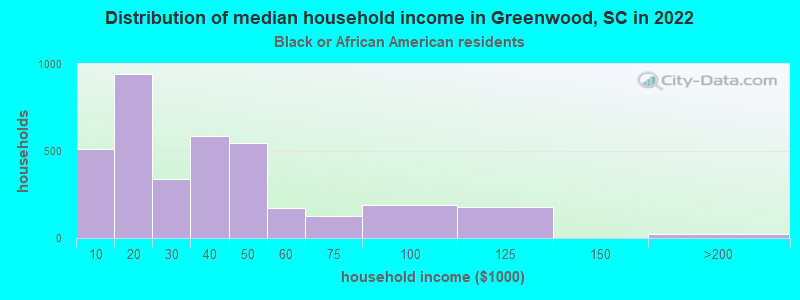
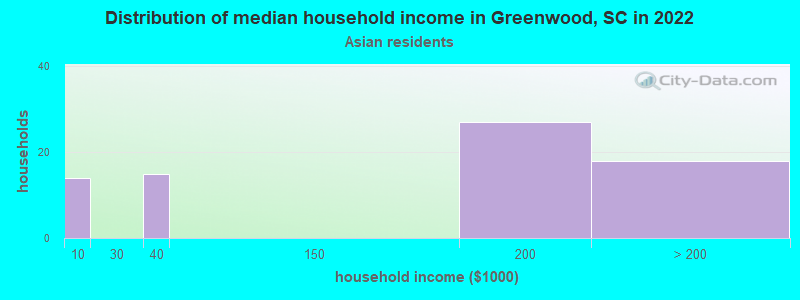
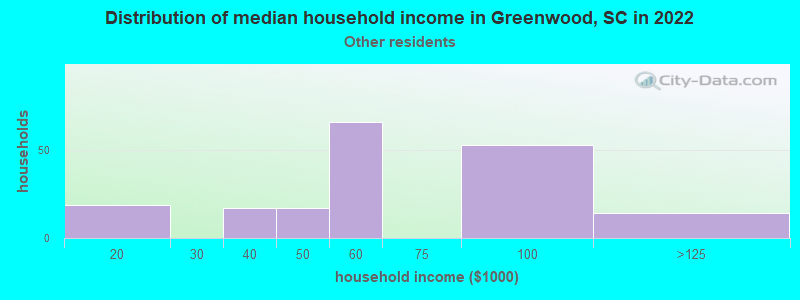
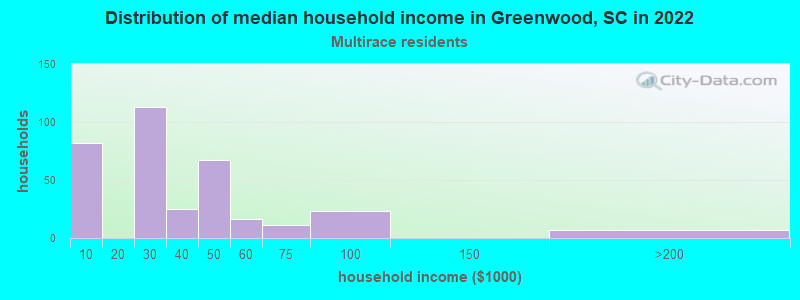
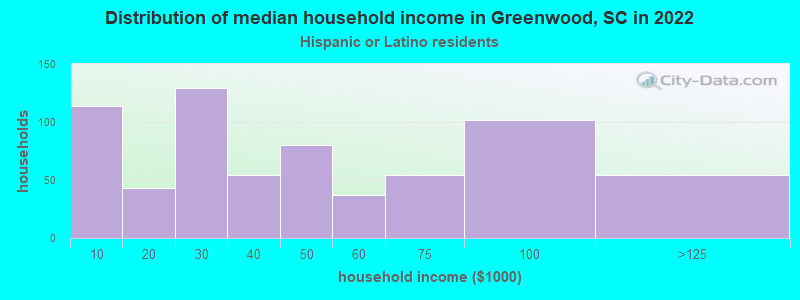
Income and house value in Greenwood Median household income in 2022 $45,200 White non-Hispanic householders$32,021 Black householders$61,581 Some other race householders$42,302 Hispanic or Latino race householdersMedian 2022 house value $138,196 White Non-Hispanic householders$97,780 Black or African American householders$131,305 American Indian or Alaska Native householders $302,654 Asian householders$195,561 Some other race householders$179,543 Two or more races householders$51,218 Hispanic or Latino householders
Median age by race in Greenwood
44.4 Median age for White residents42.9 45.9 27.8 Median age for Black or African American residents27.3 27.8 -626,702,996.6 Median age for American Indian / Alaska Native residents-583,333,332.8 -666,666,666.0 41.8 Median age for Asian residents-720,616,569.6 40.9 -666,666,666.0 Median age for Native Hawaiian / Pacific Islander residents-666,666,666.0 -666,666,666.0 36.2 Median age for Other race residents33.6 27.2 26.6 Median age for Two or more races residents27.6 17.7 46.1 Median age for White alone residents42.8 49.0 26.8 Median age for Hispanic or Latino residents26.9 26.7
Owner/renter occupied households by race in Greenwood
House owners and renters - White residents 2,842 66.9% Owner occupied1,403 33.1% Renter occupiedHouse owners and renters - Black or African American residents 990 31.2% Owner occupied2,181 68.8% Renter occupiedHouse owners and renters - Asian residents 14 15.1% Owner occupied80 84.9% Renter occupiedHouse owners and renters - Other race residents 89 46.4% Owner occupied102 53.6% Renter occupiedHouse owners and renters - Two or more races residents 161 50.3% Owner occupied160 49.7% Renter occupiedHouse owners and renters - White alone residents 2,792 71.5% Owner occupied1,112 28.5% Renter occupiedHouse owners and renters - Hispanic or Latino residents 301 34.8% Owner occupied565 65.2% Renter occupied
Language usage in Greenwood
English speakers - Total 90.6% of residents of Greenwood speak English at home.
8.7% of residents speak Spanish at home 1,267 67.3% Speak English very well615 32.7% Speak English less than very well0.6% of residents speak other language at home 88 69.3% Speak English very well39 30.7% Speak English less than very well
English speakers - Born in the United States 92.9% of residents of Greenwood speak English at home.
6.8% of residents speak Spanish at home 337 100.0% Speak English very well0.1% of residents speak other language at home 7 100.0% Speak English very well
English speakers - Native, born elsewhere 29.8% of residents of Greenwood speak English at home.
78.9% of residents speak Spanish at home 45 100.0% Speak English very well
English speakers - Foreign-born 21.7% of residents of Greenwood speak English at home.
66.8% of residents speak Spanish at home 147 20.5% Speak English very well571 79.5% Speak English less than very well6.9% of residents speak other language at home 36 48.6% Speak English very well38 51.4% Speak English less than very well
White (Caucasian) - Speak only English Native:
94.5% (8,626)Foreign-born:
23.9% (92)
White (Caucasian) - Speak another language Native:
4.8% (437)Foreign-born:
70.6% (272)
Black or African American - Speak only English Native:
99.5% (9,793)Foreign-born:
27.4% (9)
Black or African American - Speak another language Native:
0.3% (31)Foreign-born:
86.1% (30)
Asian - Speak only English Native:
95.1% (175)Foreign-born:
90.3% (72)
Other race - Speak only English Native:
30.6% (58)Foreign-born:
31.4% (73)
Other race - Speak another language Native:
66.5% (126)Foreign-born:
72.1% (168)
Two or more races - Speak another language Native:
65.5% (666)Foreign-born:
100.0% (357)
White alone - Speak only English Native:
99.0% (8,575)Foreign-born:
56.9% (50)
White alone - Speak another language Native:
1.0% (84)Foreign-born:
43.6% (38)
Hispanic or Latino - Speak only English Native:
25.7% (390)Foreign-born:
5.0% (38)
Hispanic or Latino - Speak another language Native:
70.8% (1,074)Foreign-born:
95.3% (736)
Foreign-born residents in Greenwood 1,073 residents are foreign born (3.4% Latin America , 0.7% Asia ).
This city:
4.8%South Carolina:
5.3%
Marital status for residents in Greenwood Marital status - White (Caucasian) population 15 years and over
Males 36.5% Never married43.0% Now married0.4% Separated4.8% Widowed15.3% DivorcedFemales 32.3% Never married32.0% Now married1.6% Separated22.8% Widowed11.3% DivorcedWomen who gave birth in the past 12 months Now married:
53.3% (71)Unmarried:
46.7% (62)
Women who did not give birth in the past 12 months Now married:
31.6% (742)Unmarried:
68.4% (1,607)
Marital status - Black or African American population 15 years and over
Males 66.1% Never married15.8% Now married4.6% Separated5.6% Widowed8.0% DivorcedFemales 68.1% Never married11.0% Now married4.8% Separated9.7% Widowed6.4% DivorcedWomen who gave birth in the past 12 months Now married:
0.0% (0)Unmarried:
100.0% (84)
Women who did not give birth in the past 12 months Now married:
11.3% (344)Unmarried:
88.7% (2,710)
Marital status - Asian population 15 years and over
Males 60.0% Never married0.0% Now married0.0% Separated0.0% Widowed40.0% DivorcedFemales 32.5% Never married52.8% Now married0.0% Separated0.0% Widowed14.6% DivorcedWomen who did not give birth in the past 12 months Now married:
52.8% (124)Unmarried:
47.2% (111)
Marital status - Other race population 15 years and over
Males 63.0% Never married37.0% Now married0.0% Separated0.0% Widowed0.0% DivorcedFemales 49.2% Never married50.8% Now married0.0% Separated0.0% Widowed0.0% DivorcedWomen who did not give birth in the past 12 months Now married:
37.8% (50)Unmarried:
62.2% (83)
Marital status - Two or more races population 15 years and over
Males 59.2% Never married31.1% Now married0.0% Separated1.5% Widowed8.2% DivorcedFemales 48.1% Never married51.9% Now married0.0% Separated0.0% Widowed0.0% DivorcedWomen who gave birth in the past 12 months Now married:
100.0% (13)Unmarried:
0.0% (0)
Women who did not give birth in the past 12 months Now married:
40.1% (90)Unmarried:
59.9% (134)
Marital status - White alone, not Hispanic / Latino population 15 years and over
Males 33.4% Never married43.7% Now married0.5% Separated5.3% Widowed17.1% DivorcedFemales 31.6% Never married30.9% Now married1.7% Separated23.9% Widowed12.0% DivorcedWomen who gave birth in the past 12 months Now married:
64.3% (71)Unmarried:
35.7% (39)
Women who did not give birth in the past 12 months Now married:
28.9% (616)Unmarried:
71.1% (1,511)
Marital status - Hispanic or Latino population 15 years and over
Males 58.1% Never married41.9% Now married0.0% Separated0.0% Widowed0.0% DivorcedFemales 45.9% Never married50.1% Now married0.0% Separated2.5% Widowed1.5% DivorcedWomen who gave birth in the past 12 months Now married:
30.3% (11)Unmarried:
69.7% (26)
Women who did not give birth in the past 12 months Now married:
49.6% (263)Unmarried:
50.4% (267)
Ancestries in Greenwood
1,026 11.6% African761 8.6% American616 7.0% English350 4.0% Irish304 3.4% German191 2.2% Scottish147 1.7% French116 1.3% Welsh114 1.3% Scotch-Irish75 0.8% European70 0.8% Italian39 0.4% Swedish28 0.3% British23 0.3% Estonian22 0.2% Norwegian19 0.2% Polish16 0.2% Czech14 0.2% Ukrainian11 0.1% French Canadian10 0.1% Carpatho Rusyn9 0.1% Zimbabwean8 0.09% West Indian7 0.08% Eastern European7 0.08% Hungarian7 0.08% Northern European6 0.07% Czechoslovakian6 0.07% Dutch
Geographical mobility in Greenwood Same house 1 year ago 7,624 78.4% White (Caucasian)9,569 92.9% Black or African American200 77.8% Asian382 88.0% Other race748 45.2% Two or more races7,052 78.5% White alone, not Hispanic / Latino1,960 86.0% Hispanic or LatinoMoved within same county 448 4.6% White / Caucasian486 4.7% Black or African American63 24.5% Asian16 3.6% Other race150 9.0% Two or more races430 4.8% White alone, not Hispanic / Latino55 2.4% Hispanic or LatinoMoved within same state 1,431 14.7% White / Caucasian599 5.8% Black or African American26 6.0% Other race76 4.6% Two or more races1,423 15.8% White alone, not Hispanic / Latino42 1.8% Hispanic or LatinoMoved from different state 768 7.9% White / Caucasian96 0.9% Black or African American183 11.0% Two or more races461 5.1% White alone, not Hispanic / Latino209 9.2% Hispanic or LatinoMoved from abroad 6 0.1% White6 0.1% White alone, not Hispanic / Latino
Children Nativity (place of birth) in Greenwood
Children under 6 years - Living with two parents Both parents native 294 100.0% NativeOne native, one foreign-born parent 66 100.0% NativeChildren under 6 years - Living with one parent Native parent 1,473 100.0% NativeForeign-born parent 40 100.0% NativeChildren 6 to 17 years - Living with two parents Both parents native 696 100.0% NativeBoth parents foreign-born 421 100.0% NativeChildren 6 to 17 years - Living with one parent Native parent 1,752 100.0% NativeForeign-born parent 119 49.6% Native121 50.4% Foreign-born
Grandparents responsible for own grandchildren in Greenwood
Grandparents (30 to 59 years) White / Caucasian 128 100.0% Responsible for grandchildrenBlack or African American 35 44.1% Responsible for grandchildren44 55.9% Not responsible for grandchildrenWhite alone, not Hispanic / Latino 130 100.0% Responsible for grandchildrenGrandparents (60 years and over) White / Caucasian 21 100.0% Not responsible for grandchildrenBlack or African American 25 45.9% Responsible for grandchildren30 54.1% Not responsible for grandchildrenWhite alone, not Hispanic / Latino 21 100.0% Not responsible for grandchildren