Estimated zip code population in 2022: 33,686
Zip code population in 2010: 34,072
Zip code population in 2000: 31,127
Houses and condos: 11,727
Renter-occupied apartments: 5,896
% of renters here:
52%State:
38%
March 2022 cost of living index in zip code 76014: 95.7
(near average, U.S. average is 100)
Land area: 5.8
sq. mi.
Water area: 0.0
sq. mi.
Population density: 5,846 people per square mile (average).
OSM Map
General Map
Google Map
MSN Map
OSM Map
General Map
Google Map
MSN Map
OSM Map
General Map
Google Map
MSN Map
OSM Map
General Map
Google Map
MSN Map
Please wait while loading the map...
Real estate property taxes paid for housing units in 2022:
This zip code:
1.4% ($3,096)Texas:
1.5% ($4,050)
Median real estate property taxes paid for housing units with mortgages in 2022: $3,302 (1.4%)
Median real estate property taxes paid for housing units with no mortgage in 2022: $2,868 (1.3%)
Profiles of local businesses
Business Search - 14 Million verified businesses
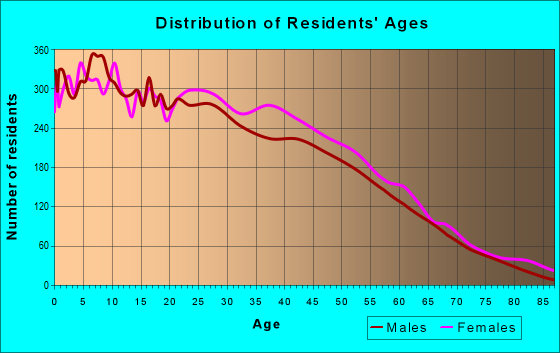
Males: 17,332 Females: 16,354
For population 25 years and over in 76014:
High school or higher: 76.0%Bachelor's degree or higher: 18.3%Graduate or professional degree: 4.6%Unemployed: 4.8%Mean travel time to work (commute): 25.5 minutes
For population 15 years and over in 76014:
Never married: 38.4%Now married: 46.2%Separated: 2.7%Widowed: 4.0%Divorced: 8.7%
Zip code 76014 compared to state average:
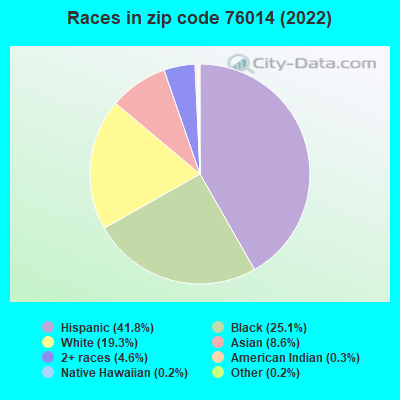
Black race population percentage above state average. Foreign-born population percentage above state average. Length of stay since moving in significantly above state average. Percentage of population with a bachelor's degree or higher below state average. 14,082 41.8% Hispanic or Latino 8,469 25.1% Black 6,485 19.3% White 2,891 8.6% Asian 1,535 4.6% Two or more races 95 0.3% American Indian 70 0.2% Native Hawaiian and Other 55 0.2% Some other race
Data:
Median household income ($)
Median household income (% change since 2000)
Household income diversity
Ratio of average income to average house value (%)
Ratio of average income to average rent
Median household income ($) - White
Median household income ($) - Black or African American
Median household income ($) - Asian
Median household income ($) - Hispanic or Latino
Median household income ($) - American Indian and Alaska Native
Median household income ($) - Multirace
Median household income ($) - Other Race
Median household income for houses/condos with a mortgage ($)
Median household income for apartments without a mortgage ($)
Races - White alone (%)
Races - White alone (% change since 2000)
Races - Black alone (%)
Races - Black alone (% change since 2000)
Races - American Indian alone (%)
Races - American Indian alone (% change since 2000)
Races - Asian alone (%)
Races - Asian alone (% change since 2000)
Races - Hispanic (%)
Races - Hispanic (% change since 2000)
Races - Native Hawaiian and Other Pacific Islander alone (%)
Races - Native Hawaiian and Other Pacific Islander alone (% change since 2000)
Races - Two or more races (%)
Races - Two or more races (% change since 2000)
Races - Other race alone (%)
Races - Other race alone (% change since 2000)
Racial diversity
Unemployment (%)
Unemployment (% change since 2000)
Unemployment (%) - White
Unemployment (%) - Black or African American
Unemployment (%) - Asian
Unemployment (%) - Hispanic or Latino
Unemployment (%) - American Indian and Alaska Native
Unemployment (%) - Multirace
Unemployment (%) - Other Race
Population density (people per square mile)
Population - Males (%)
Population - Females (%)
Population - Males (%) - White
Population - Males (%) - Black or African American
Population - Males (%) - Asian
Population - Males (%) - Hispanic or Latino
Population - Males (%) - American Indian and Alaska Native
Population - Males (%) - Multirace
Population - Males (%) - Other Race
Population - Females (%) - White
Population - Females (%) - Black or African American
Population - Females (%) - Asian
Population - Females (%) - Hispanic or Latino
Population - Females (%) - American Indian and Alaska Native
Population - Females (%) - Multirace
Population - Females (%) - Other Race
Coronavirus confirmed cases (Jun 13, 2024)
Deaths caused by coronavirus (Jun 13, 2024)
Coronavirus confirmed cases (per 100k population) (Jun 13, 2024)
Deaths caused by coronavirus (per 100k population) (Jun 13, 2024)
Daily increase in number of cases (Jun 13, 2024)
Weekly increase in number of cases (Jun 13, 2024)
Cases doubled (in days) (Jun 13, 2024)
Hospitalized patients (Apr 18, 2022)
Negative test results (Apr 18, 2022)
Total test results (Apr 18, 2022)
COVID Vaccine doses distributed (per 100k population) (Sep 19, 2023)
COVID Vaccine doses administered (per 100k population) (Sep 19, 2023)
COVID Vaccine doses distributed (Sep 19, 2023)
COVID Vaccine doses administered (Sep 19, 2023)
Likely homosexual households (%)
Likely homosexual households (% change since 2000)
Likely homosexual households - Lesbian couples (%)
Likely homosexual households - Lesbian couples (% change since 2000)
Likely homosexual households - Gay men (%)
Likely homosexual households - Gay men (% change since 2000)
Cost of living index
Median gross rent ($)
Median contract rent ($)
Median monthly housing costs ($)
Median house or condo value ($)
Median house or condo value ($ change since 2000)
Mean house or condo value by units in structure - 1, detached ($)
Mean house or condo value by units in structure - 1, attached ($)
Mean house or condo value by units in structure - 2 ($)
Mean house or condo value by units in structure by units in structure - 3 or 4 ($)
Mean house or condo value by units in structure - 5 or more ($)
Mean house or condo value by units in structure - Boat, RV, van, etc. ($)
Mean house or condo value by units in structure - Mobile home ($)
Median house or condo value ($) - White
Median house or condo value ($) - Black or African American
Median house or condo value ($) - Asian
Median house or condo value ($) - Hispanic or Latino
Median house or condo value ($) - American Indian and Alaska Native
Median house or condo value ($) - Multirace
Median house or condo value ($) - Other Race
Median resident age
Resident age diversity
Median resident age - Males
Median resident age - Females
Median resident age - White
Median resident age - Black or African American
Median resident age - Asian
Median resident age - Hispanic or Latino
Median resident age - American Indian and Alaska Native
Median resident age - Multirace
Median resident age - Other Race
Median resident age - Males - White
Median resident age - Males - Black or African American
Median resident age - Males - Asian
Median resident age - Males - Hispanic or Latino
Median resident age - Males - American Indian and Alaska Native
Median resident age - Males - Multirace
Median resident age - Males - Other Race
Median resident age - Females - White
Median resident age - Females - Black or African American
Median resident age - Females - Asian
Median resident age - Females - Hispanic or Latino
Median resident age - Females - American Indian and Alaska Native
Median resident age - Females - Multirace
Median resident age - Females - Other Race
Commute - mean travel time to work (minutes)
Travel time to work - Less than 5 minutes (%)
Travel time to work - Less than 5 minutes (% change since 2000)
Travel time to work - 5 to 9 minutes (%)
Travel time to work - 5 to 9 minutes (% change since 2000)
Travel time to work - 10 to 19 minutes (%)
Travel time to work - 10 to 19 minutes (% change since 2000)
Travel time to work - 20 to 29 minutes (%)
Travel time to work - 20 to 29 minutes (% change since 2000)
Travel time to work - 30 to 39 minutes (%)
Travel time to work - 30 to 39 minutes (% change since 2000)
Travel time to work - 40 to 59 minutes (%)
Travel time to work - 40 to 59 minutes (% change since 2000)
Travel time to work - 60 to 89 minutes (%)
Travel time to work - 60 to 89 minutes (% change since 2000)
Travel time to work - 90 or more minutes (%)
Travel time to work - 90 or more minutes (% change since 2000)
Marital status - Never married (%)
Marital status - Now married (%)
Marital status - Separated (%)
Marital status - Widowed (%)
Marital status - Divorced (%)
Median family income ($)
Median family income (% change since 2000)
Median non-family income ($)
Median non-family income (% change since 2000)
Median per capita income ($)
Median per capita income (% change since 2000)
Median family income ($) - White
Median family income ($) - Black or African American
Median family income ($) - Asian
Median family income ($) - Hispanic or Latino
Median family income ($) - American Indian and Alaska Native
Median family income ($) - Multirace
Median family income ($) - Other Race
Median year house/condo built
Median year apartment built
Year house built - Built 2005 or later (%)
Year house built - Built 2000 to 2004 (%)
Year house built - Built 1990 to 1999 (%)
Year house built - Built 1980 to 1989 (%)
Year house built - Built 1970 to 1979 (%)
Year house built - Built 1960 to 1969 (%)
Year house built - Built 1950 to 1959 (%)
Year house built - Built 1940 to 1949 (%)
Year house built - Built 1939 or earlier (%)
Average household size
Household density (households per square mile)
Average household size - White
Average household size - Black or African American
Average household size - Asian
Average household size - Hispanic or Latino
Average household size - American Indian and Alaska Native
Average household size - Multirace
Average household size - Other Race
Occupied housing units (%)
Vacant housing units (%)
Owner occupied housing units (%)
Renter occupied housing units (%)
Vacancy status - For rent (%)
Vacancy status - For sale only (%)
Vacancy status - Rented or sold, not occupied (%)
Vacancy status - For seasonal, recreational, or occasional use (%)
Vacancy status - For migrant workers (%)
Vacancy status - Other vacant (%)
Residents with income below the poverty level (%)
Residents with income below 50% of the poverty level (%)
Children below poverty level (%)
Poor families by family type - Married-couple family (%)
Poor families by family type - Male, no wife present (%)
Poor families by family type - Female, no husband present (%)
Poverty status for native-born residents (%)
Poverty status for foreign-born residents (%)
Poverty among high school graduates not in families (%)
Poverty among people who did not graduate high school not in families (%)
Residents with income below the poverty level (%) - White
Residents with income below the poverty level (%) - Black or African American
Residents with income below the poverty level (%) - Asian
Residents with income below the poverty level (%) - Hispanic or Latino
Residents with income below the poverty level (%) - American Indian and Alaska Native
Residents with income below the poverty level (%) - Multirace
Residents with income below the poverty level (%) - Other Race
Air pollution - Air Quality Index (AQI)
Air pollution - CO
Air pollution - NO2
Air pollution - SO2
Air pollution - Ozone
Air pollution - PM10
Air pollution - PM25
Air pollution - Pb
Crime - Murders per 100,000 population
Crime - Rapes per 100,000 population
Crime - Robberies per 100,000 population
Crime - Assaults per 100,000 population
Crime - Burglaries per 100,000 population
Crime - Thefts per 100,000 population
Crime - Auto thefts per 100,000 population
Crime - Arson per 100,000 population
Crime - City-data.com crime index
Crime - Violent crime index
Crime - Property crime index
Crime - Murders per 100,000 population (5 year average)
Crime - Rapes per 100,000 population (5 year average)
Crime - Robberies per 100,000 population (5 year average)
Crime - Assaults per 100,000 population (5 year average)
Crime - Burglaries per 100,000 population (5 year average)
Crime - Thefts per 100,000 population (5 year average)
Crime - Auto thefts per 100,000 population (5 year average)
Crime - Arson per 100,000 population (5 year average)
Crime - City-data.com crime index (5 year average)
Crime - Violent crime index (5 year average)
Crime - Property crime index (5 year average)
1996 Presidential Elections Results (%) - Democratic Party (Clinton)
1996 Presidential Elections Results (%) - Republican Party (Dole)
1996 Presidential Elections Results (%) - Other
2000 Presidential Elections Results (%) - Democratic Party (Gore)
2000 Presidential Elections Results (%) - Republican Party (Bush)
2000 Presidential Elections Results (%) - Other
2004 Presidential Elections Results (%) - Democratic Party (Kerry)
2004 Presidential Elections Results (%) - Republican Party (Bush)
2004 Presidential Elections Results (%) - Other
2008 Presidential Elections Results (%) - Democratic Party (Obama)
2008 Presidential Elections Results (%) - Republican Party (McCain)
2008 Presidential Elections Results (%) - Other
2012 Presidential Elections Results (%) - Democratic Party (Obama)
2012 Presidential Elections Results (%) - Republican Party (Romney)
2012 Presidential Elections Results (%) - Other
2016 Presidential Elections Results (%) - Democratic Party (Clinton)
2016 Presidential Elections Results (%) - Republican Party (Trump)
2016 Presidential Elections Results (%) - Other
2020 Presidential Elections Results (%) - Democratic Party (Biden)
2020 Presidential Elections Results (%) - Republican Party (Trump)
2020 Presidential Elections Results (%) - Other
Ancestries Reported - Arab (%)
Ancestries Reported - Czech (%)
Ancestries Reported - Danish (%)
Ancestries Reported - Dutch (%)
Ancestries Reported - English (%)
Ancestries Reported - French (%)
Ancestries Reported - French Canadian (%)
Ancestries Reported - German (%)
Ancestries Reported - Greek (%)
Ancestries Reported - Hungarian (%)
Ancestries Reported - Irish (%)
Ancestries Reported - Italian (%)
Ancestries Reported - Lithuanian (%)
Ancestries Reported - Norwegian (%)
Ancestries Reported - Polish (%)
Ancestries Reported - Portuguese (%)
Ancestries Reported - Russian (%)
Ancestries Reported - Scotch-Irish (%)
Ancestries Reported - Scottish (%)
Ancestries Reported - Slovak (%)
Ancestries Reported - Subsaharan African (%)
Ancestries Reported - Swedish (%)
Ancestries Reported - Swiss (%)
Ancestries Reported - Ukrainian (%)
Ancestries Reported - United States (%)
Ancestries Reported - Welsh (%)
Ancestries Reported - West Indian (%)
Ancestries Reported - Other (%)
Educational Attainment - No schooling completed (%)
Educational Attainment - Less than high school (%)
Educational Attainment - High school or equivalent (%)
Educational Attainment - Less than 1 year of college (%)
Educational Attainment - 1 or more years of college (%)
Educational Attainment - Associate degree (%)
Educational Attainment - Bachelor's degree (%)
Educational Attainment - Master's degree (%)
Educational Attainment - Professional school degree (%)
Educational Attainment - Doctorate degree (%)
School Enrollment - Nursery, preschool (%)
School Enrollment - Kindergarten (%)
School Enrollment - Grade 1 to 4 (%)
School Enrollment - Grade 5 to 8 (%)
School Enrollment - Grade 9 to 12 (%)
School Enrollment - College undergrad (%)
School Enrollment - Graduate or professional (%)
School Enrollment - Not enrolled in school (%)
School enrollment - Public schools (%)
School enrollment - Private schools (%)
School enrollment - Not enrolled (%)
Median number of rooms in houses and condos
Median number of rooms in apartments
Housing units lacking complete plumbing facilities (%)
Housing units lacking complete kitchen facilities (%)
Density of houses
Urban houses (%)
Rural houses (%)
Households with people 60 years and over (%)
Households with people 65 years and over (%)
Households with people 75 years and over (%)
Households with one or more nonrelatives (%)
Households with no nonrelatives (%)
Population in households (%)
Family households (%)
Nonfamily households (%)
Population in families (%)
Family households with own children (%)
Median number of bedrooms in owner occupied houses
Mean number of bedrooms in owner occupied houses
Median number of bedrooms in renter occupied houses
Mean number of bedrooms in renter occupied houses
Median number of vehichles in owner occupied houses
Mean number of vehichles in owner occupied houses
Median number of vehichles in renter occupied houses
Mean number of vehichles in renter occupied houses
Mortgage status - with mortgage (%)
Mortgage status - with second mortgage (%)
Mortgage status - with home equity loan (%)
Mortgage status - with both second mortgage and home equity loan (%)
Mortgage status - without a mortgage (%)
Average family size
Average family size - White
Average family size - Black or African American
Average family size - Asian
Average family size - Hispanic or Latino
Average family size - American Indian and Alaska Native
Average family size - Multirace
Average family size - Other Race
Geographical mobility - Same house 1 year ago (%)
Geographical mobility - Moved within same county (%)
Geographical mobility - Moved from different county within same state (%)
Geographical mobility - Moved from different state (%)
Geographical mobility - Moved from abroad (%)
Place of birth - Born in state of residence (%)
Place of birth - Born in other state (%)
Place of birth - Native, outside of US (%)
Place of birth - Foreign born (%)
Housing units in structures - 1, detached (%)
Housing units in structures - 1, attached (%)
Housing units in structures - 2 (%)
Housing units in structures - 3 or 4 (%)
Housing units in structures - 5 to 9 (%)
Housing units in structures - 10 to 19 (%)
Housing units in structures - 20 to 49 (%)
Housing units in structures - 50 or more (%)
Housing units in structures - Mobile home (%)
Housing units in structures - Boat, RV, van, etc. (%)
House/condo owner moved in on average (years ago)
Renter moved in on average (years ago)
Year householder moved into unit - Moved in 1999 to March 2000 (%)
Year householder moved into unit - Moved in 1995 to 1998 (%)
Year householder moved into unit - Moved in 1990 to 1994 (%)
Year householder moved into unit - Moved in 1980 to 1989 (%)
Year householder moved into unit - Moved in 1970 to 1979 (%)
Year householder moved into unit - Moved in 1969 or earlier (%)
Means of transportation to work - Drove car alone (%)
Means of transportation to work - Carpooled (%)
Means of transportation to work - Public transportation (%)
Means of transportation to work - Bus or trolley bus (%)
Means of transportation to work - Streetcar or trolley car (%)
Means of transportation to work - Subway or elevated (%)
Means of transportation to work - Railroad (%)
Means of transportation to work - Ferryboat (%)
Means of transportation to work - Taxicab (%)
Means of transportation to work - Motorcycle (%)
Means of transportation to work - Bicycle (%)
Means of transportation to work - Walked (%)
Means of transportation to work - Other means (%)
Working at home (%)
Industry diversity
Most Common Industries - Agriculture, forestry, fishing and hunting, and mining (%)
Most Common Industries - Agriculture, forestry, fishing and hunting (%)
Most Common Industries - Mining, quarrying, and oil and gas extraction (%)
Most Common Industries - Construction (%)
Most Common Industries - Manufacturing (%)
Most Common Industries - Wholesale trade (%)
Most Common Industries - Retail trade (%)
Most Common Industries - Transportation and warehousing, and utilities (%)
Most Common Industries - Transportation and warehousing (%)
Most Common Industries - Utilities (%)
Most Common Industries - Information (%)
Most Common Industries - Finance and insurance, and real estate and rental and leasing (%)
Most Common Industries - Finance and insurance (%)
Most Common Industries - Real estate and rental and leasing (%)
Most Common Industries - Professional, scientific, and management, and administrative and waste management services (%)
Most Common Industries - Professional, scientific, and technical services (%)
Most Common Industries - Management of companies and enterprises (%)
Most Common Industries - Administrative and support and waste management services (%)
Most Common Industries - Educational services, and health care and social assistance (%)
Most Common Industries - Educational services (%)
Most Common Industries - Health care and social assistance (%)
Most Common Industries - Arts, entertainment, and recreation, and accommodation and food services (%)
Most Common Industries - Arts, entertainment, and recreation (%)
Most Common Industries - Accommodation and food services (%)
Most Common Industries - Other services, except public administration (%)
Most Common Industries - Public administration (%)
Occupation diversity
Most Common Occupations - Management, business, science, and arts occupations (%)
Most Common Occupations - Management, business, and financial occupations (%)
Most Common Occupations - Management occupations (%)
Most Common Occupations - Business and financial operations occupations (%)
Most Common Occupations - Computer, engineering, and science occupations (%)
Most Common Occupations - Computer and mathematical occupations (%)
Most Common Occupations - Architecture and engineering occupations (%)
Most Common Occupations - Life, physical, and social science occupations (%)
Most Common Occupations - Education, legal, community service, arts, and media occupations (%)
Most Common Occupations - Community and social service occupations (%)
Most Common Occupations - Legal occupations (%)
Most Common Occupations - Education, training, and library occupations (%)
Most Common Occupations - Arts, design, entertainment, sports, and media occupations (%)
Most Common Occupations - Healthcare practitioners and technical occupations (%)
Most Common Occupations - Health diagnosing and treating practitioners and other technical occupations (%)
Most Common Occupations - Health technologists and technicians (%)
Most Common Occupations - Service occupations (%)
Most Common Occupations - Healthcare support occupations (%)
Most Common Occupations - Protective service occupations (%)
Most Common Occupations - Fire fighting and prevention, and other protective service workers including supervisors (%)
Most Common Occupations - Law enforcement workers including supervisors (%)
Most Common Occupations - Food preparation and serving related occupations (%)
Most Common Occupations - Building and grounds cleaning and maintenance occupations (%)
Most Common Occupations - Personal care and service occupations (%)
Most Common Occupations - Sales and office occupations (%)
Most Common Occupations - Sales and related occupations (%)
Most Common Occupations - Office and administrative support occupations (%)
Most Common Occupations - Natural resources, construction, and maintenance occupations (%)
Most Common Occupations - Farming, fishing, and forestry occupations (%)
Most Common Occupations - Construction and extraction occupations (%)
Most Common Occupations - Installation, maintenance, and repair occupations (%)
Most Common Occupations - Production, transportation, and material moving occupations (%)
Most Common Occupations - Production occupations (%)
Most Common Occupations - Transportation occupations (%)
Most Common Occupations - Material moving occupations (%)
People in Group quarters - Institutionalized population (%)
People in Group quarters - Correctional institutions (%)
People in Group quarters - Federal prisons and detention centers (%)
People in Group quarters - Halfway houses (%)
People in Group quarters - Local jails and other confinement facilities (including police lockups) (%)
People in Group quarters - Military disciplinary barracks (%)
People in Group quarters - State prisons (%)
People in Group quarters - Other types of correctional institutions (%)
People in Group quarters - Nursing homes (%)
People in Group quarters - Hospitals/wards, hospices, and schools for the handicapped (%)
People in Group quarters - Hospitals/wards and hospices for chronically ill (%)
People in Group quarters - Hospices or homes for chronically ill (%)
People in Group quarters - Military hospitals or wards for chronically ill (%)
People in Group quarters - Other hospitals or wards for chronically ill (%)
People in Group quarters - Hospitals or wards for drug/alcohol abuse (%)
People in Group quarters - Mental (Psychiatric) hospitals or wards (%)
People in Group quarters - Schools, hospitals, or wards for the mentally retarded (%)
People in Group quarters - Schools, hospitals, or wards for the physically handicapped (%)
People in Group quarters - Institutions for the deaf (%)
People in Group quarters - Institutions for the blind (%)
People in Group quarters - Orthopedic wards and institutions for the physically handicapped (%)
People in Group quarters - Wards in general hospitals for patients who have no usual home elsewhere (%)
People in Group quarters - Wards in military hospitals for patients who have no usual home elsewhere (%)
People in Group quarters - Juvenile institutions (%)
People in Group quarters - Long-term care (%)
People in Group quarters - Homes for abused, dependent, and neglected children (%)
People in Group quarters - Residential treatment centers for emotionally disturbed children (%)
People in Group quarters - Training schools for juvenile delinquents (%)
People in Group quarters - Short-term care, detention or diagnostic centers for delinquent children (%)
People in Group quarters - Type of juvenile institution unknown (%)
People in Group quarters - Noninstitutionalized population (%)
People in Group quarters - College dormitories (includes college quarters off campus) (%)
People in Group quarters - Military quarters (%)
People in Group quarters - On base (%)
People in Group quarters - Barracks, unaccompanied personnel housing (UPH), (Enlisted/Officer), ;and similar group living quarters for military personnel (%)
People in Group quarters - Transient quarters for temporary residents (%)
People in Group quarters - Military ships (%)
People in Group quarters - Group homes (%)
People in Group quarters - Homes or halfway houses for drug/alcohol abuse (%)
People in Group quarters - Homes for the mentally ill (%)
People in Group quarters - Homes for the mentally retarded (%)
People in Group quarters - Homes for the physically handicapped (%)
People in Group quarters - Other group homes (%)
People in Group quarters - Religious group quarters (%)
People in Group quarters - Dormitories (%)
People in Group quarters - Agriculture workers' dormitories on farms (%)
People in Group quarters - Job Corps and vocational training facilities (%)
People in Group quarters - Other workers' dormitories (%)
People in Group quarters - Crews of maritime vessels (%)
People in Group quarters - Other nonhousehold living situations (%)
People in Group quarters - Other noninstitutional group quarters (%)
Residents speaking English at home (%)
Residents speaking English at home - Born in the United States (%)
Residents speaking English at home - Native, born elsewhere (%)
Residents speaking English at home - Foreign born (%)
Residents speaking Spanish at home (%)
Residents speaking Spanish at home - Born in the United States (%)
Residents speaking Spanish at home - Native, born elsewhere (%)
Residents speaking Spanish at home - Foreign born (%)
Residents speaking other language at home (%)
Residents speaking other language at home - Born in the United States (%)
Residents speaking other language at home - Native, born elsewhere (%)
Residents speaking other language at home - Foreign born (%)
Class of Workers - Employee of private company (%)
Class of Workers - Self-employed in own incorporated business (%)
Class of Workers - Private not-for-profit wage and salary workers (%)
Class of Workers - Local government workers (%)
Class of Workers - State government workers (%)
Class of Workers - Federal government workers (%)
Class of Workers - Self-employed workers in own not incorporated business and Unpaid family workers (%)
House heating fuel used in houses and condos - Utility gas (%)
House heating fuel used in houses and condos - Bottled, tank, or LP gas (%)
House heating fuel used in houses and condos - Electricity (%)
House heating fuel used in houses and condos - Fuel oil, kerosene, etc. (%)
House heating fuel used in houses and condos - Coal or coke (%)
House heating fuel used in houses and condos - Wood (%)
House heating fuel used in houses and condos - Solar energy (%)
House heating fuel used in houses and condos - Other fuel (%)
House heating fuel used in houses and condos - No fuel used (%)
House heating fuel used in apartments - Utility gas (%)
House heating fuel used in apartments - Bottled, tank, or LP gas (%)
House heating fuel used in apartments - Electricity (%)
House heating fuel used in apartments - Fuel oil, kerosene, etc. (%)
House heating fuel used in apartments - Coal or coke (%)
House heating fuel used in apartments - Wood (%)
House heating fuel used in apartments - Solar energy (%)
House heating fuel used in apartments - Other fuel (%)
House heating fuel used in apartments - No fuel used (%)
Armed forces status - In Armed Forces (%)
Armed forces status - Civilian (%)
Armed forces status - Civilian - Veteran (%)
Armed forces status - Civilian - Nonveteran (%)
Fatal accidents locations in years 2005-2021
Fatal accidents locations in 2005
Fatal accidents locations in 2006
Fatal accidents locations in 2007
Fatal accidents locations in 2008
Fatal accidents locations in 2009
Fatal accidents locations in 2010
Fatal accidents locations in 2011
Fatal accidents locations in 2012
Fatal accidents locations in 2013
Fatal accidents locations in 2014
Fatal accidents locations in 2015
Fatal accidents locations in 2016
Fatal accidents locations in 2017
Fatal accidents locations in 2018
Fatal accidents locations in 2019
Fatal accidents locations in 2020
Fatal accidents locations in 2021
Alcohol use - People drinking some alcohol every month (%)
Alcohol use - People not drinking at all (%)
Alcohol use - Average days/month drinking alcohol
Alcohol use - Average drinks/week
Alcohol use - Average days/year people drink much
Audiometry - Average condition of hearing (%)
Audiometry - People that can hear a whisper from across a quiet room (%)
Audiometry - People that can hear normal voice from across a quiet room (%)
Audiometry - Ears ringing, roaring, buzzing (%)
Audiometry - Had a job exposure to loud noise (%)
Audiometry - Had off-work exposure to loud noise (%)
Blood Pressure & Cholesterol - Has high blood pressure (%)
Blood Pressure & Cholesterol - Checking blood pressure at home (%)
Blood Pressure & Cholesterol - Frequently checking blood cholesterol (%)
Blood Pressure & Cholesterol - Has high cholesterol level (%)
Consumer Behavior - Money monthly spent on food at supermarket/grocery store
Consumer Behavior - Money monthly spent on food at other stores
Consumer Behavior - Money monthly spent on eating out
Consumer Behavior - Money monthly spent on carryout/delivered foods
Consumer Behavior - Income spent on food at supermarket/grocery store (%)
Consumer Behavior - Income spent on food at other stores (%)
Consumer Behavior - Income spent on eating out (%)
Consumer Behavior - Income spent on carryout/delivered foods (%)
Current Health Status - General health condition (%)
Current Health Status - Blood donors (%)
Current Health Status - Has blood ever tested for HIV virus (%)
Current Health Status - Left-handed people (%)
Dermatology - People using sunscreen (%)
Diabetes - Diabetics (%)
Diabetes - Had a blood test for high blood sugar (%)
Diabetes - People taking insulin (%)
Diet Behavior & Nutrition - Diet health (%)
Diet Behavior & Nutrition - Milk product consumption (# of products/month)
Diet Behavior & Nutrition - Meals not home prepared (#/week)
Diet Behavior & Nutrition - Meals from fast food or pizza place (#/week)
Diet Behavior & Nutrition - Ready-to-eat foods (#/month)
Diet Behavior & Nutrition - Frozen meals/pizza (#/month)
Drug Use - People that ever used marijuana or hashish (%)
Drug Use - Ever used hard drugs (%)
Drug Use - Ever used any form of cocaine (%)
Drug Use - Ever used heroin (%)
Drug Use - Ever used methamphetamine (%)
Health Insurance - People covered by health insurance (%)
Kidney Conditions-Urology - Avg. # of times urinating at night
Medical Conditions - People with asthma (%)
Medical Conditions - People with anemia (%)
Medical Conditions - People with psoriasis (%)
Medical Conditions - People with overweight (%)
Medical Conditions - Elderly people having difficulties in thinking or remembering (%)
Medical Conditions - People who ever received blood transfusion (%)
Medical Conditions - People having trouble seeing even with glass/contacts (%)
Medical Conditions - People with arthritis (%)
Medical Conditions - People with gout (%)
Medical Conditions - People with congestive heart failure (%)
Medical Conditions - People with coronary heart disease (%)
Medical Conditions - People with angina pectoris (%)
Medical Conditions - People who ever had heart attack (%)
Medical Conditions - People who ever had stroke (%)
Medical Conditions - People with emphysema (%)
Medical Conditions - People with thyroid problem (%)
Medical Conditions - People with chronic bronchitis (%)
Medical Conditions - People with any liver condition (%)
Medical Conditions - People who ever had cancer or malignancy (%)
Mental Health - People who have little interest in doing things (%)
Mental Health - People feeling down, depressed, or hopeless (%)
Mental Health - People who have trouble sleeping or sleeping too much (%)
Mental Health - People feeling tired or having little energy (%)
Mental Health - People with poor appetite or overeating (%)
Mental Health - People feeling bad about themself (%)
Mental Health - People who have trouble concentrating on things (%)
Mental Health - People moving or speaking slowly or too fast (%)
Mental Health - People having thoughts they would be better off dead (%)
Oral Health - Average years since last visit a dentist
Oral Health - People embarrassed because of mouth (%)
Oral Health - People with gum disease (%)
Oral Health - General health of teeth and gums (%)
Oral Health - Average days a week using dental floss/device
Oral Health - Average days a week using mouthwash for dental problem
Oral Health - Average number of teeth
Pesticide Use - Households using pesticides to control insects (%)
Pesticide Use - Households using pesticides to kill weeds (%)
Physical Activity - People doing vigorous-intensity work activities (%)
Physical Activity - People doing moderate-intensity work activities (%)
Physical Activity - People walking or bicycling (%)
Physical Activity - People doing vigorous-intensity recreational activities (%)
Physical Activity - People doing moderate-intensity recreational activities (%)
Physical Activity - Average hours a day doing sedentary activities
Physical Activity - Average hours a day watching TV or videos
Physical Activity - Average hours a day using computer
Physical Functioning - People having limitations keeping them from working (%)
Physical Functioning - People limited in amount of work they can do (%)
Physical Functioning - People that need special equipment to walk (%)
Physical Functioning - People experiencing confusion/memory problems (%)
Physical Functioning - People requiring special healthcare equipment (%)
Prescription Medications - Average number of prescription medicines taking
Preventive Aspirin Use - Adults 40+ taking low-dose aspirin (%)
Reproductive Health - Vaginal deliveries (%)
Reproductive Health - Cesarean deliveries (%)
Reproductive Health - Deliveries resulted in a live birth (%)
Reproductive Health - Pregnancies resulted in a delivery (%)
Reproductive Health - Women breastfeeding newborns (%)
Reproductive Health - Women that had a hysterectomy (%)
Reproductive Health - Women that had both ovaries removed (%)
Reproductive Health - Women that have ever taken birth control pills (%)
Reproductive Health - Women taking birth control pills (%)
Reproductive Health - Women that have ever used Depo-Provera or injectables (%)
Reproductive Health - Women that have ever used female hormones (%)
Sexual Behavior - People 18+ that ever had sex (vaginal, anal, or oral) (%)
Sexual Behavior - Males 18+ that ever had vaginal sex with a woman (%)
Sexual Behavior - Males 18+ that ever performed oral sex on a woman (%)
Sexual Behavior - Males 18+ that ever had anal sex with a woman (%)
Sexual Behavior - Males 18+ that ever had any sex with a man (%)
Sexual Behavior - Females 18+ that ever had vaginal sex with a man (%)
Sexual Behavior - Females 18+ that ever performed oral sex on a man (%)
Sexual Behavior - Females 18+ that ever had anal sex with a man (%)
Sexual Behavior - Females 18+ that ever had any kind of sex with a woman (%)
Sexual Behavior - Average age people first had sex
Sexual Behavior - Average number of female sex partners in lifetime (males 18+)
Sexual Behavior - Average number of female vaginal sex partners in lifetime (males 18+)
Sexual Behavior - Average age people first performed oral sex on a woman (18+)
Sexual Behavior - Average number of woman performed oral sex on in lifetime (18+)
Sexual Behavior - Average number of male sex partners in lifetime (males 18+)
Sexual Behavior - Average number of male anal sex partners in lifetime (males 18+)
Sexual Behavior - Average age people first performed oral sex on a man (18+)
Sexual Behavior - Average number of male oral sex partners in lifetime (18+)
Sexual Behavior - People using protection when performing oral sex (%)
Sexual Behavior - Average number of times people have vaginal or anal sex a year
Sexual Behavior - People having sex without condom (%)
Sexual Behavior - Average number of male sex partners in lifetime (females 18+)
Sexual Behavior - Average number of male vaginal sex partners in lifetime (females 18+)
Sexual Behavior - Average number of female sex partners in lifetime (females 18+)
Sexual Behavior - Circumcised males 18+ (%)
Sleep Disorders - Average hours sleeping at night
Sleep Disorders - People that has trouble sleeping (%)
Smoking-Cigarette Use - People smoking cigarettes (%)
Taste & Smell - People 40+ having problems with smell (%)
Taste & Smell - People 40+ having problems with taste (%)
Taste & Smell - People 40+ that ever had wisdom teeth removed (%)
Taste & Smell - People 40+ that ever had tonsils teeth removed (%)
Taste & Smell - People 40+ that ever had a loss of consciousness because of a head injury (%)
Taste & Smell - People 40+ that ever had a broken nose or other serious injury to face or skull (%)
Taste & Smell - People 40+ that ever had two or more sinus infections (%)
Weight - Average height (inches)
Weight - Average weight (pounds)
Weight - Average BMI
Weight - People that are obese (%)
Weight - People that ever were obese (%)
Weight - People trying to lose weight (%)
100%
urban population.
Estimated median house/condo value in 2022: $226,221
76014:
$226,221Texas:
$275,400
According to our research of Texas and other state lists, there were 54 registered sex offenders living in 76014 zip code as of June 12, 2024 . The ratio of all residents to sex offenders in zip code 76014 is 665 to 1.The ratio of registered sex offenders to all residents in this zip code is lower than the state average.
Median resident age: This zip code:
32.2 yearsTexas median age:
35.6 years
Average household size: This zip code:
3.0 peopleTexas:
2.6 people
Averages for the 2020 tax year for zip code 76014, filed in 2021:
Average Adjusted Gross Income (AGI) in 2020: $36,892 (Individual Income Tax Returns) Here:
$36,892State:
$77,054
Salary/wage: $35,518 (reported on 84.5% of returns )Here:
$35,518State:
$62,766
(% of AGI for various income ranges: 1273.1% for AGIs below $25k , 3741.3% for AGIs $25k-50k , 6800.7% for AGIs $50k-75k , 9588.3% for AGIs $75k-100k , 14989.5% for AGIs $100k-200k ) Taxable interest for individuals: $930 (reported on 9.1% of returns )This zip code:
$930Texas:
$2,665
(% of AGI for various income ranges: 5.0% for AGIs below $25k , 6.1% for AGIs $25k-50k , 14.1% for AGIs $50k-75k , 25.2% for AGIs $75k-100k , 94.2% for AGIs $100k-200k ) Ordinary dividends: $1,918 (reported on 4.7% of returns )(% of AGI for various income ranges: 3.9% for AGIs below $25k , 5.3% for AGIs $25k-50k , 16.4% for AGIs $50k-75k , 36.1% for AGIs $75k-100k , 123.8% for AGIs $100k-200k ) Net capital gain/loss in AGI: +$7,396 (reported on 4.9% of returns )Here:
+$7,396State:
+$39,590
(% of AGI for various income ranges: 1.4% for AGIs below $25k , 10.8% for AGIs $25k-50k , 28.6% for AGIs $50k-75k , 92.3% for AGIs $75k-100k , 319.5% for AGIs $100k-200k ) Profit/loss from business: +$4,945 (reported on 26.0% of returns )Here:
+$4,945State:
+$10,888
(% of AGI for various income ranges: 160.5% for AGIs below $25k , 102.8% for AGIs $25k-50k , 206.2% for AGIs $50k-75k , 214.7% for AGIs $75k-100k , 643.0% for AGIs $100k-200k ) Taxable individual retirement arrangement distribution: $13,304 (reported on 3.4% of returns )76014:
$13,304Texas:
$24,740
(% of AGI for various income ranges: 16.2% for AGIs below $25k , 29.4% for AGIs $25k-50k , 90.5% for AGIs $50k-75k , 199.7% for AGIs $75k-100k , 576.0% for AGIs $100k-200k ) Total itemized deductions: $30,579 (reported on 2.6% of returns )Here:
$30,579State:
$40,428
(% of AGI for various income ranges: 16.9% for AGIs below $25k , 74.4% for AGIs $25k-50k , 207.3% for AGIs $50k-75k , 311.7% for AGIs $75k-100k , 768.5% for AGIs $100k-200k ) Charity contributions: $11,454 (reported on 2.1% of returns )Here:
$11,454State:
$18,201
(% of AGI for various income ranges: 2.0% for AGIs below $25k , 18.3% for AGIs $25k-50k , 64.6% for AGIs $50k-75k , 128.8% for AGIs $75k-100k , 270.0% for AGIs $100k-200k ) Taxes paid: $5,652 (reported on 2.4% of returns )(% of AGI for various income ranges: 1.5% for AGIs below $25k , 16.0% for AGIs $25k-50k , 38.4% for AGIs $50k-75k , 50.9% for AGIs $75k-100k , 106.5% for AGIs $100k-200k ) Earned income credit: $2,654 (reported on 29.7% of returns )(% of AGI for various income ranges: 145.6% for AGIs below $25k , 105.8% for AGIs $25k-50k , 2.1% for AGIs $50k-75k ) Percentage of individuals using paid preparers for their 2020 taxes: 92.7%(% for various income ranges: 91.5% for AGIs below $25k , 94.4% for AGIs $25k-50k , 92.3% for AGIs $50k-75k , 93.0% for AGIs $75k-100k , 92.1% for AGIs $100k-200k , 100.0% for AGIs over 200k )
Averages for the 2012 tax year for zip code 76014, filed in 2013:
Average Adjusted Gross Income (AGI) in 2012: $31,392 (Individual Income Tax Returns) Here:
$31,392State:
$65,384
Salary/wage: $30,718 (reported on 87.0% of returns )Here:
$30,718State:
$52,524
(% of AGI for various income ranges: 80.3% for AGIs below $25k , 89.7% for AGIs $25k-50k , 87.2% for AGIs $50k-75k , 85.2% for AGIs $75k-100k , 76.4% for AGIs $100k-200k ) Taxable interest for individuals: $660 (reported on 11.3% of returns )This zip code:
$660Texas:
$2,372
(% of AGI for various income ranges: 0.2% for AGIs below $25k , 0.2% for AGIs $25k-50k , 0.2% for AGIs $50k-75k , 0.3% for AGIs $75k-100k , 0.4% for AGIs $100k-200k ) Ordinary dividends: $1,947 (reported on 4.9% of returns )(% of AGI for various income ranges: 0.4% for AGIs below $25k , 0.2% for AGIs $25k-50k , 0.2% for AGIs $50k-75k , 0.3% for AGIs $75k-100k , 0.4% for AGIs $100k-200k ) Net capital gain/loss in AGI: +$1,446 (reported on 3.1% of returns )Here:
+$1,446State:
+$35,319
(% of AGI for various income ranges: 0.1% for AGIs $25k-50k , 0.2% for AGIs $75k-100k , 0.6% for AGIs $100k-200k ) Profit/loss from business: +$6,725 (reported on 22.5% of returns )Here:
+$6,725State:
+$13,732
(% of AGI for various income ranges: 12.9% for AGIs below $25k , 2.7% for AGIs $25k-50k , 2.1% for AGIs $50k-75k , 1.8% for AGIs $75k-100k , 3.4% for AGIs $100k-200k ) Taxable individual retirement arrangement distribution: $10,026 (reported on 3.8% of returns )76014:
$10,026Texas:
$19,511
(% of AGI for various income ranges: 0.9% for AGIs below $25k , 0.9% for AGIs $25k-50k , 1.2% for AGIs $50k-75k , 1.6% for AGIs $75k-100k , 2.2% for AGIs $100k-200k ) Total itemized deductions: $16,110 (30% of AGI, reported on 11.9% of returns )Here:
$16,110State:
$24,724
Here:
30.4% of AGIState:
15.9% of AGI
(% of AGI for various income ranges: 4.0% for AGIs below $25k , 6.6% for AGIs $25k-50k , 7.1% for AGIs $50k-75k , 6.7% for AGIs $75k-100k , 6.4% for AGIs $100k-200k ) Charity contributions: $4,604 (reported on 8.7% of returns )(% of AGI for various income ranges: 0.6% for AGIs below $25k , 1.2% for AGIs $25k-50k , 1.5% for AGIs $50k-75k , 1.5% for AGIs $75k-100k , 2.2% for AGIs $100k-200k ) Taxes paid: $2,912 (reported on 11.4% of returns )(% of AGI for various income ranges: 0.5% for AGIs below $25k , 1.0% for AGIs $25k-50k , 1.3% for AGIs $50k-75k , 1.3% for AGIs $75k-100k , 1.4% for AGIs $100k-200k ) Earned income credit: $2,755 (reported on 36.4% of returns )(% of AGI for various income ranges: 11.6% for AGIs below $25k , 1.9% for AGIs $25k-50k ) Percentage of individuals using paid preparers for their 2012 taxes: 56.1%(% for various income ranges: 58.1% for AGIs below $25k , 55.5% for AGIs $25k-50k , 50.3% for AGIs $50k-75k , 50.8% for AGIs $75k-100k , 54.8% for AGIs $100k-200k )
Averages for the 2004 tax year for zip code 76014, filed in 2005:
Average Adjusted Gross Income (AGI) in 2004: $30,574 (Individual Income Tax Returns) Here:
$30,574State:
$47,881
Salary/wage: $30,117 (reported on 90.4% of returns )Here:
$30,117State:
$41,947
(% of AGI for various income ranges: 88.5% for AGIs below $10k , 87.6% for AGIs $10k-25k , 92.7% for AGIs $25k-50k , 89.3% for AGIs $50k-75k , 89.7% for AGIs $75k-100k , 75.0% for AGIs over 100k ) Taxable interest for individuals: $680 (reported on 20.6% of returns )This zip code:
$680Texas:
$2,255
(% of AGI for various income ranges: 0.7% for AGIs below $10k , 0.5% for AGIs $10k-25k , 0.3% for AGIs $25k-50k , 0.4% for AGIs $50k-75k , 0.7% for AGIs $75k-100k , 0.9% for AGIs over 100k ) Taxable dividends: $1,158 (reported on 7.4% of returns )(% of AGI for various income ranges: 0.6% for AGIs below $10k , 0.2% for AGIs $10k-25k , 0.2% for AGIs $25k-50k , 0.3% for AGIs $50k-75k , 0.2% for AGIs $75k-100k , 1.0% for AGIs over 100k ) Net capital gain/loss: +$1,778 (reported on 5.8% of returns )Here:
+$1,778State:
+$16,110
(% of AGI for various income ranges: -0.3% for AGIs below $10k , -0.1% for AGIs $10k-25k , 0.1% for AGIs $25k-50k , 0.3% for AGIs $50k-75k , 0.4% for AGIs $75k-100k , 2.7% for AGIs over 100k ) Profit/loss from business: +$5,425 (reported on 16.8% of returns )Here:
+$5,425State:
+$11,013
(% of AGI for various income ranges: 12.1% for AGIs below $10k , 6.1% for AGIs $10k-25k , 1.8% for AGIs $25k-50k , 1.7% for AGIs $50k-75k , 0.7% for AGIs $75k-100k , 4.4% for AGIs over 100k ) IRA payment deduction: $2,559 (reported on 1.3% of returns )(% of AGI for various income ranges: 0.1% for AGIs $10k-25k , 0.1% for AGIs $25k-50k , 0.1% for AGIs $50k-75k , 0.1% for AGIs $75k-100k , 0.1% for AGIs over 100k ) Self-employed pension: $5,214 (reported on 0.1% of returns )Total itemized deductions: $12,835 (26% of AGI, reported on 18.9% of returns )Here:
$12,835State:
$19,631
Here:
26.1% of AGIState:
18.9% of AGI
(% of AGI for various income ranges: 3.3% for AGIs below $10k , 5.3% for AGIs $10k-25k , 9.0% for AGIs $25k-50k , 9.2% for AGIs $50k-75k , 7.7% for AGIs $75k-100k , 7.8% for AGIs over 100k ) Charity contributions deductions: $3,177 (6% of AGI, reported on 14.9% of returns )Here:
6.1% of AGIState:
4.2% of AGI
(% of AGI for various income ranges: 0.2% for AGIs below $10k , 0.8% for AGIs $10k-25k , 1.4% for AGIs $25k-50k , 1.9% for AGIs $50k-75k , 2.0% for AGIs $75k-100k , 2.5% for AGIs over 100k ) Total tax: $3,508 (reported on 65.2% of returns )(% of AGI for various income ranges: 3.5% for AGIs below $10k , 3.4% for AGIs $10k-25k , 5.5% for AGIs $25k-50k , 8.7% for AGIs $50k-75k , 11.1% for AGIs $75k-100k , 17.9% for AGIs over 100k ) Earned income credit: $2,032 (reported on 30.2% of returns )Percentage of individuals using paid preparers for their 2004 taxes: 58.4%(% for various income ranges: 54.2% for AGIs below $10k , 65.0% for AGIs $10k-25k , 58.6% for AGIs $25k-50k , 51.5% for AGIs $50k-75k , 48.9% for AGIs $75k-100k , 50.6% for AGIs over 100k )
Estimated median household income in 2022: This zip code:
$60,268Texas:
$72,284
Nearest zip codes: 76018 ,
76010 ,
76015 ,
76011 ,
75052 ,
76002 .
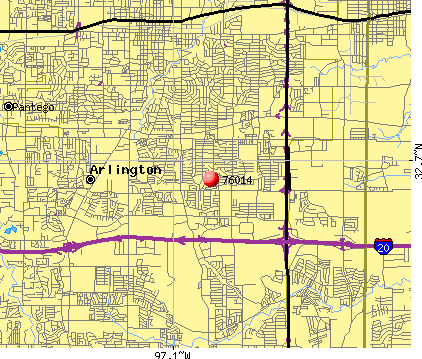
Arlington Zip Code Map
Percentage of family households: This zip code:
52.1%Texas:
50.5%
Percentage of households with unmarried partners: This zip code:
5.6%Texas:
48.7%
Likely homosexual households (counted as self-reported same-sex unmarried-partner households)
Lesbian couples: 0.2% of all households Gay men: 0.0% of all households
Household received Food Stamps/SNAP in the past 12 months: 1,785Household did not receive Food Stamps/SNAP in the past 12 months: 9,530
Women who had a birth in the past 12 months: 478 (321 now married , 156 unmarried) Women who did not have a birth in the past 12 months: 7,972 (3,137 now married , 4,846 unmarried)
Housing units in zip code 76014 with a mortgage: 3,068 (155
second mortgage , 153
both second mortgage and home equity loan )
Houses without a mortgage: 53
Median monthly owner costs for units with a mortgage: $1,394
Median monthly owner costs for units without a mortgage: $597
Residents with income below the poverty level in 2022:
This zip code:
15.6%Whole state:
14.0%
Residents with income below 50% of the poverty level in 2022:
This zip code:
11.5%Whole state:
7.4%
Median number of rooms in houses and condos: Median number of rooms in apartments:
Year house built (houses)
0 2020 or later515 2010 to 2019998 2000 to 20091,731 1990 to 19992,615 1980 to 19893,617 1970 to 1979955 1960 to 1969271 1950 to 1959248 1940 to 19492 1939 or earlier
Zip code 76014 household income distribution in 2022 462 Less than $10,000217 $10,000 to $14,999603 $15,000 to $19,999690 $20,000 to $24,999270 $25,000 to $29,999622 $30,000 to $34,999498 $35,000 to $39,999240 $40,000 to $44,999977 $45,000 to $49,999836 $50,000 to $59,9991,725 $60,000 to $74,9991,751 $75,000 to $99,9991,038 $100,000 to $124,999570 $125,000 to $149,999432 $150,000 to $199,999332 $200,000 or moreEstimate of home value of owner-occupied houses/condos in 2022 in zip code 76014 11 Less than $10,00017 $10,000 to $14,99911 $25,000 to $29,9991 $40,000 to $49,99919 $60,000 to $69,99950 $80,000 to $89,99962 $90,000 to $99,999506 $100,000 to $124,999302 $125,000 to $149,999605 $150,000 to $174,999716 $175,000 to $199,9991,359 $200,000 to $249,999565 $250,000 to $299,999352 $300,000 to $399,99941 $400,000 to $499,99992 $500,000 to $749,99921 $750,000 to $999,99914 $2,000,000 or moreRent paid by renters in 2022 in zip code 76014 11 $100 to $14925 $150 to $19916 $250 to $299102 $300 to $34911 $500 to $54934 $550 to $59924 $600 to $649135 $700 to $749112 $750 to $799411 $800 to $899339 $900 to $9991,821 $1,000 to $1,2491,464 $1,250 to $1,4991,094 $1,500 to $1,999107 $2,000 to $2,49925 $2,500 to $2,999165 No cash rent
Median gross rent in 2022: $1,445.
Median price asked for vacant for-sale houses and condos in 2022: $931,360.
Estimated median house (or condo) value in 2022 for: White Non-Hispanic householders: $222,548Black or African American householders: $235,404American Indian or Alaska Native householders: $232,037Asian householders: $231,731Some other race householders: $230,200Two or more races householders: $222,241Hispanic or Latino householders: $227,139Estimated median house or condo value in 2022: $226,221
76014:
$226,221Texas:
$275,400
Lower value quartile - upper value quartile: $177,628 - $271,346
Mean price in 2022: Detached houses: $336,628Here:
$336,628State:
$369,058
Townhouses or other attached units: $232,533Here:
$232,533State:
$327,631
In 2-unit structures: $298,131Here:
$298,131State:
$374,947
In 3-to-4-unit structures: $40,889Here:
$40,889State:
$209,652
In 5-or-more-unit structures: $212,212Here:
$212,212State:
$413,944
Mobile homes: $104,550Here:
$104,550State:
$124,413
Occupied boats, RVs, vans, etc.: $59,769Here:
$59,769State:
$73,921
Housing units in structures:
One, detached: 6,892One, attached: 779Two: 3173 or 4: 9475 to 9: 60610 to 19: 1,17020 to 49: 47650 or more: 468Mobile homes: 33Boats, RVs, vans, etc.: 2Unemployment : 4.8%
Means of transportation to work in zip code 76014 74.7% 12,188 Drove a car alone11.7% 1,910 Carpooled0.5% 79 Bus or trolley bus0.5% 78 Ferryboat0.8% 129 Taxi0.2% 26 Motorcycle0.4% 64 Walked1.8% 294 Other means8.0% 1,308 Worked at homeTravel time to work (commute) in zip code 76014 103 Less than 5 minutes1,077 5 to 9 minutes2,352 10 to 14 minutes2,364 15 to 19 minutes2,565 20 to 24 minutes689 25 to 29 minutes2,785 30 to 34 minutes433 35 to 39 minutes352 40 to 44 minutes1,212 45 to 59 minutes510 60 to 89 minutes275 90 or more minutes
Neighborhoods in zip code 76014: Percentage of zip code residents living and working in this county: 71.0%
Household type by relationship:
Households: 33,686
Male householders: 5,588 (1,527 living alone ), Female householders: 5,709 (1,647 living alone )5,185 spouses (5,146 opposite-sex spouses ), 732 unmarried partners , (703 opposite-sex unmarried partners ), 11,457 children (10,555 natural , 214 adopted , 689 stepchildren ), 1,346 grandchildren , 743 brothers or sisters , 713 parents , 47 foster children , 1,029 other relatives , 769 non-relatives In group quarters: 220 (-1 institutionalized population )
Size of family households: 2,614 2-persons , 1,614 3-persons , 1,534 4-persons , 770 5-persons , 783 6-persons , 374 7-or-more-persons
Size of nonfamily households: 3,174 1-person , 284 2-persons , 86 3-persons , 27 4-persons
5,738 married couples with children. single-parent households (934 men , 1,298 women ).
49.2% of residents of 76014 zip code speak English at home. of residents speak Spanish at home (61% very well, 21% well, 14% not well, 4% not at all ).of residents speak other Indo-European language at home (82% very well, 15% well, 2% not well ).of residents speak Asian or Pacific Island language at home (47% very well, 22% well, 23% not well, 8% not at all ).of residents speak other language at home (80% very well, 13% well, 7% not well ).
Foreign born population: 10,431 (31.0%)
(46.8%
of them are naturalized citizens )
This zip code:
31.0%Whole state:
17.2%
42% Honduras 17% Thailand 6% Costa Rica 4% Liberia 3% Kenya 3% Ethiopia 3% Cabo Verde 3% African 3% American 2% English 2% Irish 1% European 1% German 1% Nigerian
Year of entry for the foreign-born population
4,059 2010 or later 3,576 2000 to 2009 1,759 1990 to 1999 1,744 Before 1990
There are
137 Medical Specialists in Zip Code 76014 .
Facilities with environmental interests located in this zip code:
AMOS EL (3100 DANIEL DR in ARLINGTON, TX)
(National Center for Education Statistics) - STATE ID-220901124 Organizations: ARLINGTON ISD (SCHOOL DISTRICT)
ATHERTON EL (2101 OVERBROOK DR in ARLINGTON, TX)
(National Center for Education Statistics) - STATE ID-220901132 Organizations: ARLINGTON ISD (SCHOOL DISTRICT)
ARLINGTON DISTRIBUTION CTR (NEW YORK AVE & ARBROOK DRIVE in ARLINGTON, TX)
National Pollutant Discharge Elimination System NON-MAJOR (Tracking pollutant discharge elimination systems) - permit Alternative names: MIRAMAR DEVELOPMENT
ARLINGTON BIBLE MISSIONARY SCHOOL (1508 SOUTH MAYFIELD RD in ARLINGTON, TX)
COMPLIANCE ACTIVITY (Tracking inspections of insecticide, fungicide, and rodenticide, and toxic substances)
Housing units lacking complete plumbing facilities: 0.0%
Housing units lacking complete kitchen facilities: 0.6%
84.7% Electricity 14.0% Utility gas 0.5% Bottled, tank, or LP gas
Population in 1990: 26,087. Population change in the 1990s: +5,040 (+19.3%).
Place of birth for U.S.-born residents:
This state: 16,123Northeast: 595Midwest: 2,087South: 2,556West: 1,312
44% of the 76014 zip code residents lived in the same house 5 years ago.
Out of people who lived in different houses, 56% lived in this county.
Out of people who lived in different counties, 50% lived in Texas.
87% of the 76014 zip code residents lived in the same house 1 year ago.
Out of people who lived in different houses, 61% moved from this county.
Out of people who lived in different houses, 15% moved from different county within same state.
Out of people who lived in different houses, 19% moved from different state.
Out of people who lived in different houses, 4% moved from abroad.
Private vs. public school enrollment:
Students in private schools in grades 1 to 8 (elementary and middle school): 198
Students in private schools in grades 9 to 12 (high school): 72
Students in private undergraduate colleges: 205
Occupation by median earnings in the past 12 months ($)
83,601 Health diagnosing and treating practitioners and other technical occupations 79,651 Law enforcement workers including supervisors 71,413 Architecture and engineering occupations 64,736 Management occupations 64,034 Computer and mathematical occupations 61,489 Life, physical, and social science occupations
Top industries in this zip code by the number of employees in 2005:
Finance and Insurance: Consumer Lending (over 1000 employees: 1 establishment)Finance and Insurance: Commercial Banking (500-999: 1, 100-249: 1, 5-9: 1, 1-4: 1)Health Care and Social Assistance: Offices of Physicians (except Mental Health Specialists) (20-49: 4, 10-19: 4, 5-9: 10, 1-4: 9)Accommodation and Food Services: Limited-Service Restaurants (20-49: 5, 5-9: 2, 1-4: 1)Wholesale Trade: Other Grocery and Related Products Merchant Wholesalers (100-249: 1)Health Care and Social Assistance: Nursing Care Facilities (100-249: 1)Health Care and Social Assistance: Child Day Care Services (20-49: 2, 10-19: 3, 1-4: 3)Other Services (except Public Administration): Religious Organizations (20-49: 2, 10-19: 1, 5-9: 2, 1-4: 6)
People in group quarters in 2010:
146 people in nursing facilities/skilled-nursing facilities
12 people in group homes intended for adults
10 people in emergency and transitional shelters (with sleeping facilities) for people experiencing homelessness
5 people in residential treatment centers for adults
People in group quarters in 2000:
18 people in homes for the mentally retarded
15 people in hospitals/wards and hospices for chronically ill
15 people in other hospitals or wards for chronically ill
Fatal accident statistics in 2014:
Fatal accident count: 2Vehicles involved in fatal accidents: 3Fatal accidents caused by drunken drivers: 3Fatalities: 2Persons involved in fatal accidents: 3Pedestrians involved in fatal accidents: 0
Fatal accident statistics in 2013:
Fatal accident count: 2Vehicles involved in fatal accidents: 2Fatal accidents caused by drunken drivers: 1Fatalities: 2Persons involved in fatal accidents: 2Pedestrians involved in fatal accidents: 0
Home Mortgage Disclosure Act Aggregated Statistics For Year 2009(Based on 5 full and 4 partial tracts) A) FHA, FSA/RHS & VA B) Conventional C) Refinancings D) Home Improvement Loans E) Loans on Dwellings For 5+ Families F) Non-occupant Loans on G) Loans On Manufactured Number Average Value Number Average Value Number Average Value Number Average Value Number Average Value Number Average Value Number Average Value
LOANS ORIGINATED 158 $87,634 57 $70,393 185 $79,548 21 $37,068 2 $6,789,800 36 $68,742 0 $0 APPLICATIONS APPROVED, NOT ACCEPTED 9 $93,376 3 $62,437 30 $72,086 5 $19,940 0 $0 2 $54,920 1 $122,830 APPLICATIONS DENIED 33 $84,371 35 $80,061 213 $82,031 57 $21,798 0 $0 24 $66,302 2 $3,995 APPLICATIONS WITHDRAWN 8 $76,909 24 $81,873 85 $78,949 11 $61,327 0 $0 14 $63,270 0 $0 FILES CLOSED FOR INCOMPLETENESS 3 $81,573 0 $0 25 $89,952 2 $47,985 0 $0 5 $76,690 0 $0
Aggregated Statistics For Year 2008(Based on 5 full and 4 partial tracts) A) FHA, FSA/RHS & VA B) Conventional C) Refinancings D) Home Improvement Loans E) Loans on Dwellings For 5+ Families F) Non-occupant Loans on G) Loans On Manufactured Number Average Value Number Average Value Number Average Value Number Average Value Number Average Value Number Average Value Number Average Value
LOANS ORIGINATED 156 $91,239 189 $75,534 184 $78,177 54 $23,418 3 $5,993,243 76 $85,201 0 $0 APPLICATIONS APPROVED, NOT ACCEPTED 7 $97,874 30 $85,531 46 $68,618 27 $29,441 0 $0 15 $57,597 4 $55,855 APPLICATIONS DENIED 32 $90,961 94 $78,828 272 $79,487 139 $30,816 0 $0 57 $67,364 11 $45,425 APPLICATIONS WITHDRAWN 16 $94,557 30 $76,120 87 $83,824 8 $84,770 0 $0 24 $83,502 0 $0 FILES CLOSED FOR INCOMPLETENESS 14 $89,349 13 $87,307 20 $76,107 8 $64,177 0 $0 4 $90,862 0 $0
Aggregated Statistics For Year 2007(Based on 5 full and 4 partial tracts) A) FHA, FSA/RHS & VA B) Conventional C) Refinancings D) Home Improvement Loans E) Loans on Dwellings For 5+ Families F) Non-occupant Loans on G) Loans On Manufactured Number Average Value Number Average Value Number Average Value Number Average Value Number Average Value Number Average Value Number Average Value
LOANS ORIGINATED 118 $93,260 537 $74,855 315 $76,395 69 $34,461 1 $120,000 199 $74,500 2 $97,630 APPLICATIONS APPROVED, NOT ACCEPTED 9 $89,951 66 $69,240 82 $73,130 27 $30,646 0 $0 22 $80,200 1 $49,790 APPLICATIONS DENIED 39 $95,165 227 $75,053 456 $85,010 184 $23,960 3 $116,230 109 $68,768 13 $61,728 APPLICATIONS WITHDRAWN 9 $92,467 70 $76,921 197 $91,135 12 $40,978 0 $0 34 $79,121 0 $0 FILES CLOSED FOR INCOMPLETENESS 3 $71,550 33 $86,966 66 $85,122 7 $49,183 0 $0 11 $91,482 0 $0
Aggregated Statistics For Year 2006(Based on 5 full and 4 partial tracts) A) FHA, FSA/RHS & VA B) Conventional C) Refinancings D) Home Improvement Loans F) Non-occupant Loans on G) Loans On Manufactured Number Average Value Number Average Value Number Average Value Number Average Value Number Average Value Number Average Value
LOANS ORIGINATED 91 $92,748 792 $68,917 309 $76,346 95 $38,893 222 $70,289 4 $52,420 APPLICATIONS APPROVED, NOT ACCEPTED 7 $84,880 128 $70,452 108 $78,018 29 $29,325 27 $76,929 1 $80,570 APPLICATIONS DENIED 17 $84,009 370 $74,048 491 $84,150 174 $27,312 123 $75,881 2 $30,265 APPLICATIONS WITHDRAWN 10 $88,759 133 $81,005 290 $83,457 25 $42,349 60 $81,060 0 $0 FILES CLOSED FOR INCOMPLETENESS 1 $105,000 43 $95,012 161 $90,870 6 $40,932 14 $78,921 0 $0
Aggregated Statistics For Year 2005(Based on 5 full and 4 partial tracts) A) FHA, FSA/RHS & VA B) Conventional C) Refinancings D) Home Improvement Loans F) Non-occupant Loans on G) Loans On Manufactured Number Average Value Number Average Value Number Average Value Number Average Value Number Average Value Number Average Value
LOANS ORIGINATED 136 $90,535 799 $66,274 568 $75,225 86 $68,482 239 $73,539 2 $23,910 APPLICATIONS APPROVED, NOT ACCEPTED 3 $104,840 153 $61,394 106 $72,411 28 $29,996 49 $67,659 8 $45,578 APPLICATIONS DENIED 26 $99,768 327 $67,980 723 $80,350 149 $31,087 90 $78,627 20 $46,981 APPLICATIONS WITHDRAWN 19 $101,167 255 $70,273 409 $100,547 83 $163,992 144 $53,396 0 $0 FILES CLOSED FOR INCOMPLETENESS 7 $117,300 53 $67,269 313 $85,469 3 $37,257 32 $67,348 0 $0
Aggregated Statistics For Year 2004(Based on 5 full and 4 partial tracts) A) FHA, FSA/RHS & VA B) Conventional C) Refinancings D) Home Improvement Loans F) Non-occupant Loans on G) Loans On Manufactured Number Average Value Number Average Value Number Average Value Number Average Value Number Average Value Number Average Value
LOANS ORIGINATED 221 $91,291 647 $73,977 976 $72,555 85 $43,676 246 $70,885 0 $0 APPLICATIONS APPROVED, NOT ACCEPTED 12 $98,332 223 $72,653 148 $70,284 20 $27,460 66 $81,345 4 $58,352 APPLICATIONS DENIED 48 $99,204 271 $76,139 900 $74,808 144 $22,898 126 $69,407 20 $41,784 APPLICATIONS WITHDRAWN 23 $98,225 117 $75,854 487 $79,936 9 $45,193 49 $74,659 2 $59,910 FILES CLOSED FOR INCOMPLETENESS 10 $119,306 42 $71,854 334 $83,639 4 $83,838 7 $94,460 0 $0
Aggregated Statistics For Year 2003(Based on 5 full and 4 partial tracts) A) FHA, FSA/RHS & VA B) Conventional C) Refinancings D) Home Improvement Loans F) Non-occupant Loans on Number Average Value Number Average Value Number Average Value Number Average Value Number Average Value
LOANS ORIGINATED 268 $89,379 509 $76,445 1,664 $68,479 67 $26,726 217 $67,107 APPLICATIONS APPROVED, NOT ACCEPTED 9 $107,918 105 $73,629 263 $68,032 22 $38,804 56 $70,317 APPLICATIONS DENIED 23 $92,247 236 $69,619 1,087 $71,597 107 $20,422 93 $65,186 APPLICATIONS WITHDRAWN 30 $101,752 118 $78,867 443 $71,842 6 $56,108 37 $66,972 FILES CLOSED FOR INCOMPLETENESS 5 $82,222 50 $91,161 103 $69,647 4 $19,402 7 $68,687
Aggregated Statistics For Year 2002(Based on 5 full and 4 partial tracts) A) FHA, FSA/RHS & VA B) Conventional C) Refinancings D) Home Improvement Loans E) Loans on Dwellings For 5+ Families F) Non-occupant Loans on Number Average Value Number Average Value Number Average Value Number Average Value Number Average Value Number Average Value
LOANS ORIGINATED 390 $88,345 487 $67,230 952 $67,137 76 $18,929 2 $4,316,535 184 $57,111 APPLICATIONS APPROVED, NOT ACCEPTED 11 $85,306 76 $55,307 177 $62,464 19 $22,294 0 $0 20 $60,026 APPLICATIONS DENIED 51 $85,039 142 $70,303 465 $64,802 99 $13,713 0 $0 35 $53,463 APPLICATIONS WITHDRAWN 41 $85,112 63 $62,800 327 $69,257 14 $25,779 0 $0 39 $61,236 FILES CLOSED FOR INCOMPLETENESS 14 $81,300 61 $80,619 164 $73,764 4 $21,718 0 $0 4 $61,425
Aggregated Statistics For Year 2001(Based on 5 full and 4 partial tracts) A) FHA, FSA/RHS & VA B) Conventional C) Refinancings D) Home Improvement Loans E) Loans on Dwellings For 5+ Families F) Non-occupant Loans on Number Average Value Number Average Value Number Average Value Number Average Value Number Average Value Number Average Value
LOANS ORIGINATED 432 $81,105 398 $65,604 586 $63,736 115 $20,727 0 $0 79 $60,354 APPLICATIONS APPROVED, NOT ACCEPTED 10 $84,845 74 $62,334 93 $58,856 38 $16,629 0 $0 13 $41,315 APPLICATIONS DENIED 37 $79,216 206 $59,622 377 $62,640 171 $16,081 0 $0 26 $45,340 APPLICATIONS WITHDRAWN 54 $84,064 80 $57,615 215 $72,092 24 $19,240 2 $19,970,000 9 $56,971 FILES CLOSED FOR INCOMPLETENESS 15 $84,613 37 $66,621 67 $78,169 0 $0 0 $0 7 $63,771
Aggregated Statistics For Year 2000(Based on 5 full and 4 partial tracts) A) FHA, FSA/RHS & VA B) Conventional C) Refinancings D) Home Improvement Loans E) Loans on Dwellings For 5+ Families F) Non-occupant Loans on Number Average Value Number Average Value Number Average Value Number Average Value Number Average Value Number Average Value
LOANS ORIGINATED 445 $77,799 433 $64,766 174 $55,628 96 $16,018 1 $7,745,170 85 $52,876 APPLICATIONS APPROVED, NOT ACCEPTED 23 $50,273 88 $62,753 41 $42,532 70 $14,328 0 $0 22 $62,351 APPLICATIONS DENIED 63 $62,003 285 $53,643 125 $49,317 185 $13,933 0 $0 38 $45,730 APPLICATIONS WITHDRAWN 24 $69,104 58 $60,876 97 $59,609 17 $13,236 0 $0 10 $54,389 FILES CLOSED FOR INCOMPLETENESS 5 $96,706 51 $57,842 70 $69,816 1 $19,810 0 $0 7 $65,373
Aggregated Statistics For Year 1999(Based on 3 full and 2 partial tracts) A) FHA, FSA/RHS & VA B) Conventional C) Refinancings D) Home Improvement Loans E) Loans on Dwellings For 5+ Families F) Non-occupant Loans on Number Average Value Number Average Value Number Average Value Number Average Value Number Average Value Number Average Value
LOANS ORIGINATED 242 $72,826 262 $100,387 231 $54,836 66 $13,883 3 $2,707,987 80 $188,846 APPLICATIONS APPROVED, NOT ACCEPTED 7 $73,220 69 $55,225 69 $98,075 58 $14,681 0 $0 18 $49,997 APPLICATIONS DENIED 27 $72,176 184 $51,766 109 $46,262 122 $13,206 0 $0 31 $42,649 APPLICATIONS WITHDRAWN 22 $63,058 48 $65,658 77 $55,213 6 $24,068 0 $0 6 $45,592 FILES CLOSED FOR INCOMPLETENESS 3 $76,360 11 $72,525 53 $65,811 4 $16,748 0 $0 5 $39,478
Private Mortgage Insurance Companies Aggregated Statistics For Year 2009(Based on 5 full and 4 partial tracts) A) Conventional B) Refinancings C) Non-occupant Loans on Number Average Value Number Average Value Number Average Value
LOANS ORIGINATED 9 $79,404 3 $85,010 0 $0 APPLICATIONS APPROVED, NOT ACCEPTED 5 $85,142 1 $80,000 4 $84,678 APPLICATIONS DENIED 2 $70,060 2 $105,155 0 $0 APPLICATIONS WITHDRAWN 0 $0 0 $0 0 $0 FILES CLOSED FOR INCOMPLETENESS 0 $0 0 $0 0 $0
Aggregated Statistics For Year 2008(Based on 5 full and 4 partial tracts) A) Conventional B) Refinancings C) Non-occupant Loans on Number Average Value Number Average Value Number Average Value
LOANS ORIGINATED 85 $77,421 24 $85,555 26 $78,173 APPLICATIONS APPROVED, NOT ACCEPTED 42 $98,534 22 $95,216 13 $83,733 APPLICATIONS DENIED 13 $78,892 0 $0 2 $60,910 APPLICATIONS WITHDRAWN 2 $107,145 2 $79,000 0 $0 FILES CLOSED FOR INCOMPLETENESS 5 $76,682 1 $106,700 2 $64,575
Aggregated Statistics For Year 2007(Based on 5 full and 4 partial tracts) A) Conventional B) Refinancings C) Non-occupant Loans on Number Average Value Number Average Value Number Average Value
LOANS ORIGINATED 207 $88,877 30 $94,580 35 $78,010 APPLICATIONS APPROVED, NOT ACCEPTED 30 $90,172 22 $96,727 4 $89,185 APPLICATIONS DENIED 11 $82,585 1 $83,000 5 $84,652 APPLICATIONS WITHDRAWN 6 $99,923 1 $114,000 0 $0 FILES CLOSED FOR INCOMPLETENESS 1 $103,000 0 $0 0 $0
Aggregated Statistics For Year 2006(Based on 5 full and 4 partial tracts) A) Conventional B) Refinancings C) Non-occupant Loans on Number Average Value Number Average Value Number Average Value
LOANS ORIGINATED 85 $88,548 18 $89,568 10 $72,871 APPLICATIONS APPROVED, NOT ACCEPTED 16 $90,559 2 $102,315 6 $63,082 APPLICATIONS DENIED 0 $0 0 $0 0 $0 APPLICATIONS WITHDRAWN 8 $94,880 4 $100,932 3 $101,217 FILES CLOSED FOR INCOMPLETENESS 0 $0 0 $0 0 $0
Aggregated Statistics For Year 2005(Based on 5 full and 4 partial tracts) A) Conventional B) Refinancings C) Non-occupant Loans on Number Average Value Number Average Value Number Average Value
LOANS ORIGINATED 105 $86,321 33 $85,735 35 $82,214 APPLICATIONS APPROVED, NOT ACCEPTED 20 $83,669 8 $92,889 6 $78,848 APPLICATIONS DENIED 3 $57,503 1 $94,510 2 $63,755 APPLICATIONS WITHDRAWN 8 $82,874 3 $96,230 1 $85,000 FILES CLOSED FOR INCOMPLETENESS 2 $69,615 2 $102,500 1 $62,000
Aggregated Statistics For Year 2004(Based on 5 full and 4 partial tracts) A) Conventional B) Refinancings C) Non-occupant Loans on Number Average Value Number Average Value Number Average Value
LOANS ORIGINATED 111 $90,093 49 $85,467 22 $81,748 APPLICATIONS APPROVED, NOT ACCEPTED 32 $88,120 21 $81,690 11 $80,570 APPLICATIONS DENIED 5 $73,826 1 $125,480 2 $65,900 APPLICATIONS WITHDRAWN 8 $98,334 3 $91,457 0 $0 FILES CLOSED FOR INCOMPLETENESS 2 $120,930 2 $84,675 0 $0
Aggregated Statistics For Year 2003(Based on 5 full and 4 partial tracts) A) Conventional B) Refinancings C) Non-occupant Loans on Number Average Value Number Average Value Number Average Value
LOANS ORIGINATED 151 $86,002 103 $80,809 21 $73,602 APPLICATIONS APPROVED, NOT ACCEPTED 22 $91,160 30 $94,971 2 $144,390 APPLICATIONS DENIED 0 $0 4 $70,715 1 $78,250 APPLICATIONS WITHDRAWN 10 $84,768 5 $85,344 3 $73,963 FILES CLOSED FOR INCOMPLETENESS 0 $0 1 $66,000 1 $66,000
Aggregated Statistics For Year 2002(Based on 5 full and 4 partial tracts) A) Conventional B) Refinancings C) Non-occupant Loans on Number Average Value Number Average Value Number Average Value
LOANS ORIGINATED 149 $77,121 53 $83,784 26 $58,657 APPLICATIONS APPROVED, NOT ACCEPTED 17 $87,277 19 $85,815 0 $0 APPLICATIONS DENIED 3 $61,197 4 $75,308 1 $81,890 APPLICATIONS WITHDRAWN 6 $75,533 8 $78,740 0 $0 FILES CLOSED FOR INCOMPLETENESS 2 $64,755 0 $0 0 $0
Aggregated Statistics For Year 2001(Based on 5 full and 4 partial tracts) A) Conventional B) Refinancings C) Non-occupant Loans on Number Average Value Number Average Value Number Average Value
LOANS ORIGINATED 115 $76,968 25 $78,639 11 $68,589 APPLICATIONS APPROVED, NOT ACCEPTED 23 $76,996 5 $74,882 15 $68,653 APPLICATIONS DENIED 5 $60,312 0 $0 0 $0 APPLICATIONS WITHDRAWN 0 $0 2 $67,740 2 $67,740 FILES CLOSED FOR INCOMPLETENESS 7 $73,141 0 $0 0 $0
Aggregated Statistics For Year 2000(Based on 5 full and 4 partial tracts) A) Conventional B) Refinancings C) Non-occupant Loans on Number Average Value Number Average Value Number Average Value
LOANS ORIGINATED 132 $71,067 13 $62,465 17 $55,216 APPLICATIONS APPROVED, NOT ACCEPTED 14 $78,163 3 $62,563 0 $0 APPLICATIONS DENIED 7 $57,467 2 $70,730 5 $54,032 APPLICATIONS WITHDRAWN 5 $63,960 0 $0 0 $0 FILES CLOSED FOR INCOMPLETENESS 0 $0 0 $0 0 $0
Aggregated Statistics For Year 1999(Based on 3 full and 2 partial tracts) A) Conventional B) Refinancings C) Non-occupant Loans on Number Average Value Number Average Value Number Average Value
LOANS ORIGINATED 64 $67,325 18 $73,842 13 $47,658 APPLICATIONS APPROVED, NOT ACCEPTED 6 $55,923 4 $80,285 1 $67,010 APPLICATIONS DENIED 3 $85,970 0 $0 1 $44,190 APPLICATIONS WITHDRAWN 5 $60,450 0 $0 1 $36,460 FILES CLOSED FOR INCOMPLETENESS 2 $69,555 1 $120,790 0 $0
2003 - 2018 National Fire Incident Reporting System (NFIRS) incidents See full 2006 National Fire Incident Reporting System statistics for zip code 76014, Texas
Most common first names in zip code 76014 among deceased individuals Name Count Lived (average)
James 44 67.5 years Mary 43 75.6 years John 37 68.6 years William 35 76.5 years Robert 27 65.3 years Charles 22 63.5 years George 21 71.8 years Dorothy 18 73.8 years Joseph 16 75.4 years David 15 67.1 years
Most common last names in zip code 76014 among deceased individuals Last name Count Lived (average)
Smith 21 72.9 years Johnson 16 69.6 years Nguyen 15 73.7 years Williams 14 71.5 years Brown 14 72.9 years Jones 14 71.9 years Davis 13 69.4 years Taylor 12 70.6 years Moore 11 77.0 years Tran 11 75.9 years
Businesses in zip code 76014
Name Count Name Count
7-Eleven 1 Jamba Juice 1 AutoZone 1 Kroger 1 CVS 1 Mazda 1 Church's Chicken 1 Penske 1 Costco 1 Pizza Hut 1 Domino's Pizza 1 T-Mobile 1 FedEx 3 True Value 1 GameStop 1 UPS 1


 Nearest zip codes: 76018, 76010, 76015, 76011, 75052, 76002.
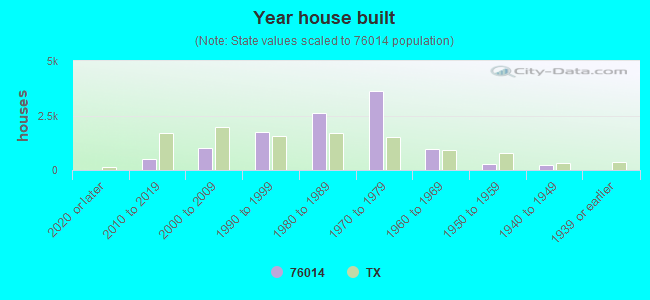
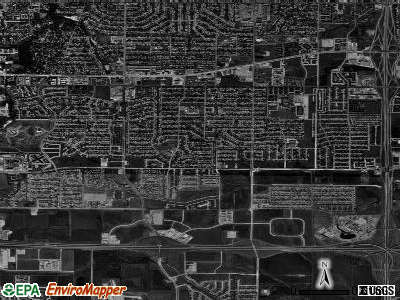
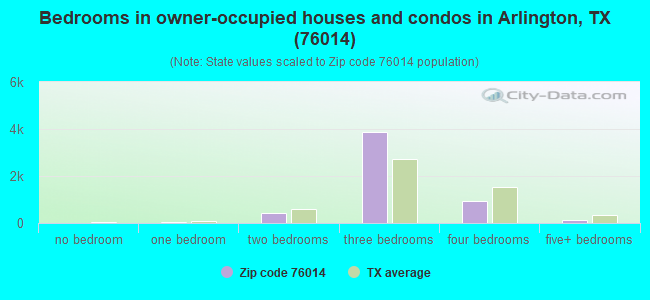
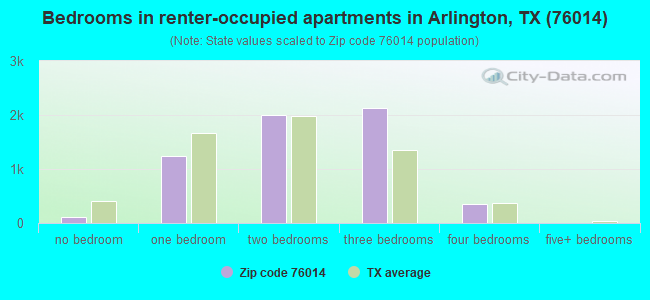
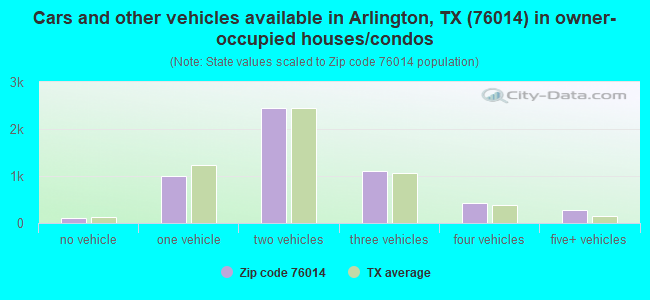
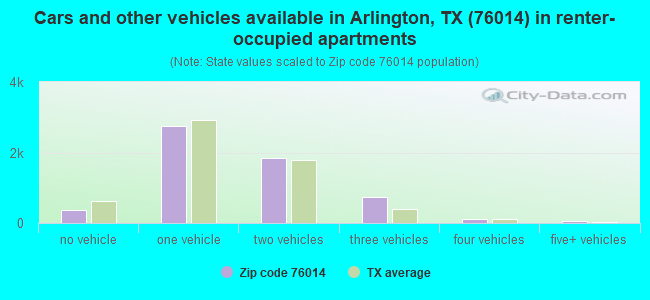


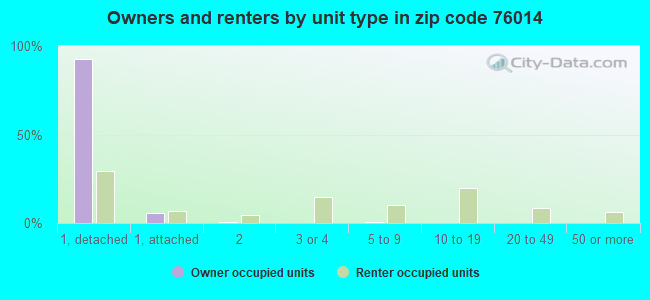
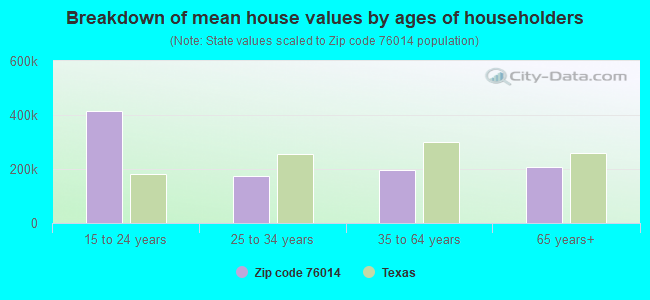


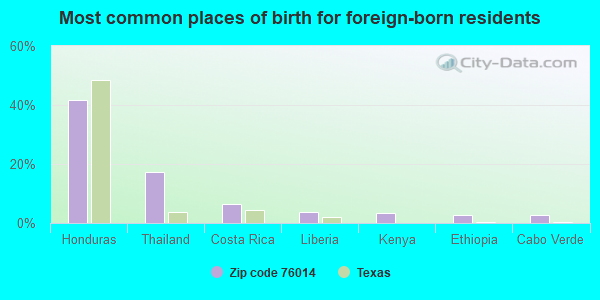
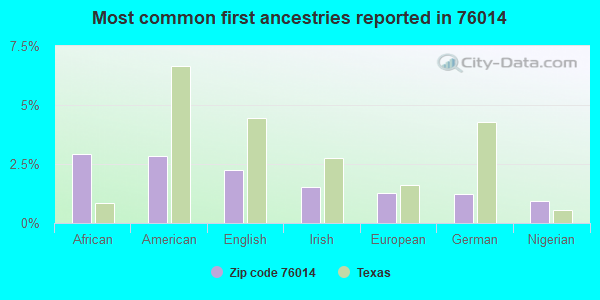
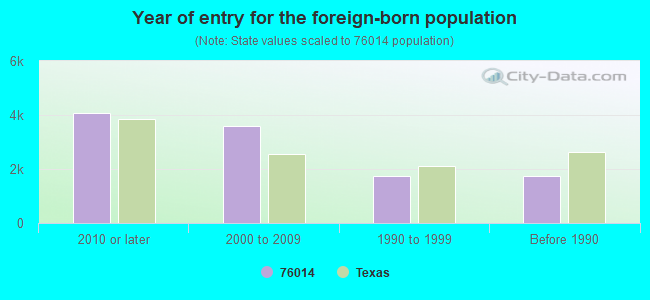

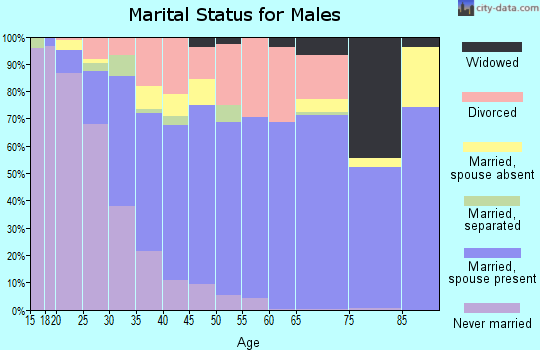
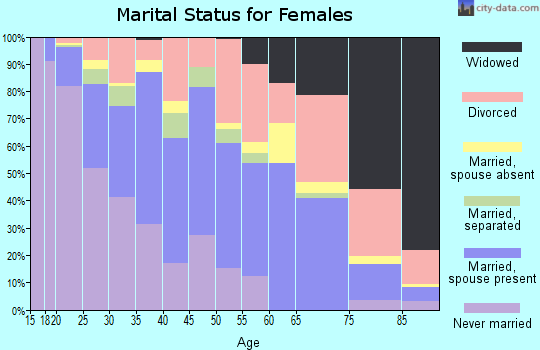
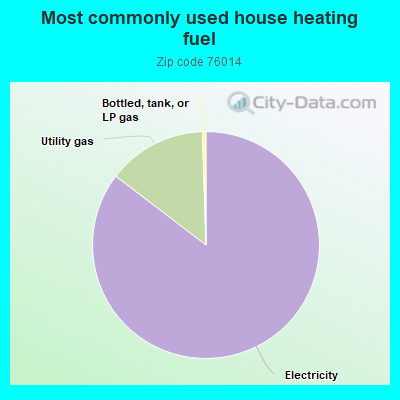
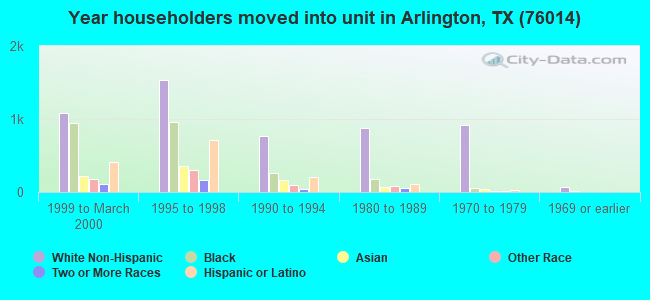
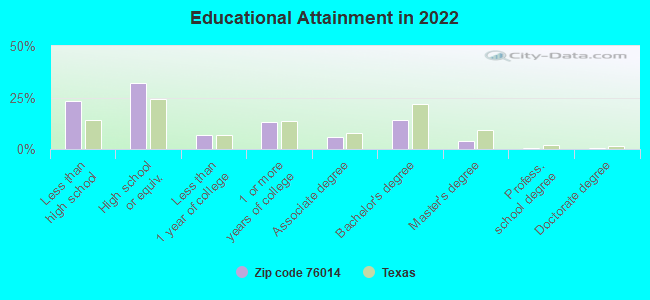
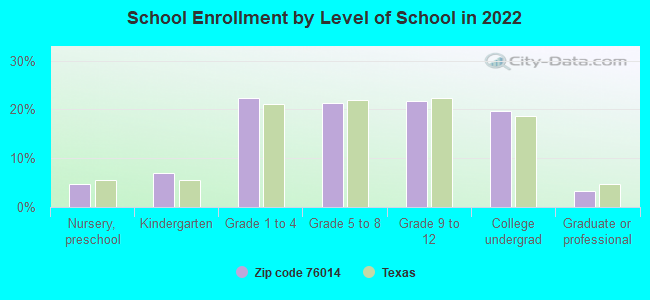
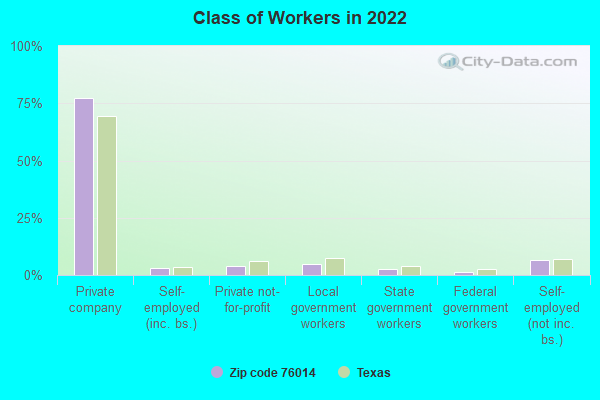
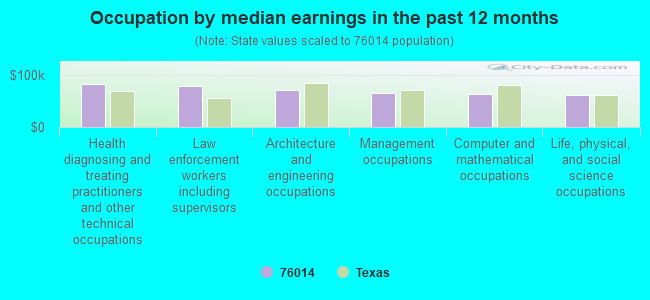
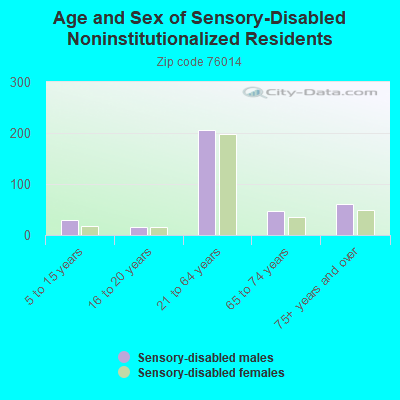
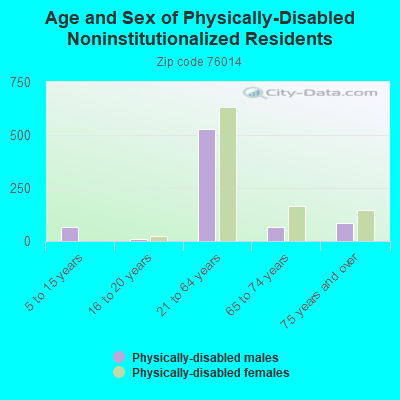
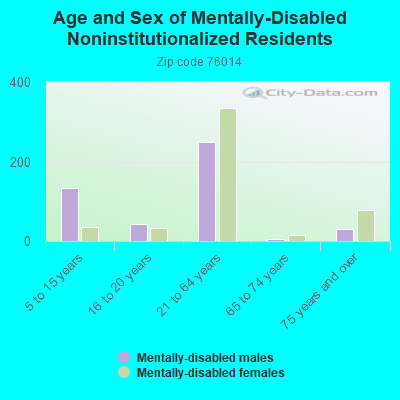
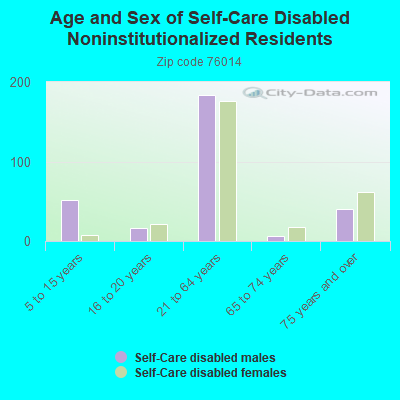
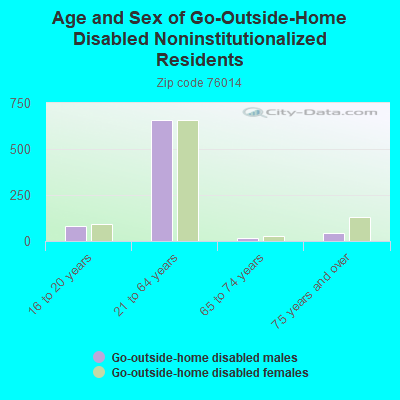
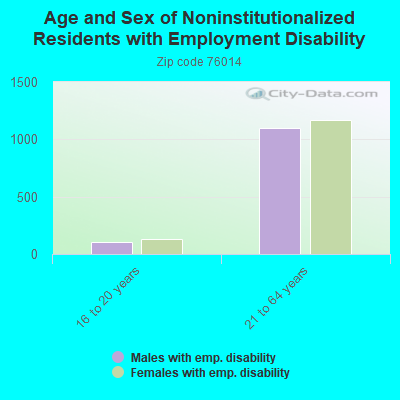
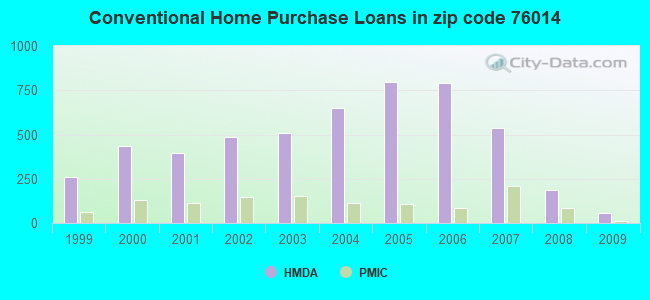
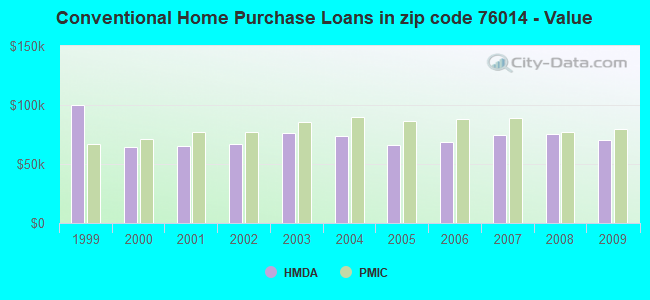
 According to the data from the years 2003 - 2018 the average number of fires per year is 84. The highest number of reported fires - 137 took place in 2008, and the least - 0 in 2004. The data has an increasing trend.
 When looking into fire subcategories, the most reports belonged to: Outside Fires (39.0%), and Structure Fires (36.5%).