Estimated zip code population in 2022: 1,885 Zip code population in 2010: 2,250 Zip code population in 2000: 1,817
Houses and condos: 1,621 Renter-occupied apartments: 339
% of renters here:
39%
State:
34%
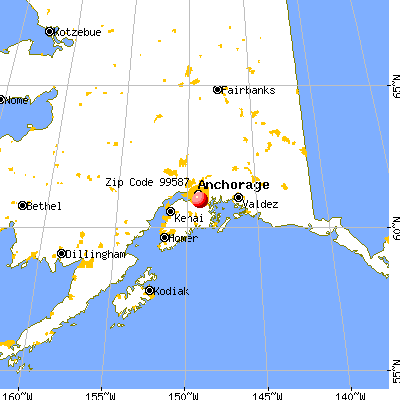
March 2022 cost of living index in zip code 99587: 107.8 (more than average, U.S. average is 100)
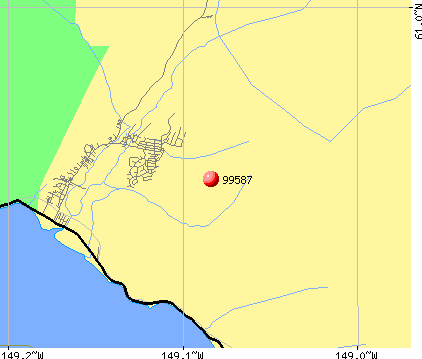
Land area: 242.4 sq. mi. Water area: 8.0 sq. mi.
Population density: 8 people per square mile
(very low).
OSM Map
General Map
Google Map
MSN Map
OSM Map
General Map
Google Map
MSN Map
OSM Map
General Map
Google Map
MSN Map
OSM Map
General Map
Google Map
MSN Map
Please wait while loading the map...
Real estate property taxes paid for housing units in 2022:
This zip code:
0.9% ($4,718)
Alaska:
1.1% ($3,650)
Median real estate property taxes paid for housing units with mortgages in 2022: $4,883 (1.3%) Median real estate property taxes paid for housing units with no mortgage in 2022: $3,581 (1.0%)
Estimated median house/condo value in 2022: $536,815
99587:
$536,815
Alaska:
$336,900
According to our research of Alaska and other state lists, there was 1 registered sex offender living in 99587 zip code as of June 12, 2024. The ratio of all residents to sex offenders in zip code 99587 is 2,303 to 1. The ratio of registered sex offenders to all residents in this zip code is much lower than the state average.
Median resident age:
This zip code:
50.4 years
Alaska median age:
35.9 years
Average household size:
This zip code:
2.1 people
Alaska:
2.6 people
Averages for the 2004 tax year for zip code 99587, filed in 2005:
Average Adjusted Gross Income (AGI) in 2004: $48,427 (Individual Income Tax Returns)
Here:
$48,427
State:
$45,527
Salary/wage: $40,187 (reported on 84.0% of returns)
Here:
$40,187
State:
$41,300
(% of AGI for various income ranges: 94.4% for AGIs below $10k, 84.2% for AGIs $10k-25k, 84.3% for AGIs $25k-50k, 84.4% for AGIs $50k-75k, 78.8% for AGIs $75k-100k, 50.6% for AGIs over 100k)
Taxable interest for individuals: $837 (reported on 48.9% of returns)
This zip code:
$837
Alaska:
$1,233
(% of AGI for various income ranges: 3.1% for AGIs below $10k, 0.7% for AGIs $10k-25k, 0.9% for AGIs $25k-50k, 0.5% for AGIs $50k-75k, 1.1% for AGIs $75k-100k, 0.9% for AGIs over 100k)
Taxable dividends: $2,426 (reported on 25.9% of returns)
Here:
$2,426
State:
$2,694
(% of AGI for various income ranges: 2.9% for AGIs below $10k, 1.1% for AGIs $10k-25k, 1.2% for AGIs $25k-50k, 0.7% for AGIs $50k-75k, 1.9% for AGIs $75k-100k, 1.4% for AGIs over 100k)
Net capital gain/loss: +$8,204 (reported on 20.7% of returns)
Here:
+$8,204
State:
+$10,140
(% of AGI for various income ranges: -3.1% for AGIs below $10k, 1.3% for AGIs $10k-25k, -0.2% for AGIs $25k-50k, 1.0% for AGIs $50k-75k, 2.0% for AGIs $75k-100k, 7.3% for AGIs over 100k)
Profit/loss from business: +$12,674 (reported on 19.4% of returns)
Here:
+$12,674
State:
+$12,808
(% of AGI for various income ranges: 16.6% for AGIs below $10k, 7.3% for AGIs $10k-25k, 5.4% for AGIs $25k-50k, 5.4% for AGIs $50k-75k, 6.1% for AGIs $75k-100k, 3.6% for AGIs over 100k)
IRA payment deduction: $2,321 (reported on 2.3% of returns)
99587:
$2,321
Alaska:
$2,963
Self-employed pension: $6,619 (reported on 1.7% of returns)
Here:
$6,619
Alaska:
$13,983
Total itemized deductions: $15,156 (15% of AGI, reported on 27.5% of returns)
Here:
$15,156
State:
$16,716
Here:
15.3% of AGI
State:
18.3% of AGI
(% of AGI for various income ranges: 7.1% for AGIs $10k-25k, 7.6% for AGIs $25k-50k, 12.1% for AGIs $50k-75k, 10.3% for AGIs $75k-100k, 7.7% for AGIs over 100k)
Charity contributions deductions: $1,918 (2% of AGI, reported on 20.9% of returns)
Here:
$1,918
State:
$3,652
Here:
1.7% of AGI
State:
3.8% of AGI
(% of AGI for various income ranges: 0.2% for AGIs $10k-25k, 0.5% for AGIs $25k-50k, 0.9% for AGIs $50k-75k, 0.7% for AGIs $75k-100k, 1.1% for AGIs over 100k)
Total tax: $7,082 (reported on 89.2% of returns)
99587:
$7,082
State:
$7,049
(% of AGI for various income ranges: 4.6% for AGIs below $10k, 6.5% for AGIs $10k-25k, 9.4% for AGIs $25k-50k, 11.0% for AGIs $50k-75k, 12.9% for AGIs $75k-100k, 17.2% for AGIs over 100k)
Earned income credit: $964 (reported on 9.0% of returns)
Here:
$964
State:
$1,505
Percentage of individuals using paid preparers for their 2004 taxes: 39.5%
Here:
39%
State:
49%
(% for various income ranges: 34.6% for AGIs below $10k, 28.2% for AGIs $10k-25k, 31.7% for AGIs $25k-50k, 52.6% for AGIs $50k-75k, 59.8% for AGIs $75k-100k, 63.1% for AGIs over 100k)
Household received Food Stamps/SNAP in the past 12 months: 42 Household did not receive Food Stamps/SNAP in the past 12 months: 832
Women who had a birth in the past 12 months: 17 (18 now married, 0 unmarried) Women who did not have a birth in the past 12 months: 292 (30 now married, 272 unmarried)
Housing units in zip code 99587 with a mortgage: 412 (26 second mortgage, 8 both second mortgage and home equity loan) Median monthly owner costs for units with a mortgage: $2,301 Median monthly owner costs for units without a mortgage: $1,082
Residents with income below the poverty level in 2022:
This zip code:
10.8%
Whole state:
11.0%
Residents with income below 50% of the poverty level in 2022:
This zip code:
0.4%
Whole state:
5.6%
Median number of rooms in houses and condos:
Here:
5.8
State:
5.6
Median number of rooms in apartments:
Here:
3.4
State:
3.9
Notable locations in this zip code not listed on our city pages
Notable locations in zip code 99587: Holmgren (A), Begich Boggs Visitor Center (B), Moraine (C), Moose Flats Picnic Area (D), The Cache (E), Black Bear Campground (F), Twentymile River Station (G), Kern (H), Williwaw Campground (I), Portage (J), Crow Pass Cabin (K), Lower Engineers Camp (L), Girdwood Clinic (M), Girdwood Fire Department (N). Display/hide their locations on the map
Rivers and creeks: Twentymile River (A), Skookum Creek (B), Upper Carmen River (C), Virgin Creek (D), California Creek (E), Crow Creek (F), Glacier River (G), Winner Creek (H), Kern Creek (I). Display/hide their locations on the map
Tourist attractions (not listed on the city page) : Alaska Wildlife Conservation Center (Cultural Attractions- Events- & Facilities; Mi Post 79 Sewrd Highway) (1), Alaska Wildland Adventures (Tours & Charters; Alyeska Highway) (2), Alaska Sea Tours & Alaska Wall Tent Adventures! (Tours & Charters; 715 Hightower Road) (3). Display/hide their approximate locations on the map
ENFORCEMENT/COMPLIANCE ACTIVITY (Integrated Compliance Information System) National Pollutant Discharge Elimination System NON-MAJOR (Tracking pollutant discharge elimination systems) - permit - ICIS-10-2006-0010, ENFORCEMENT/COMPLIANCE ACTIVITY, ICIS-, National Pollutant Discharge Elimination System NON-MAJOR (Tracking pollutant discharge elimination systems) - permit - ICIS-10-2006-0011, ENFORCEMENT/COMPLIANCE ACTIVITY, ICIS-, Business SIC classification: GENERAL CONTRACTORS-RESIDENTIAL BUILDINGS, OTHER THAN SINGLE-FAMILY Alternative names: 6020 GROUP LLC, 6020 GROUP LLC - AKR10BB90, SNOW RAVEN VILLAGE
SEIBU ALASKA INC (OLYMPIC CIRCLE in GIRDWOOD, AK)
(Resource Conservation and Recovery Act (tracking hazardous waste))
JAKOBOWSKI, JOHN E. (ANCHORAGE A-6 in GIRDWOOD, AK)
National Pollutant Discharge Elimination System NON-MAJOR (Tracking pollutant discharge elimination systems) - permit Business SIC classification: GOLD ORES Alternative names: JOHN E. JAKOBOWSKI
KIEWIT PACIFIC CO GIRDWOOD (MP 96.1 SEWARD HWY in GIRDWOOD, AK)
Conditionally Exempt Small Quantity Generators, less than 100 kg/month of hazardous waste (Resource Conservation and Recovery Act (tracking hazardous waste)) - notification USED OIL PROGRAM (Resource Conservation and Recovery Act (tracking hazardous waste))
KIEWIT CONST CO GIRDWOOD (1000 ARLBERG AVE in GIRDWOOD, AK)
Conditionally Exempt Small Quantity Generators, less than 100 kg/month of hazardous waste (Resource Conservation and Recovery Act (tracking hazardous waste)) - notification Organizations: SEIBU ALASKA INC DBA ALYESKA (CONTACT/OWNER)
Housing units lacking complete plumbing facilities: 5.2% Housing units lacking complete kitchen facilities: 4.1%
86.3%Utility gas
13.7%Electricity
Place of birth for U.S.-born residents:
This state: 641
Northeast: 78
Midwest: 286
South: 309
West: 533
42% of the 99587 zip code residents lived in the same house 5 years ago. Out of people who lived in different houses, 56% lived in this county. Out of people who lived in different counties, 50% lived in Alaska.
97% of the 99587 zip code residents lived in the same house 1 year ago. Out of people who lived in different houses, 38% moved from this county. Out of people who lived in different houses, 85% moved from different state.
Private vs. public school enrollment:
Students in private schools in grades 1 to 8 (elementary and middle school):
Here:
0.0%
Alaska:
15.7%
Students in private schools in grades 9 to 12 (high school):
Here:
0.0%
Alaska:
13.7%
Students in private undergraduate colleges:
Here:
0.0%
Alaska:
14.7%
Occupation by median earnings in the past 12 months ($)
251,964Transportation occupations
114,023Management occupations
73,616Office and administrative support occupations
37,799Sales and related occupations
37,551Personal care and service occupations
Companies with federal contracts located in this zip code (GIRDWOOD, AK):
SEIBU ALASKA, INC (1000 ARLBERG AVE) : $125,290 in 13 contractsfrom 2001 to 2006
Contracts for Lodging - Hotel/Motel, Lease or Rental of Facilities -- Conference Space and Facilities, Market Research and Public Opinion Services (includes telephone and field interviews, focus testing, and surveys), Chaplain Services by Office of Justice Programs, Bureau of Land Management, Army Signed by year:2000: $0; 2001: $52,000; 2002: $0; 2003: $0; 2004: $17,623; 2005: $28,937; 2006: $26,730.
Biggest contracts:
$52,000 with Office of Justice Programs for Lodging - Hotel/Motel. Signed on 2001-09-15. Completion date: 2001-11-15.
$20,000 with Bureau of Land Management for Lease or Rental of Facilities -- Conference Space and Facilities. Signed on 2004-10-25. Effective on 2004-10-27. Completion date: 2004-11-29.
$15,316 with Bureau of Land Management for Market Research and Public Opinion Services (includes telephone and field interviews, focus testing, and surveys). Signed on 2005-11-18. Completion date: 2005-11-18.
$10,780 with Army for Lease or Rental of Facilities -- Conference Space and Facilities. Signed on 2006-02-16. Completion date: 2006-03-24.
HR REDMOND INC (CROW CREEK HIGHWAY MILE 1; small business) 4 employees, $425000 revenue.
$22,750 with Forest Service for Construction of Structures and Facilities -- Recreation Facilities (Non-Building). Signed on 2003-06-15. Completion date: 2003-06-15.
GRAHAM KEN PHOTO AGENCY (1A BLOCK 15 ALYESKA AVE; small business)
$14,000 with Forest Service (disused code: now 12C2) for General Photographic Services - Still. Signed on 2000-07-15. Completion date: 2000-12-15.
MIDNIGHT SUN COMMUNICATIONS (5000 ALYESKA HWY; small business)
$122 with U.S. Army Corps of Engineers - civil program financing only for Advertising Services. Signed on 2003-03-26. Completion date: 2003-03-27.
Top industries in this zip code by the number of employees in 2005:
Accommodation and Food Services: Hotels (except Casino Hotels) and Motels (250-499 employees: 1 establishment)
Accommodation and Food Services: Full-Service Restaurants (20-49: 2, 10-19: 1)
Arts, Entertainment, and Recreation: All Other Amusement and Recreation Industries (20-49: 1, 10-19: 2, 1-4: 5)
Arts, Entertainment, and Recreation: Skiing Facilities (20-49: 1, 10-19: 1)
Accommodation and Food Services: Limited-Service Restaurants (10-19: 2, 5-9: 1)
Administrative and Support and Waste Management and Remediation Services: All Other Support Services (20-49: 1)
Construction: New Single-Family Housing Construction (except Operative Builders) (10-19: 1, 5-9: 1, 1-4: 3)
People in group quarters in 2010:
4 people in workers' group living quarters and job corps centers
Fatal accident statistics in 2014:
Fatal accident count: 1
Vehicles involved in fatal accidents: 1
Fatal accidents caused by drunken drivers: 1
Fatalities: 1
Persons involved in fatal accidents: 2
Pedestrians involved in fatal accidents: 0
Fatal accident statistics in 2012:
Fatal accident count: 1
Vehicles involved in fatal accidents: 3
Fatal accidents caused by drunken drivers: 0
Fatalities: 1
Persons involved in fatal accidents: 2
Pedestrians involved in fatal accidents: 1
Home Mortgage Disclosure Act Aggregated Statistics For Year 2009 (Based on 2 partial tracts)
A) FHA, FSA/RHS & VA Home Purchase Loans
B) Conventional Home Purchase Loans
C) Refinancings
D) Home Improvement Loans
F) Non-occupant Loans on < 5 Family Dwellings (A B C & D)
Number
Average Value
Number
Average Value
Number
Average Value
Number
Average Value
Number
Average Value
LOANS ORIGINATED
7
$285,351
42
$263,716
145
$255,859
5
$159,334
61
$237,034
APPLICATIONS APPROVED, NOT ACCEPTED
0
$0
1
$554,210
12
$246,892
0
$0
3
$414,887
APPLICATIONS DENIED
1
$195,130
7
$265,889
37
$244,526
2
$129,890
12
$203,306
APPLICATIONS WITHDRAWN
1
$354,460
8
$208,405
33
$267,447
1
$310,590
14
$220,364
FILES CLOSED FOR INCOMPLETENESS
0
$0
0
$0
5
$181,042
1
$57,730
2
$198,015
Aggregated Statistics For Year 2008 (Based on 2 partial tracts)
A) FHA, FSA/RHS & VA Home Purchase Loans
B) Conventional Home Purchase Loans
C) Refinancings
D) Home Improvement Loans
F) Non-occupant Loans on < 5 Family Dwellings (A B C & D)
Number
Average Value
Number
Average Value
Number
Average Value
Number
Average Value
Number
Average Value
LOANS ORIGINATED
5
$202,516
46
$256,723
76
$257,461
5
$155,640
48
$242,947
APPLICATIONS APPROVED, NOT ACCEPTED
1
$371,780
2
$262,095
7
$138,221
0
$0
6
$188,777
APPLICATIONS DENIED
1
$196,280
2
$498,785
15
$250,625
3
$43,873
6
$209,752
APPLICATIONS WITHDRAWN
0
$0
15
$220,837
22
$285,081
1
$346,380
16
$241,961
FILES CLOSED FOR INCOMPLETENESS
0
$0
2
$219,375
3
$234,000
0
$0
1
$112,000
Aggregated Statistics For Year 2007 (Based on 2 partial tracts)
A) FHA, FSA/RHS & VA Home Purchase Loans
B) Conventional Home Purchase Loans
C) Refinancings
D) Home Improvement Loans
F) Non-occupant Loans on < 5 Family Dwellings (A B C & D)
Number
Average Value
Number
Average Value
Number
Average Value
Number
Average Value
Number
Average Value
LOANS ORIGINATED
2
$208,405
100
$230,158
60
$265,981
9
$181,400
65
$223,211
APPLICATIONS APPROVED, NOT ACCEPTED
0
$0
7
$270,836
7
$228,116
3
$265,943
6
$200,323
APPLICATIONS DENIED
0
$0
16
$319,463
21
$295,083
8
$130,759
3
$282,493
APPLICATIONS WITHDRAWN
0
$0
13
$282,699
15
$297,810
0
$0
10
$342,223
FILES CLOSED FOR INCOMPLETENESS
0
$0
0
$0
6
$274,795
2
$202,055
0
$0
Aggregated Statistics For Year 2006 (Based on 2 partial tracts)
B) Conventional Home Purchase Loans
C) Refinancings
D) Home Improvement Loans
F) Non-occupant Loans on < 5 Family Dwellings (A B C & D)
Number
Average Value
Number
Average Value
Number
Average Value
Number
Average Value
LOANS ORIGINATED
102
$201,523
67
$240,364
9
$112,638
80
$191,649
APPLICATIONS APPROVED, NOT ACCEPTED
6
$189,547
8
$280,856
1
$177,810
3
$321,750
APPLICATIONS DENIED
14
$195,375
29
$228,412
7
$70,926
12
$175,980
APPLICATIONS WITHDRAWN
22
$198,434
18
$233,357
3
$215,527
14
$251,373
FILES CLOSED FOR INCOMPLETENESS
2
$277,105
2
$242,465
1
$46,180
1
$92,370
Aggregated Statistics For Year 2005 (Based on 2 partial tracts)
A) FHA, FSA/RHS & VA Home Purchase Loans
B) Conventional Home Purchase Loans
C) Refinancings
D) Home Improvement Loans
F) Non-occupant Loans on < 5 Family Dwellings (A B C & D)
Number
Average Value
Number
Average Value
Number
Average Value
Number
Average Value
Number
Average Value
LOANS ORIGINATED
2
$262,670
58
$198,949
67
$201,969
7
$65,647
43
$169,941
APPLICATIONS APPROVED, NOT ACCEPTED
0
$0
6
$214,370
8
$168,716
1
$23,090
5
$133,702
APPLICATIONS DENIED
0
$0
8
$267,145
24
$221,202
5
$173,420
10
$182,889
APPLICATIONS WITHDRAWN
0
$0
10
$279,067
6
$212,447
3
$180,117
5
$199,284
FILES CLOSED FOR INCOMPLETENESS
0
$0
0
$0
5
$122,618
0
$0
1
$286,340
Aggregated Statistics For Year 2004 (Based on 2 partial tracts)
A) FHA, FSA/RHS & VA Home Purchase Loans
B) Conventional Home Purchase Loans
C) Refinancings
D) Home Improvement Loans
F) Non-occupant Loans on < 5 Family Dwellings (A B C & D)
Number
Average Value
Number
Average Value
Number
Average Value
Number
Average Value
Number
Average Value
LOANS ORIGINATED
3
$200,900
84
$166,991
97
$162,001
6
$77,935
62
$147,882
APPLICATIONS APPROVED, NOT ACCEPTED
0
$0
3
$220,143
18
$162,991
0
$0
2
$149,520
APPLICATIONS DENIED
1
$192,820
5
$261,402
23
$138,653
5
$67,660
5
$149,406
APPLICATIONS WITHDRAWN
0
$0
10
$166,031
14
$170,799
6
$98,718
5
$96,294
FILES CLOSED FOR INCOMPLETENESS
0
$0
1
$110,840
8
$159,190
0
$0
2
$72,160
Aggregated Statistics For Year 2003 (Based on 2 partial tracts)
A) FHA, FSA/RHS & VA Home Purchase Loans
B) Conventional Home Purchase Loans
C) Refinancings
D) Home Improvement Loans
E) Loans on Dwellings For 5+ Families
F) Non-occupant Loans on < 5 Family Dwellings (A B C & D)
Number
Average Value
Number
Average Value
Number
Average Value
Number
Average Value
Number
Average Value
Number
Average Value
LOANS ORIGINATED
13
$172,568
79
$144,690
186
$168,845
6
$58,115
1
$244,780
72
$126,589
APPLICATIONS APPROVED, NOT ACCEPTED
1
$251,700
3
$126,237
9
$132,394
0
$0
0
$0
5
$73,202
APPLICATIONS DENIED
0
$0
6
$136,820
31
$144,474
1
$15,010
0
$0
9
$100,707
APPLICATIONS WITHDRAWN
7
$166,263
16
$192,602
36
$132,907
1
$46,180
0
$0
12
$166,358
FILES CLOSED FOR INCOMPLETENESS
1
$256,320
1
$115,460
5
$99,296
1
$28,860
0
$0
2
$101,605
Aggregated Statistics For Year 2002 (Based on 2 partial tracts)
A) FHA, FSA/RHS & VA Home Purchase Loans
B) Conventional Home Purchase Loans
C) Refinancings
D) Home Improvement Loans
E) Loans on Dwellings For 5+ Families
F) Non-occupant Loans on < 5 Family Dwellings (A B C & D)
Number
Average Value
Number
Average Value
Number
Average Value
Number
Average Value
Number
Average Value
Number
Average Value
LOANS ORIGINATED
7
$109,521
70
$125,769
137
$155,458
9
$33,483
1
$600,390
47
$98,632
APPLICATIONS APPROVED, NOT ACCEPTED
0
$0
3
$283,647
12
$234,480
0
$0
0
$0
2
$143,750
APPLICATIONS DENIED
0
$0
5
$173,420
16
$142,232
1
$115,460
0
$0
1
$195,130
APPLICATIONS WITHDRAWN
1
$152,410
6
$238,425
16
$182,210
1
$20,780
0
$0
3
$90,830
FILES CLOSED FOR INCOMPLETENESS
0
$0
0
$0
1
$152,410
0
$0
0
$0
0
$0
Aggregated Statistics For Year 2001 (Based on 2 partial tracts)
A) FHA, FSA/RHS & VA Home Purchase Loans
B) Conventional Home Purchase Loans
C) Refinancings
D) Home Improvement Loans
F) Non-occupant Loans on < 5 Family Dwellings (A B C & D)
Number
Average Value
Number
Average Value
Number
Average Value
Number
Average Value
Number
Average Value
LOANS ORIGINATED
21
$119,144
53
$121,734
81
$159,207
9
$65,299
38
$138,917
APPLICATIONS APPROVED, NOT ACCEPTED
0
$0
2
$96,410
7
$142,181
1
$57,730
3
$112,380
APPLICATIONS DENIED
1
$85,440
9
$98,269
5
$171,574
3
$35,793
2
$49,070
APPLICATIONS WITHDRAWN
3
$179,733
3
$196,283
14
$167,334
0
$0
2
$90,635
FILES CLOSED FOR INCOMPLETENESS
0
$0
3
$129,317
3
$122,773
3
$57,730
1
$73,890
Aggregated Statistics For Year 2000 (Based on 2 partial tracts)
A) FHA, FSA/RHS & VA Home Purchase Loans
B) Conventional Home Purchase Loans
C) Refinancings
D) Home Improvement Loans
E) Loans on Dwellings For 5+ Families
F) Non-occupant Loans on < 5 Family Dwellings (A B C & D)
Number
Average Value
Number
Average Value
Number
Average Value
Number
Average Value
Number
Average Value
Number
Average Value
LOANS ORIGINATED
13
$126,739
52
$132,735
17
$90,806
6
$25,017
3
$1,135,357
24
$91,165
APPLICATIONS APPROVED, NOT ACCEPTED
1
$160,490
1
$300,200
1
$390,250
3
$20,397
0
$0
2
$164,530
APPLICATIONS DENIED
1
$95,830
10
$165,685
8
$124,696
1
$8,080
0
$0
6
$132,010
APPLICATIONS WITHDRAWN
10
$157,026
15
$182,273
7
$115,624
3
$13,470
0
$0
3
$143,170
FILES CLOSED FOR INCOMPLETENESS
0
$0
0
$0
1
$57,730
0
$0
0
$0
0
$0
Aggregated Statistics For Year 1999 (Based on 1 partial tract)
A) FHA, FSA/RHS & VA Home Purchase Loans
B) Conventional Home Purchase Loans
C) Refinancings
D) Home Improvement Loans
E) Loans on Dwellings For 5+ Families
F) Non-occupant Loans on < 5 Family Dwellings (A B C & D)
Detailed PMIC statistics for the following Tracts:0029.00
2002 - 2018 National Fire Incident Reporting System (NFIRS) incidents
According to the data from the years 2002 - 2018 the average number of fire incidents per year is 17. The highest number of fires - 29 took place in 2003, and the least - 9 in 2010. The data has a growing trend.
When looking into fire subcategories, the most incidents belonged to: Structure Fires (39.8%), and Outside Fires (31.7%).
Fire incident types reported to NFIRS in Zip Code 99587


 Nearest zip codes: 99567, 99577, 99540, 99645, 99605, 99631.


 (Students: 153, Location: 680 HIGHTOWER, Grades: KG-8)


 According to the data from the years 2002 - 2018 the average number of fire incidents per year is 17. The highest number of fires - 29 took place in 2003, and the least - 9 in 2010. The data has a growing trend.
 When looking into fire subcategories, the most incidents belonged to: Structure Fires (39.8%), and Outside Fires (31.7%).