St. Paul Park, Minnesota
Submit your own pictures of this city and show them to the world
- OSM Map
- General Map
- Google Map
- MSN Map
Population change since 2000: +7.0%
 |
| Males: 2,979 | |
| Females: 2,448 |
| Median resident age: | 38.9 years |
| Minnesota median age: | 39.0 years |
Zip codes: 55071.
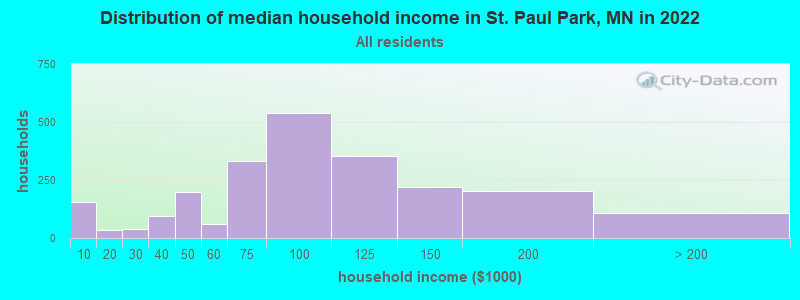
| St. Paul Park: | $89,145 |
| MN: | $82,338 |
Estimated per capita income in 2022: $38,702 (it was $20,234 in 2000)
St. Paul Park city income, earnings, and wages data
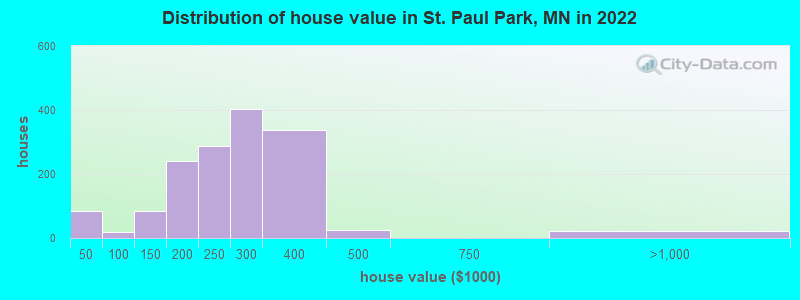
Estimated median house or condo value in 2022: $267,095 (it was $104,100 in 2000)
| St. Paul Park: | $267,095 |
| MN: | $314,600 |
Mean prices in 2022: all housing units: $422,317; detached houses: $463,507; townhouses or other attached units: $277,768; in 2-unit structures: $335,333; in 3-to-4-unit structures: $207,045; in 5-or-more-unit structures: $257,560; mobile homes: $38,327
Median gross rent in 2022: $1,747.
Detailed information about poverty and poor residents in St. Paul Park, MN
Compare current foreclosures near St. Paul Park, MN:
| Photo | Address | Area | Beds / Baths | Price | Details |
|---|---|---|---|---|---|

|
#1
Maple Island Rd
Burnsville, MN 55306
|
1,302 sq. feet
|
2 baths 2 beds |
$294,900
|
show details |

|
#2
Parklawn Ave Apt 109
Minneapolis, MN 55435
|
1,121 sq. feet
|
2 baths 2 beds |
$105,000
|
show details |

|
#3
26th Ave S
Minneapolis, MN 55406
|
1,232 sq. feet
|
1 baths 2 beds |
$309,900
|
show details |

|
#4
Granite St
Saint Paul, MN 55117
|
2,136 sq. feet
|
2 baths 4 beds |
$172,000
|
show details |

|
#5
Groveland Ave Apt 1708
Minneapolis, MN 55403
|
739 sq. feet
|
1 baths 1 beds |
$93,100
|
show details |

|
#6
1st Ave S
Minneapolis, MN 55408
|
1,932 sq. feet
|
2 baths 3 beds |
$354,900
|
show details |

|
#7
English Ave
Farmington, MN 55024
|
1,440 sq. feet
|
3 baths 2 beds |
$254,900
|
show details |

|
#8
76th Street E. Unit
Inver Grove Heights, MN 55076
|
1,048 sq. feet
|
2 baths 2 beds |
$219,900
|
show details |

|
#9
York Ave S Apt 122
Minneapolis, MN 55435
|
956 sq. feet
|
1 baths 1 beds |
$157,000
|
show details |

|
#10
Charles Ave
Saint Paul, MN 55103
|
906 sq. feet
|
1 baths 2 beds |
$224,500
|
show details |
| Photo | Address | Area | Beds / Baths | Price | Details |
|---|---|---|---|---|---|

|
#11
Wacouta St Unit Unit Gl-D
Saint Paul, MN 55101
|
- sq. feet
|
1 baths 1 beds |
$179,900
|
show details |

|
#12
Lake Shore Dr S Apt 1012
Minneapolis, MN 55423
|
1,040 sq. feet
|
1 baths 2 beds |
show details | |

|
#13
Mulberry Bay
Saint Paul, MN 55129
|
1,500 sq. feet
|
2 baths 2 beds |
show details | |

|
#14
Bedford St
Saint Paul, MN 55130
|
- sq. feet
|
1 baths 3 beds |
show details | |

|
#15
Fox Ridge Rd
Saint Paul, MN 55122
|
2,181 sq. feet
|
2 baths 3 beds |
show details | |

|
#16
Gerdine Path W
Rosemount, MN 55068
|
1,110 sq. feet
|
1 baths 3 beds |
show details | |

|
#17
Walnut St
Farmington, MN 55024
|
2,010 sq. feet
|
2 baths 4 beds |
show details | |

|
#18
Breen St
Saint Paul, MN 55106
|
1,785 sq. feet
|
2 baths 5 beds |
show details | |

|
#19
Hurley Ave E
Saint Paul, MN 55118
|
1,041 sq. feet
|
1 baths 2 beds |
show details | |

|
#20
Bedford St
Saint Paul, MN 55130
|
1,627 sq. feet
|
2 baths 4 beds |
show details |
| Photo | Address | Area | Beds / Baths | Price | Details |
|---|---|---|---|---|---|

|
#21
Jewel Ave S
Cottage Grove, MN 55016
|
1,308 sq. feet
|
2 baths 3 beds |
show details | |

|
#22
Laurel Ave
Saint Paul, MN 55102
|
1,595 sq. feet
|
3 baths 4 beds |
show details | |

|
#23
W Bloomington Fwy
Minneapolis, MN 55431
|
880 sq. feet
|
2 baths 1 beds |
show details | |

|
#24
Benson Ave Apt H
Saint Paul, MN 55116
|
883 sq. feet
|
2 baths 2 beds |
show details | |

|
#25
White Bear Pkwy # 2107
Saint Paul, MN 55110
|
941 sq. feet
|
1 baths 2 beds |
show details | |

|
#26
Van Buren Ave
Saint Paul, MN 55104
|
1,965 sq. feet
|
2 baths 5 beds |
show details | |

|
#27
41st Ave S
Minneapolis, MN 55406
|
1,504 sq. feet
|
2 baths 3 beds |
show details | |

|
#28
Hall Ave
Saint Paul, MN 55118
|
924 sq. feet
|
1 baths 2 beds |
show details | |

|
#29
Winnipeg Ave
Saint Paul, MN 55117
|
1,487 sq. feet
|
1 baths 3 beds |
show details | |

|
#30
Ohio St
Saint Paul, MN 55118
|
1,002 sq. feet
|
2 baths 3 beds |
show details |
| Photo | Address | Area | Beds / Baths | Price | Details |
|---|---|---|---|---|---|

|
#31
Fremont Ave
Saint Paul, MN 55106
|
1,232 sq. feet
|
1 baths 3 beds |
show details | |

|
#32
Ohio St
Saint Paul, MN 55118
|
1,715 sq. feet
|
2 baths 3 beds |
show details | |

|
#33
187th St W
Farmington, MN 55024
|
1,712 sq. feet
|
2 baths 3 beds |
show details | |

|
#34
White Bear Ave N
Saint Paul, MN 55110
|
1,618 sq. feet
|
3 baths 3 beds |
show details | |

|
#35
Frattalone Ln
Saint Paul, MN 55117
|
1,825 sq. feet
|
3 baths 2 beds |
show details | |

|
#36
Wells St
Saint Paul, MN 55130
|
1,302 sq. feet
|
2 baths 4 beds |
show details | |

|
#37
Hawthorne Ave E
Saint Paul, MN 55130
|
1,050 sq. feet
|
3 baths 3 beds |
show details | |

|
#38
Blaisdell Ave Apt 409
Minneapolis, MN 55404
|
571 sq. feet
|
1 baths 1 beds |
show details | |

|
#39
Portland Ave
Minneapolis, MN 55407
|
840 sq. feet
|
1 baths 2 beds |
show details | |

|
#40
Maryland Ave E
Saint Paul, MN 55106
|
1,376 sq. feet
|
1 baths 4 beds |
show details |
| Photo | Address | Area | Beds / Baths | Price | Details |
|---|---|---|---|---|---|

|
#41
Lower 161st St W
Rosemount, MN 55068
|
1,227 sq. feet
|
2 baths 4 beds |
show details | |

|
#42
Livingston Ave
Saint Paul, MN 55118
|
1,140 sq. feet
|
2 baths 3 beds |
show details | |

|
#43
Geranium Ave E
Saint Paul, MN 55130
|
2,112 sq. feet
|
2 baths 6 beds |
show details | |

|
#44
Stevens Ave S
Minneapolis, MN 55420
|
1,109 sq. feet
|
1 baths 3 beds |
show details | |

|
#45
Portland Ave Apt 302
Minneapolis, MN 55404
|
780 sq. feet
|
1 baths 2 beds |
show details | |

|
#46
Rosemary Curv
Hudson, WI 54016
|
1,659 sq. feet
|
2 baths 3 beds |
show details | |

|
#47
Janero Ave S
Cottage Grove, MN 55016
|
1,040 sq. feet
|
1 baths 2 beds |
show details | |

|
#48
Marion St
Saint Paul, MN 55117
|
1,078 sq. feet
|
2 baths 3 beds |
show details | |

|
#49
Lockridge Ave S
Hastings, MN 55033
|
2,209 sq. feet
|
2 baths 4 beds |
show details | |

|
Check over 1 million property listings on Foreclosure.com!
|
browse all offers | |||


- 4,11372.9%White alone
- 71112.6%Hispanic
- 4568.1%Asian alone
- 1673.0%Black alone
- 1693.0%Two or more races
- 150.3%American Indian alone
- 180.3%Native Hawaiian and Other
Pacific Islander alone
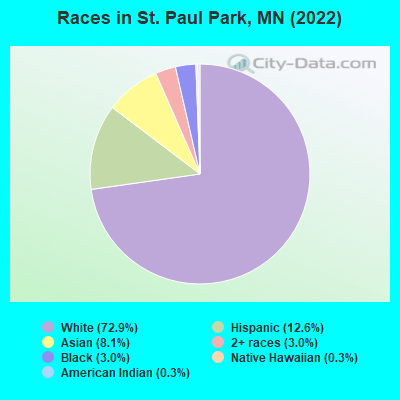
Races in St. Paul Park detailed stats: ancestries, foreign born residents, place of birth
Type |
2009 |
2010 |
2011 |
2012 |
2013 |
2014 |
2015 |
2016 |
2017 |
2018 |
2019 |
2020 |
2021 |
2022 |
|---|---|---|---|---|---|---|---|---|---|---|---|---|---|---|
| Murders (per 100,000) | 0 (0.0) | 0 (0.0) | 0 (0.0) | 0 (0.0) | 1 (18.7) | 0 (0.0) | 0 (0.0) | 0 (0.0) | 0 (0.0) | 1 (18.5) | 0 (0.0) | 0 (0.0) | 0 (0.0) | 0 (0.0) |
| Rapes (per 100,000) | 2 (38.1) | 1 (18.9) | 1 (18.8) | 2 (37.1) | 0 (0.0) | 2 (37.4) | 1 (18.6) | 4 (74.1) | 2 (37.1) | 1 (18.5) | 1 (18.5) | 1 (18.6) | 1 (18.7) | 3 (55.3) |
| Robberies (per 100,000) | 3 (57.1) | 0 (0.0) | 1 (18.8) | 0 (0.0) | 2 (37.5) | 3 (56.1) | 2 (37.1) | 2 (37.0) | 0 (0.0) | 0 (0.0) | 1 (18.5) | 0 (0.0) | 1 (18.7) | 2 (36.8) |
| Assaults (per 100,000) | 7 (133.2) | 5 (94.7) | 9 (169.2) | 4 (74.3) | 12 (224.9) | 7 (130.9) | 6 (111.4) | 4 (74.1) | 6 (111.2) | 4 (74.0) | 9 (166.4) | 5 (93.0) | 8 (149.3) | 0 (0.0) |
| Burglaries (per 100,000) | 49 (932.3) | 23 (435.7) | 34 (639.1) | 36 (668.6) | 27 (506.1) | 16 (299.3) | 10 (185.6) | 21 (389.0) | 16 (296.4) | 12 (221.9) | 20 (369.7) | 18 (334.9) | 5 (93.3) | 8 (147.4) |
| Thefts (per 100,000) | 53 (1,008) | 106 (2,008) | 109 (2,049) | 154 (2,860) | 95 (1,781) | 90 (1,684) | 79 (1,466) | 102 (1,889) | 104 (1,927) | 75 (1,387) | 121 (2,237) | 42 (781.5) | 49 (914.3) | 31 (571.0) |
| Auto thefts (per 100,000) | 10 (190.3) | 5 (94.7) | 11 (206.8) | 16 (297.2) | 11 (206.2) | 11 (205.8) | 11 (204.2) | 17 (314.9) | 10 (185.3) | 13 (240.3) | 11 (203.3) | 13 (241.9) | 12 (223.9) | 13 (239.5) |
| Arson (per 100,000) | 1 (19.0) | 0 (0.0) | 3 (56.4) | 1 (18.6) | 1 (18.7) | 0 (0.0) | 2 (37.1) | 1 (18.5) | 0 (0.0) | 0 (0.0) | 1 (18.5) | 1 (18.6) | 0 (0.0) | 1 (18.4) |
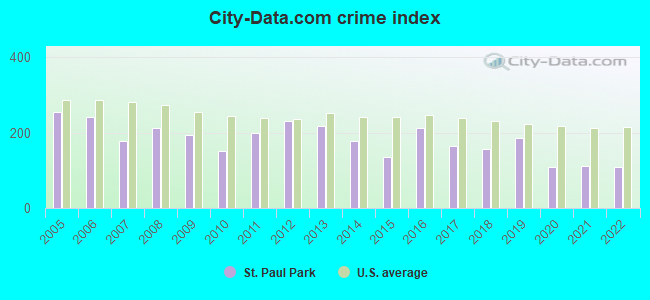
| City-Data.com crime index | 195.0 | 152.5 | 197.7 | 229.6 | 216.9 | 177.7 | 136.2 | 213.2 | 164.5 | 156.8 | 185.2 | 107.6 | 111.4 | 107.6 |
The City-Data.com crime index weighs serious crimes and violent crimes more heavily. Higher means more crime, U.S. average is 246.1. It adjusts for the number of visitors and daily workers commuting into cities.
Crime rate in St. Paul Park detailed stats: murders, rapes, robberies, assaults, burglaries, thefts, arson
Full-time law enforcement employees in 2021, including police officers: 8 (8 officers - 6 male; 2 female).
| Officers per 1,000 residents here: | 1.49 |
| Minnesota average: | 1.76 |
 Recent articles from our blog. Our writers, many of them Ph.D. graduates or candidates, create easy-to-read articles on a wide variety of topics.

 | Cottage Grove , MN 2022 (5 replies) |
| any suburbs of St. Paul with a downtown? (5 replies) |
| Twin Cities - 16th largest metro area in the Country, can you feel it? (90 replies) |
| Is It Really That Hard to Make Friends in Minnesota? (294 replies) |
| St. Paul Park, MN (8 replies) |
| St. Paul Park (4 replies) |
Latest news from St. Paul Park, MN collected exclusively by city-data.com from local newspapers, TV, and radio stations
Ancestries: German (19.0%), Norwegian (6.5%), Scandinavian (6.5%), Polish (3.8%), European (3.7%), Irish (3.2%).
Current Local Time: CST time zone
Elevation: 780 feet
Land area: 2.38 square miles.
Population density: 2,282 people per square mile (low).
431 residents are foreign born (3.1% Asia, 2.3% Latin America, 1.0% Africa).
| This city: | 7.6% |
| Minnesota: | 8.5% |
Median real estate property taxes paid for housing units with mortgages in 2022: $2,611 (0.9%)
Median real estate property taxes paid for housing units with no mortgage in 2022: $2,927 (1.3%)
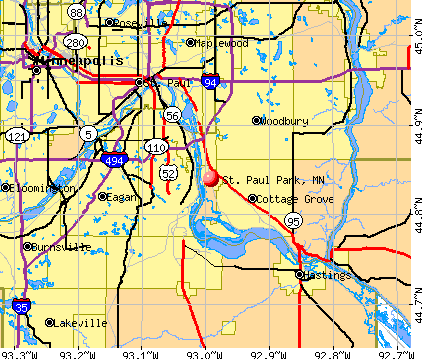
Nearest city with pop. 50,000+: Eagan, MN  (8.9 miles , pop. 63,557).
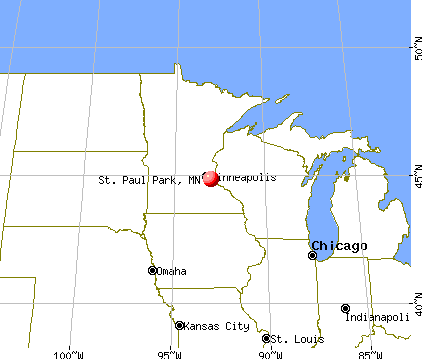
Nearest city with pop. 200,000+: St. Paul, MN (10.0 miles , pop. 287,151).
Nearest city with pop. 1,000,000+: Chicago, IL (338.2 miles , pop. 2,896,016).
Nearest cities:
), ), )Latitude: 44.84 N, Longitude: 92.99 W
Daytime population change due to commuting: -1,473 (-26.1%)
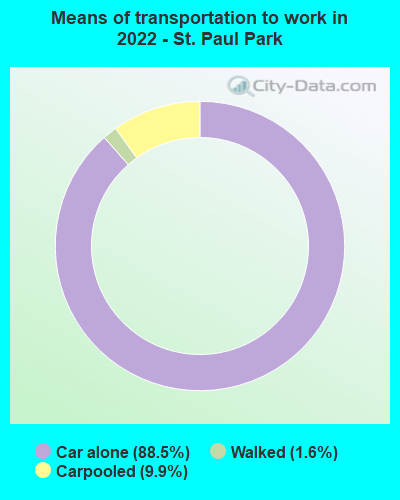
Workers who live and work in this city: 620 (19.7%)
St. Paul Park, Minnesota accommodation & food services, waste management - Economy and Business Data
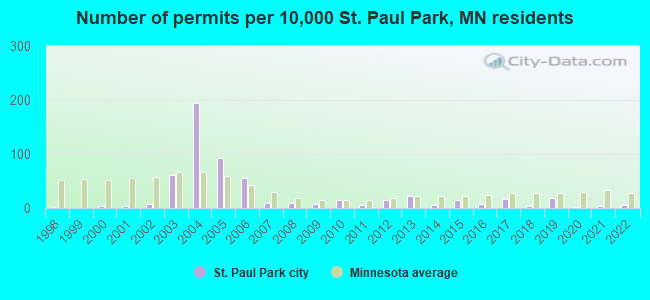
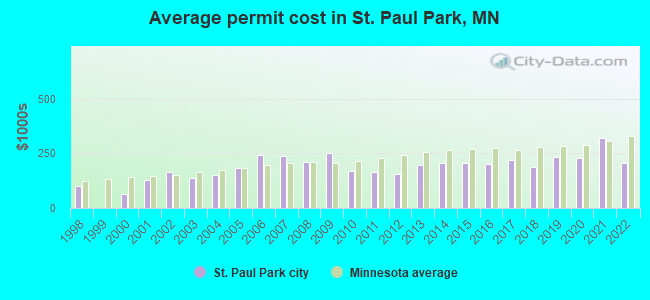
Single-family new house construction building permits:
- 2022: 3 buildings, average cost: $207,000
- 2021: 2 buildings, average cost: $318,600
- 2020: 1 building, cost: $230,000
- 2019: 9 buildings, average cost: $232,900
- 2018: 2 buildings, average cost: $189,200
- 2017: 8 buildings, average cost: $220,700
- 2016: 4 buildings, average cost: $198,600
- 2015: 7 buildings, average cost: $203,500
- 2014: 3 buildings, average cost: $207,000
- 2013: 11 buildings, average cost: $195,100
- 2012: 7 buildings, average cost: $154,000
- 2011: 3 buildings, average cost: $165,400
- 2010: 7 buildings, average cost: $171,200
- 2009: 4 buildings, average cost: $250,000
- 2008: 5 buildings, average cost: $211,700
- 2007: 5 buildings, average cost: $239,000
- 2006: 28 buildings, average cost: $241,400
- 2005: 47 buildings, average cost: $184,400
- 2004: 99 buildings, average cost: $151,700
- 2003: 31 buildings, average cost: $135,300
- 2002: 4 buildings, average cost: $166,100
- 2001: 2 buildings, average cost: $129,400
- 2000: 2 buildings, average cost: $61,500
- 1998: 1 building, cost: $100,000
| Here: | 2.1% |
| Minnesota: | 2.6% |
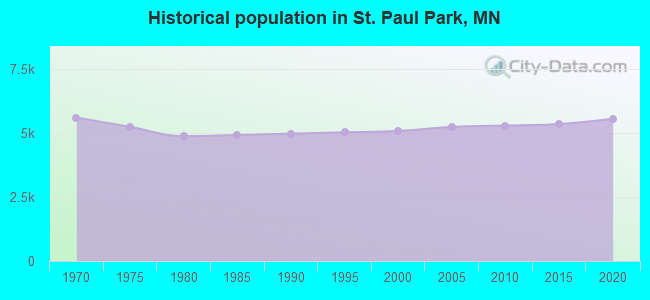
Population change in the 1990s: +58 (+1.2%).
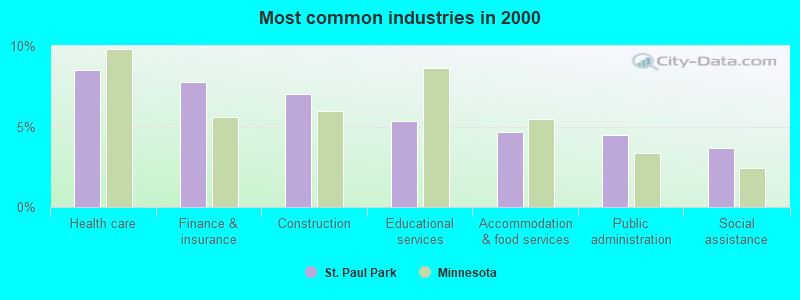
- Health care (8.5%)
- Finance & insurance (7.7%)
- Construction (7.0%)
- Educational services (5.3%)
- Accommodation & food services (4.7%)
- Public administration (4.5%)
- Social assistance (3.7%)
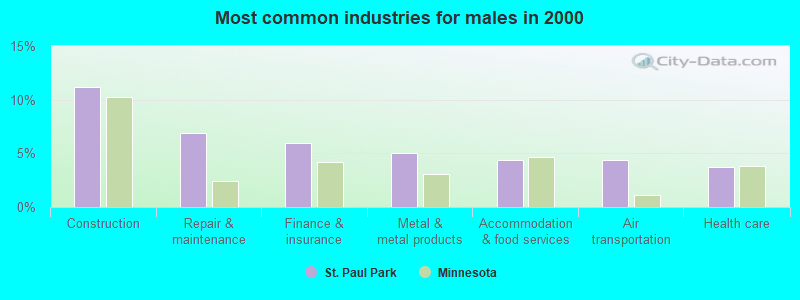
- Construction (11.2%)
- Repair & maintenance (6.8%)
- Finance & insurance (6.0%)
- Metal & metal products (5.0%)
- Accommodation & food services (4.4%)
- Air transportation (4.3%)
- Health care (3.7%)
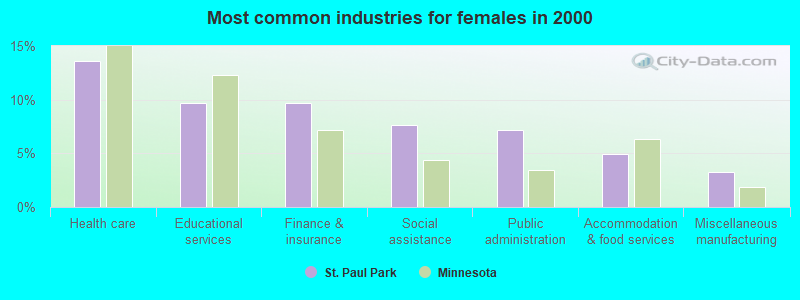
- Health care (13.6%)
- Educational services (9.7%)
- Finance & insurance (9.6%)
- Social assistance (7.6%)
- Public administration (7.2%)
- Accommodation & food services (4.9%)
- Miscellaneous manufacturing (3.2%)
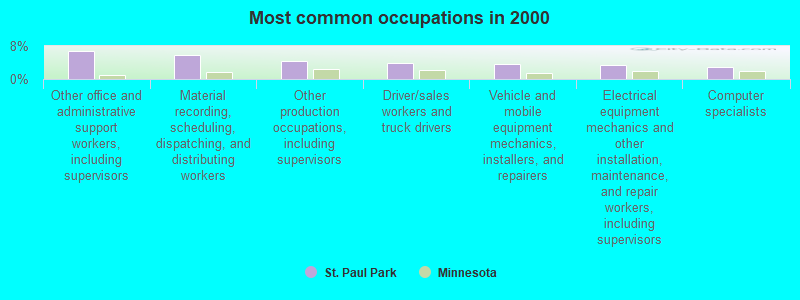
- Other office and administrative support workers, including supervisors (6.8%)
- Material recording, scheduling, dispatching, and distributing workers (5.8%)
- Other production occupations, including supervisors (4.3%)
- Driver/sales workers and truck drivers (3.9%)
- Vehicle and mobile equipment mechanics, installers, and repairers (3.7%)
- Electrical equipment mechanics and other installation, maintenance, and repair workers, including supervisors (3.3%)
- Computer specialists (3.0%)

- Driver/sales workers and truck drivers (7.5%)
- Vehicle and mobile equipment mechanics, installers, and repairers (7.2%)
- Electrical equipment mechanics and other installation, maintenance, and repair workers, including supervisors (6.4%)
- Material recording, scheduling, dispatching, and distributing workers (5.9%)
- Metal workers and plastic workers (5.4%)
- Other production occupations, including supervisors (4.7%)
- Computer specialists (4.6%)
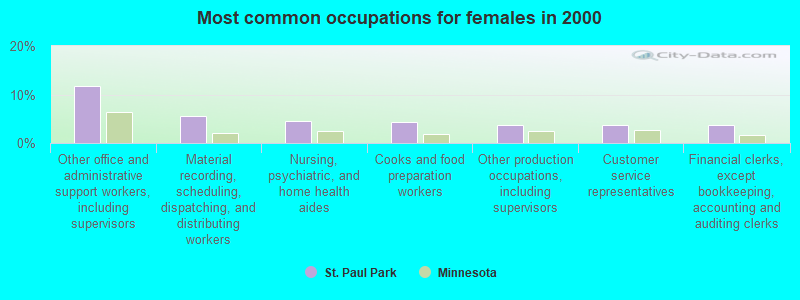
- Other office and administrative support workers, including supervisors (11.8%)
- Material recording, scheduling, dispatching, and distributing workers (5.6%)
- Nursing, psychiatric, and home health aides (4.5%)
- Cooks and food preparation workers (4.2%)
- Other production occupations, including supervisors (3.8%)
- Customer service representatives (3.8%)
- Financial clerks, except bookkeeping, accounting and auditing clerks (3.8%)
Average climate in St. Paul Park, Minnesota
Based on data reported by over 4,000 weather stations


|
|


(lower is better)
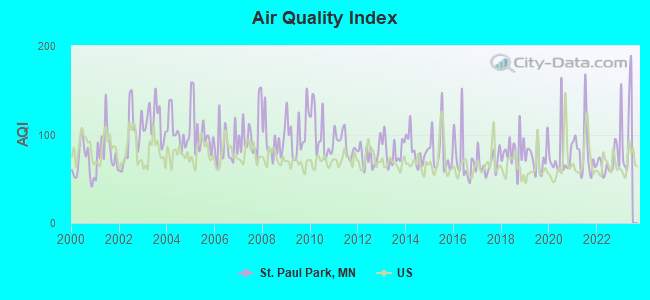
Air Quality Index (AQI) level in 2022 was 67.6. This is about average.
| City: | 67.6 |
| U.S.: | 72.6 |
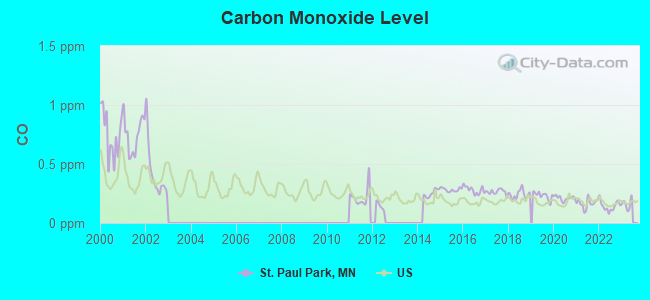
Carbon Monoxide (CO) [ppm] level in 2022 was 0.144. This is significantly better than average. Closest monitor was 5.6 miles away from the city center.
| City: | 0.144 |
| U.S.: | 0.251 |
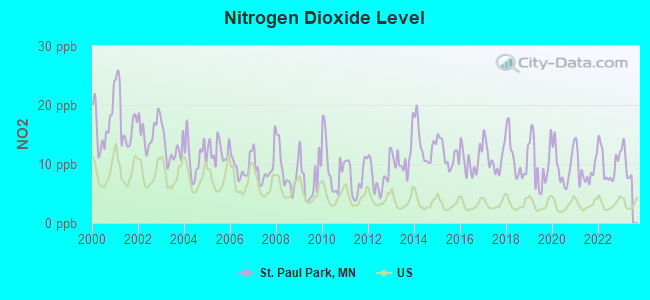
Nitrogen Dioxide (NO2) [ppb] level in 2022 was 9.96. This is significantly worse than average. Closest monitor was 0.6 miles away from the city center.
| City: | 9.96 |
| U.S.: | 5.11 |
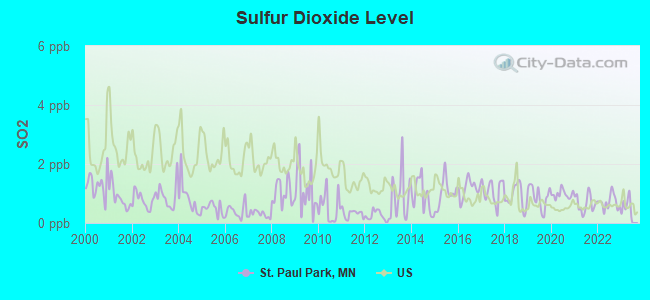
Sulfur Dioxide (SO2) [ppb] level in 2022 was 0.710. This is significantly better than average. Closest monitor was 0.5 miles away from the city center.
| City: | 0.710 |
| U.S.: | 1.515 |
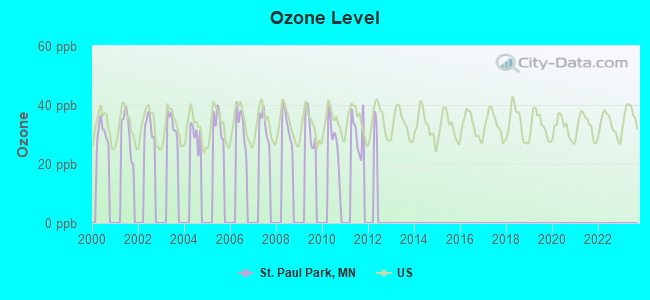
Ozone [ppb] level in 2011 was 30.8. This is about average. Closest monitor was 8.0 miles away from the city center.
| City: | 30.8 |
| U.S.: | 33.3 |
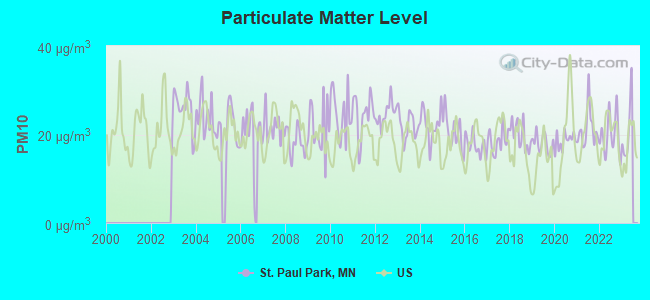
Particulate Matter (PM10) [µg/m3] level in 2022 was 19.9. This is about average. Closest monitor was 0.5 miles away from the city center.
| City: | 19.9 |
| U.S.: | 19.2 |
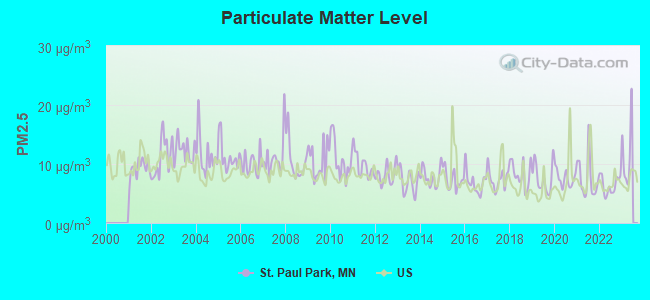
Particulate Matter (PM2.5) [µg/m3] level in 2022 was 6.41. This is better than average. Closest monitor was 7.1 miles away from the city center.
| City: | 6.41 |
| U.S.: | 8.11 |
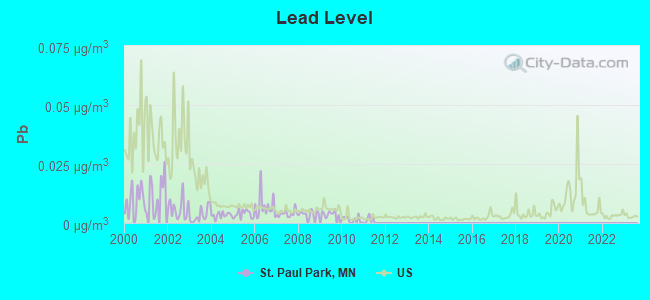
Lead (Pb) [µg/m3] level in 2010 was 0.00141. This is significantly better than average. Closest monitor was 0.5 miles away from the city center.
| City: | 0.00141 |
| U.S.: | 0.00931 |
Tornado activity:
St. Paul Park-area historical tornado activity is slightly above Minnesota state average. It is 31% greater than the overall U.S. average.
On 6/4/1958, a category F5 (max. wind speeds 261-318 mph) tornado 32.7 miles away from the St. Paul Park city center killed 21 people and injured 74 people and caused between $5,000,000 and $50,000,000 in damages.
On 5/6/1965, a category F4 (max. wind speeds 207-260 mph) tornado 19.3 miles away from the city center killed 3 people and injured 175 people and caused between $5,000,000 and $50,000,000 in damages.
Earthquake activity:
St. Paul Park-area historical earthquake activity is significantly above Minnesota state average. It is 58% smaller than the overall U.S. average.On 7/9/1975 at 14:54:15, a magnitude 4.6 (4.6 MB, Class: Light, Intensity: IV - V) earthquake occurred 159.2 miles away from the city center
On 6/5/1993 at 01:24:53, a magnitude 4.1 (4.1 LG, Depth: 6.2 mi) earthquake occurred 170.8 miles away from the city center
On 3/4/1983 at 06:32:18, a magnitude 4.6 (4.4 MB, 4.6 LG, 4.4 ML) earthquake occurred 319.3 miles away from the city center
On 10/20/1995 at 15:57:18, a magnitude 3.7 (3.7 LG, Depth: 3.1 mi, Class: Light, Intensity: II - III) earthquake occurred 199.4 miles away from the city center
On 2/9/1994 at 08:45:35, a magnitude 3.1 (3.1 LG, Depth: 3.1 mi) earthquake occurred 99.0 miles away from the city center
On 11/3/2002 at 20:41:56, a magnitude 4.3 (4.3 MB, Depth: 3.1 mi) earthquake occurred 327.6 miles away from St. Paul Park center
Magnitude types: regional Lg-wave magnitude (LG), body-wave magnitude (MB), local magnitude (ML)
Natural disasters:
The number of natural disasters in Washington County (16) is near the US average (15).Major Disasters (Presidential) Declared: 10
Emergencies Declared: 3
Causes of natural disasters: Floods: 11, Storms: 6, Tornadoes: 4, Winds: 2, Drought: 1, Fire: 1, Hurricane: 1, Winter Storm: 1, Other: 1 (Note: some incidents may be assigned to more than one category).

Hospitals and medical centers near St. Paul Park:
- CARECO APARTMENTS (Hospital, about 3 miles away; INVER GROVE HEIGHTS, MN)
- DAVITA - COTTAGE GROVE (Dialysis Facility, about 4 miles away; COTTAGE GROVE, MN)
- WEDGEWOOD HEALTH CARE CTR (Nursing Home, about 5 miles away; INVER GROVE HEIGHTS, MN)
- WOODLYN HEIGHTS HEALTHCARE CENTER (Nursing Home, about 5 miles away; INVER GROVE HEIGHTS, MN)
- WOODBURY HEALTH CARE CENTER (Nursing Home, about 5 miles away; WOODBURY, MN)
- SOUTHVIEW ACRES HEALTH CARE CENTER INC (Nursing Home, about 6 miles away; WEST SAINT PAUL, MN)
- GOOD SAMARITAN SOCIETY - INVER GROVE HEIGHTS (Nursing Home, about 6 miles away; INVER GROVE HEIGHTS, MN)
located in St. Paul Park:
Amtrak station near St. Paul Park:
Colleges/universities with over 2000 students nearest to St. Paul Park:
- Inver Hills Community College (about 4 miles; Inver Grove Heights, MN; Full-time enrollment: 4,049)
- Dakota County Technical College (about 9 miles; Rosemount, MN; FT enrollment: 2,478)
- Metropolitan State University (about 10 miles; Saint Paul, MN; FT enrollment: 6,159)
- Saint Paul College (about 10 miles; Saint Paul, MN; FT enrollment: 4,778)
- Macalester College (about 12 miles; Saint Paul, MN; FT enrollment: 2,174)
- St Catherine University (about 12 miles; Saint Paul, MN; FT enrollment: 3,771)
- Concordia University-Saint Paul (about 12 miles; Saint Paul, MN; FT enrollment: 2,501)
Private high school in St. Paul Park:
- HOPE CHRISTIAN ACADEMY (Students: 73, Location: 920 HOLLEY AVE STE 2, Grades: KG-12)
Public elementary/middle schools in St. Paul Park:
- NATURAL SCIENCE ACADEMY (Location: 920 HOLLEY AVE STE 3, Grades: KG-5, Charter school)
- OLTMAN MIDDLE SCHOOL (Location: 1020 3RD ST, Grades: 6-8)
- PULLMAN ELEMENTARY (Location: 1260 SELBY AVE, Grades: KG-5)
Private elementary/middle school in St. Paul Park:
Points of interest:
Notable location: Saint Paul Park Fire Department (A). Display/hide its location on the map
Cemetery: Saint Thomas Aquinas Cemetery (1). Display/hide its location on the map
Parks in St. Paul Park include: Abdelia Park (1), Lincoln Park (2), Heritage Park (3), Lions Park (4), Riverside Park (5). Display/hide their locations on the map
| This city: | 2.7 people |
| Minnesota: | 2.5 people |
| This city: | 70.1% |
| Whole state: | 64.6% |
| This city: | 9.2% |
| Whole state: | 6.9% |
Likely homosexual households (counted as self-reported same-sex unmarried-partner households)
- Lesbian couples: 0.2% of all households
- Gay men: 0.3% of all households
6 people in group homes intended for adults in 2010
61 people in other noninstitutional group quarters in 2000
Banks with branches in St. Paul Park (2011 data):
- Anchor Bank, National Association: St. Paul Park Branch at 1030 Hastings Avenue, branch established on 1999/07/06. Info updated 2009/11/24: Bank assets: $1,290.6 mil, Deposits: $1,116.1 mil, headquarters in Saint Paul, MN, positive income, Commercial Lending Specialization, 16 total offices, Holding Company: Anchor Bancorp, Inc.
For population 15 years and over in St. Paul Park:
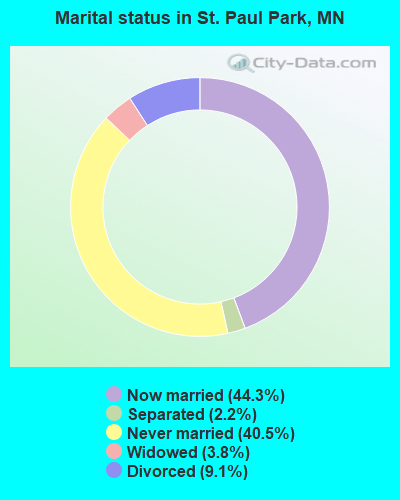
- Never married: 40.5%
- Now married: 44.3%
- Separated: 2.2%
- Widowed: 3.8%
- Divorced: 9.1%
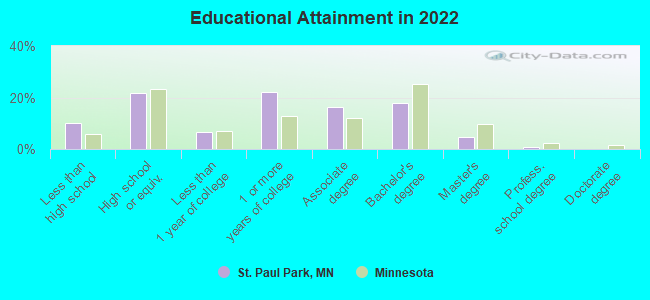
For population 25 years and over in St. Paul Park:
- High school or higher: 91.0%
- Bachelor's degree or higher: 23.1%
- Graduate or professional degree: 5.2%
- Unemployed: 2.7%
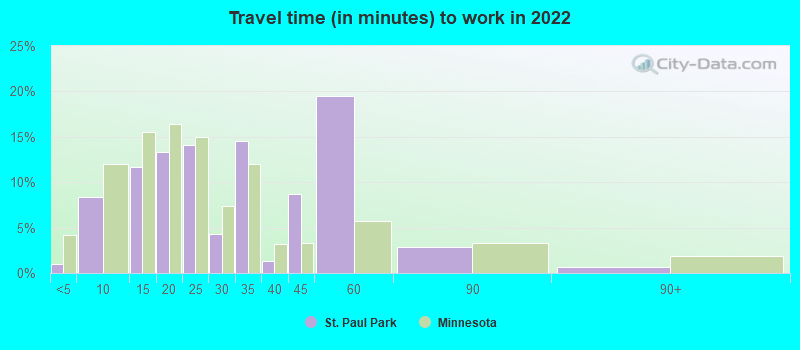
- Mean travel time to work (commute): 22.1 minutes
| Here: | 9.8 |
| Minnesota average: | 10.9 |
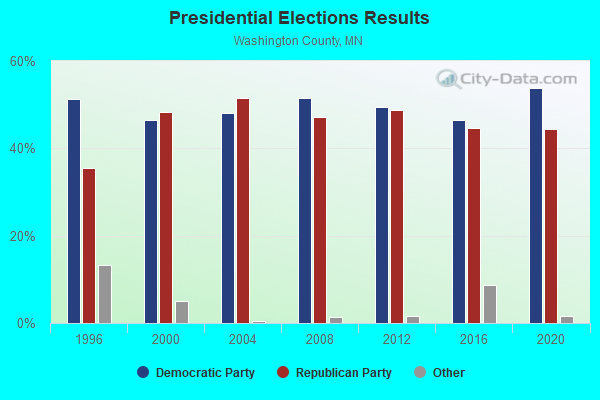
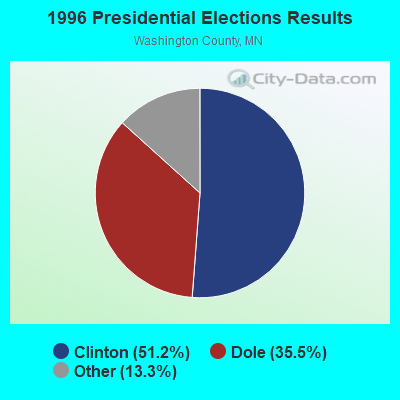
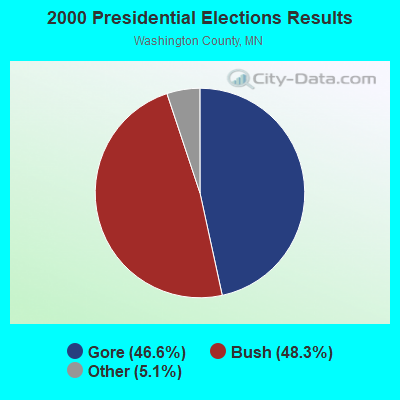
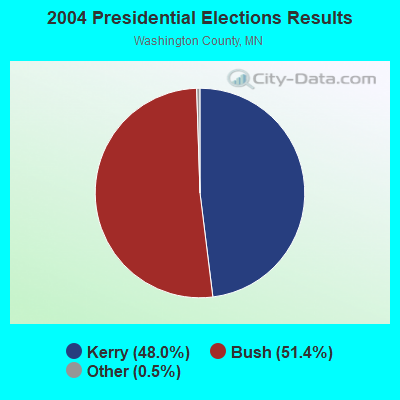
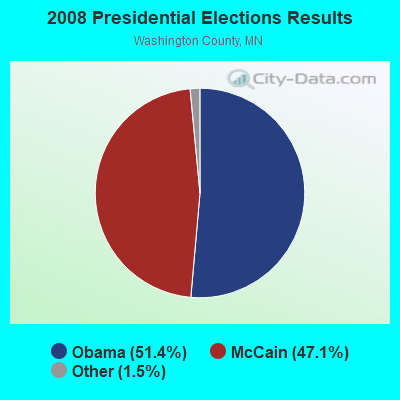
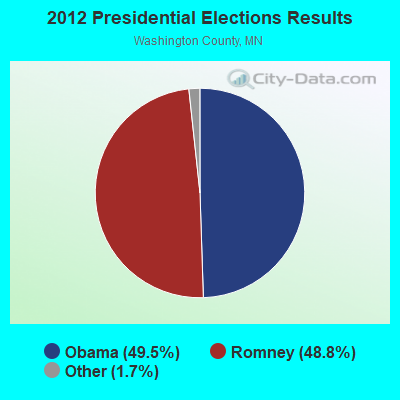
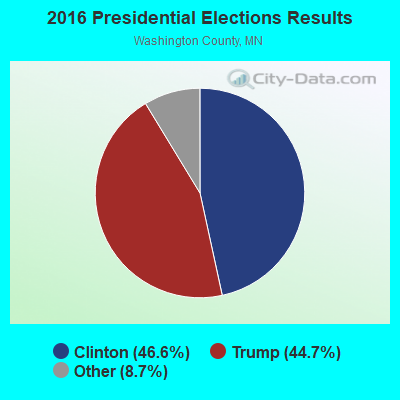
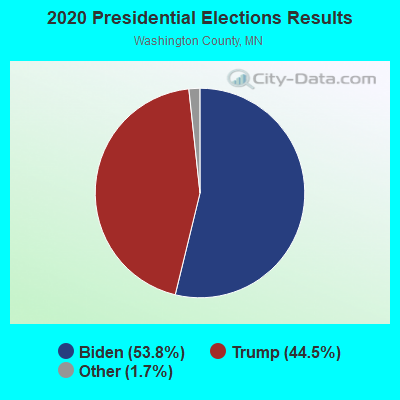
Graphs represent county-level data. Detailed 2008 Election Results
Religion statistics for St. Paul Park, MN (based on Washington County data)
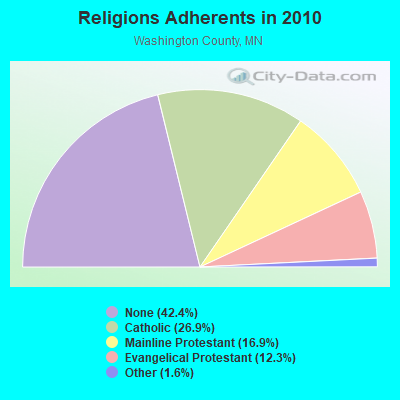
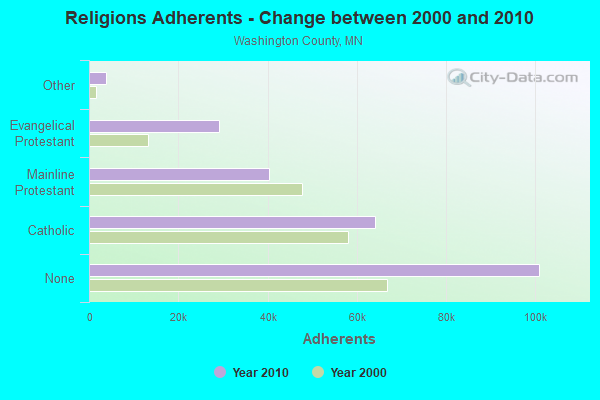
| Religion | Adherents | Congregations |
|---|---|---|
| Catholic | 64,157 | 9 |
| Mainline Protestant | 40,212 | 38 |
| Evangelical Protestant | 29,174 | 69 |
| Other | 3,699 | 13 |
| None | 100,894 | - |
Food Environment Statistics:
| Here: | 0.89 / 10,000 pop. |
| Minnesota: | 1.83 / 10,000 pop. |
| Washington County: | 0.04 / 10,000 pop. |
| Minnesota: | 0.13 / 10,000 pop. |
| Washington County: | 0.22 / 10,000 pop. |
| Minnesota: | 0.49 / 10,000 pop. |
| This county: | 2.30 / 10,000 pop. |
| Minnesota: | 3.90 / 10,000 pop. |
| This county: | 6.02 / 10,000 pop. |
| Minnesota: | 6.98 / 10,000 pop. |
| Washington County: | 5.3% |
| Minnesota: | 6.5% |
| Washington County: | 26.7% |
| Minnesota: | 25.9% |
| Here: | 10.8% |
| State: | 13.0% |
Health and Nutrition:
| Here: | 47.4% |
| State: | 50.6% |
| This city: | 43.8% |
| State: | 48.4% |
| Here: | 28.5 |
| State: | 28.5 |
| This city: | 21.9% |
| Minnesota: | 21.0% |
| St. Paul Park: | 8.7% |
| State: | 9.8% |
| St. Paul Park: | 6.8 |
| Minnesota: | 6.8 |
| This city: | 33.9% |
| Minnesota: | 33.5% |
| St. Paul Park: | 54.9% |
| Minnesota: | 57.7% |
| St. Paul Park: | 78.6% |
| State: | 79.3% |
More about Health and Nutrition of St. Paul Park, MN Residents
St. Paul Park government finances - Expenditure in 2018 (per resident):
- Construction - Regular Highways: $678,000 ($124.93)
- Current Operations - Police Protection: $1,298,000 ($239.17)
Sewerage: $648,000 ($119.40)
Water Utilities: $591,000 ($108.90)
Regular Highways: $540,000 ($99.50)
General - Other: $297,000 ($54.73)
Financial Administration: $257,000 ($47.36)
Parks and Recreation: $242,000 ($44.59)
Local Fire Protection: $126,000 ($23.22)
Central Staff Services: $34,000 ($6.26)
Solid Waste Management: $4,000 ($0.74)
- General - Interest on Debt: $143,000 ($26.35)
- Other Capital Outlay - Local Fire Protection: $440,000 ($81.08)
Regular Highways: $250,000 ($46.07)
Parks and Recreation: $98,000 ($18.06)
Police Protection: $37,000 ($6.82)
General - Other: $31,000 ($5.71)
- Water Utilities - Interest on Debt: $14,000 ($2.58)
St. Paul Park government finances - Revenue in 2018 (per resident):
- Charges - Sewerage: $657,000 ($121.06)
Other: $309,000 ($56.94)
Regular Highways: $241,000 ($44.41)
Parks and Recreation: $8,000 ($1.47)
Solid Waste Management: $3,000 ($0.55)
- Federal Intergovernmental - Other: $14,000 ($2.58)
- Local Intergovernmental - Highways: $41,000 ($7.55)
Other: $23,000 ($4.24)
- Miscellaneous - Special Assessments: $429,000 ($79.05)
General Revenue - Other: $207,000 ($38.14)
Fines and Forfeits: $44,000 ($8.11)
Interest Earnings: $17,000 ($3.13)
- Revenue - Water Utilities: $613,000 ($112.95)
- State Intergovernmental - General Local Government Support: $513,000 ($94.53)
Highways: $373,000 ($68.73)
Other: $90,000 ($16.58)
- Tax - Property: $2,059,000 ($379.40)
Public Utilities Sales: $183,000 ($33.72)
Other License: $111,000 ($20.45)
St. Paul Park government finances - Debt in 2018 (per resident):
- Long Term Debt - Beginning Outstanding - Unspecified Public Purpose: $5,739,000 ($1057.49)
Outstanding Unspecified Public Purpose: $4,905,000 ($903.81)
Outstanding Nonguaranteed - Industrial Revenue: $4,450,000 ($819.97)
Beginning Outstanding - Public Debt for Private Purpose: $4,450,000 ($819.97)
Retired Unspecified Public Purpose: $834,000 ($153.68)
St. Paul Park government finances - Cash and Securities in 2018 (per resident):
- Other Funds - Cash and Securities: $1,139,000 ($209.88)
- Sinking Funds - Cash and Securities: $4,450,000 ($819.97)
Strongest AM radio stations in St. Paul Park:
- WCTS (1030 AM; 50 kW; MAPLEWOOD, MN; Owner: CNTL. BAPT. THEO/AL SEMI MINNEAPOLIS)
- KTIS (900 AM; 25 kW; MINNEAPOLIS, MN; Owner: NORTHWESTERN COLLEGE)
- KSTP (1500 AM; 50 kW; ST. PAUL, MN; Owner: KSTP-AM, LLC (DELAWARE))
- KFAN (1130 AM; 50 kW; MINNEAPOLIS, MN; Owner: AMFM RADIO LICENSES, L.L.C.)
- WCCO (830 AM; 50 kW; MINNEAPOLIS, MN; Owner: INFINITY MEDIA CORPORATION)
- KKMS (980 AM; 5 kW; RICHFIELD, MN)
- WDGY (630 AM; 8 kW; HUDSON, WI; Owner: 630 RADIO, INCORPORATED)
- KUOM (770 AM; daytime; 5 kW; MINNEAPOLIS, MN)
- WMNN (1330 AM; 10 kW; MINNEAPOLIS, MN; Owner: MINNESOTA PUBLIC RADIO.)
- WMGT (1220 AM; 5 kW; STILLWATER, MN; Owner: ENDURANCE BROADCASTING, LLC)
- WWTC (1280 AM; 5 kW; MINNEAPOLIS, MN; Owner: SCA LICENSE CORPORATION)
- KDIZ (1440 AM; 5 kW; GOLDEN VALLEY, MN; Owner: KQRS, INC.)
- KSMM (1530 AM; 9 kW; SHAKOPEE, MN; Owner: STARBOARD BROADCASTING, INC.)
Strongest FM radio stations in St. Paul Park:
- K294AM (106.7 FM; WEST ST. PAUL, MN; Owner: FRESH AIR, INCORPORATED)
- WCAL (89.3 FM; NORTHFIELD, MN; Owner: ST. OLAF COLLEGE)
- KNOW-FM (91.1 FM; MINNEAPOLIS-ST. PAUL, MN; Owner: MINNESOTA PUBLIC RADIO)
- WLTE (102.9 FM; MINNEAPOLIS, MN; Owner: INFINITY MEDIA CORPORATION)
- KSTP-FM (94.5 FM; ST. PAUL, MN; Owner: KSTP-FM, LLC, A DELAWARE LLC)
- KEEY-FM (102.1 FM; ST. PAUL, MN; Owner: AMFM RADIO LICENSES, L.L.C.)
- KTIS-FM (98.5 FM; MINNEAPOLIS, MN; Owner: NORTHWESTERN COLLEGE)
- KDWB-FM (101.3 FM; RICHFIELD, MN; Owner: AMFM RADIO LICENSES, L.L.C.)
- KQRS-FM (92.5 FM; GOLDEN VALLEY, MN; Owner: KQRS, Inc.)
- KSJN (99.5 FM; MINNEAPOLIS, MN; Owner: MINNESOTA PUBLIC RADIO)
- KXXR (93.7 FM; MINNEAPOLIS, MN; Owner: KQRS, INC.)
- WGVX (105.1 FM; LAKEVILLE, MN; Owner: KQRS, INC.)
- WXPT (104.1 FM; ST. LOUIS PARK, MN; Owner: THE AUDIO HOUSE, INC.)
- KTCZ-FM (97.1 FM; MINNEAPOLIS, MN; Owner: AMFM RADIO LICENSES, L.L.C.)
- K214DF (90.7 FM; GOLDEN VALLEY, MN; Owner: EDUCATIONAL MEDIA FOUNDATION)
- KBEM-FM (88.5 FM; MINNEAPOLIS, MN; Owner: BD. OF EDUCATION, S.S.D. NO. 1)
- KNOF (95.3 FM; ST. PAUL, MN; Owner: SELBY GOSPEL BROADCASTING CORPORATION)
- KFAI (90.3 FM; MINNEAPOLIS, MN; Owner: FRESH AIR, INC.)
- KQQL (107.9 FM; ANOKA, MN; Owner: AMFM RADIO LICENSES, L.L.C.)
- WFMP (107.1 FM; COON RAPIDS, MN; Owner: WFMP-FM, LLC)
TV broadcast stations around St. Paul Park:
- KMSP-TV (Channel 9; MINNEAPOLIS, MN; Owner: FOX TELEVISION STATIONS, INC.)
- KTCA-TV (Channel 2; ST. PAUL, MN; Owner: TWIN CITIES PUBLIC TELEVISION, INC.)
- KARE (Channel 11; MINNEAPOLIS, MN; Owner: MULTIMEDIA HOLDINGS CORPORATION)
- KSTP-TV (Channel 5; ST. PAUL, MN; Owner: HUBBARD BROADCASTING, INC.)
- WCCO-TV (Channel 4; MINNEAPOLIS, MN; Owner: CBS BROADCASTING INC.)
- KTCI-TV (Channel 17; ST. PAUL, MN; Owner: TWIN CITIES PUBLIC TELEVISION, INC.)
- KSTC-TV (Channel 45; MINNEAPOLIS, MN; Owner: HUBBARD BROADCASTING, INC.)
- KMWB (Channel 23; MINNEAPOLIS, MN; Owner: KLGT LICENSEE, LLC)
- WFTC (Channel 29; MINNEAPOLIS, MN; Owner: FOX TELEVISION STATIONS, INC.)
- K07UI (Channel 7; MINNEAPOLIS, ETC., MN; Owner: WORD OF GOD FELLOWSHIP, INC.)
- K58BS (Channel 58; MINNEAPOLIS, MN; Owner: TRINITY BROADCASTING NETWORK)
- K67HG (Channel 67; MINNEAPOLIS, MN; Owner: VENTANA TELEVISION, INC.)
- K14KH (Channel 14; MINNEAPOLIS, MN; Owner: THREE ANGELS BROADCASTING NETWORK)
- K19ER (Channel 19; ST. PAUL, MN; Owner: CATHOLIC VIEWS BROADCASTS, INC.)
- W62BD (Channel 62; MINNEAPOLIS, MN; Owner: WORD OF GOD FELLOWSHIP, INC.)
- WBWX-CA (Channel 13; MINNEAPOLIS, MN; Owner: THE BOX WORLDWIDE LLC)
- KPXM (Channel 41; ST. CLOUD, MN; Owner: PAXSON MINNEAPOLIS LICENSE, INC.)
- W55AP (Channel 55; RIVER FALLS, WI; Owner: STATE OF WISCONSIN - EDUCATIONAL COMMUNICATIONS BOARD)
- National Bridge Inventory (NBI) Statistics
- 5Number of bridges
- 69ft / 21.0mTotal length
- $3,000Total costs
- 88,500Total average daily traffic
- 3,900Total average daily truck traffic
FCC Registered Antenna Towers:
11 (See the full list of FCC Registered Antenna Towers in St. Paul Park)FCC Registered Broadcast Land Mobile Towers:
1- 1 Mi E Of St. Paul Park (Lat: 44.849694 Lon: -92.984111), Type: Pole, Structure height: 47.2 m, Call Sign: WQBG883,
Assigned Frequencies: 154.265 MHz, Grant Date: 10/04/2004, Expiration Date: 10/04/2014, Cancellation Date: 10/01/2012, Certifier: Bernie Morency, Registrant: Psc Alliance Inc, 4921 Fifth Avenue South, Minneapolis, MN 55409-2644, Phone: (612) 720-5843, Fax: (888) 384-9171, Email:
FCC Registered Microwave Towers:
2- NSP MONOPOLE, 1 Mi E Of St. Paul Park (Lat: 44.849694 Lon: -92.984111), Type: Pole, Structure height: 47.2 m, Call Sign: WPUN563,
Assigned Frequencies: 11148.1 MHz, Grant Date: 03/30/2012, Expiration Date: 04/02/2022, Cancellation Date: 01/03/2022, Certifier: James Frank, Registrant: W. M. Montgomery & Associates, 4921 Fith Avenue South, Minneapolis, MN 55409-2644, Phone: (612) 720-5843, Fax: (612) 825-8972, Email:
- St. Paul Park, 1301 Selby Ave (Lat: 44.834250 Lon: -92.983111), Type: Gtower, Structure height: 30.5 m, Overall height: 32.3 m, Call Sign: WRPR667,
Assigned Frequencies: 6286.19 MHz, 6345.49 MHz, Grant Date: 09/02/2022, Expiration Date: 03/01/2023, Cancellation Date: 12/22/2022, Certifier: Thomas M Gubash, Registrant: Mndot, Office Of Statewide Radio Communications, 395 John Ireland Blvd, Ms730, St. Paul, MN 55155, Phone: (651) 234-7961, Email:
FCC Registered Amateur Radio Licenses:
1- Call Sign: W0RAC, Previous Call Sign: N0UOF, Licensee ID: L00264386, Grant Date: 02/23/1999, Expiration Date: 02/23/2009, Cancellation Date: 02/24/2011, Registrant: Robert A Cross, 356 9th Avenue, Suite 303, St. Paul Park, MN 55071
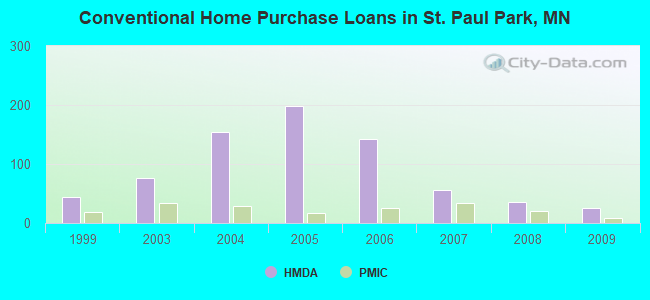
| Home Mortgage Disclosure Act Aggregated Statistics For Year 2009 (Based on 1 full tract) | ||||||||||||
| A) FHA, FSA/RHS & VA Home Purchase Loans | B) Conventional Home Purchase Loans | C) Refinancings | D) Home Improvement Loans | F) Non-occupant Loans on < 5 Family Dwellings (A B C & D) | G) Loans On Manufactured Home Dwelling (A B C & D) | |||||||
|---|---|---|---|---|---|---|---|---|---|---|---|---|
| Number | Average Value | Number | Average Value | Number | Average Value | Number | Average Value | Number | Average Value | Number | Average Value | |
| LOANS ORIGINATED | 57 | $139,211 | 26 | $114,808 | 94 | $140,915 | 1 | $240,000 | 7 | $137,286 | 3 | $35,000 |
| APPLICATIONS APPROVED, NOT ACCEPTED | 2 | $141,000 | 1 | $131,000 | 12 | $153,667 | 1 | $4,000 | 0 | $0 | 0 | $0 |
| APPLICATIONS DENIED | 8 | $146,875 | 18 | $59,500 | 48 | $152,979 | 11 | $52,091 | 2 | $133,500 | 12 | $25,750 |
| APPLICATIONS WITHDRAWN | 2 | $121,500 | 5 | $89,400 | 27 | $168,148 | 4 | $84,250 | 3 | $121,667 | 2 | $47,500 |
| FILES CLOSED FOR INCOMPLETENESS | 0 | $0 | 0 | $0 | 12 | $142,083 | 0 | $0 | 0 | $0 | 0 | $0 |
Detailed HMDA statistics for the following Tracts: 0713.00
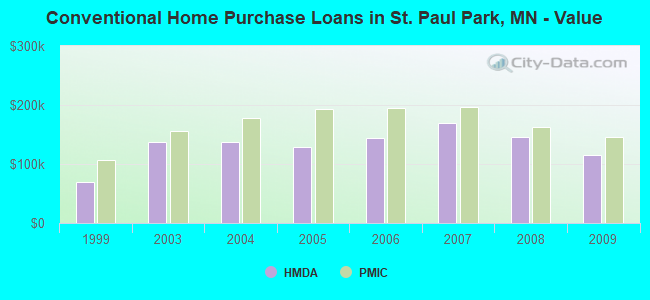
| Private Mortgage Insurance Companies Aggregated Statistics For Year 2009 (Based on 1 full tract) | ||||
| A) Conventional Home Purchase Loans | B) Refinancings | |||
|---|---|---|---|---|
| Number | Average Value | Number | Average Value | |
| LOANS ORIGINATED | 8 | $145,250 | 2 | $157,000 |
| APPLICATIONS APPROVED, NOT ACCEPTED | 1 | $197,000 | 0 | $0 |
| APPLICATIONS DENIED | 3 | $105,000 | 0 | $0 |
| APPLICATIONS WITHDRAWN | 1 | $78,000 | 0 | $0 |
| FILES CLOSED FOR INCOMPLETENESS | 0 | $0 | 0 | $0 |
Detailed PMIC statistics for the following Tracts: 0713.00
2002 - 2011 National Fire Incident Reporting System (NFIRS) incidents
- Fire incident types reported to NFIRS in St. Paul Park, MN
- 7939.3%Outside Fires
- 6934.3%Structure Fires
- 2813.9%Mobile Property/Vehicle Fires
- 2512.4%Other
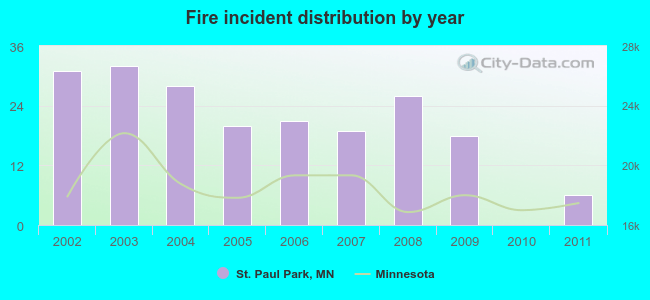 According to the data from the years 2002 - 2011 the average number of fire incidents per year is 20. The highest number of reported fire incidents - 32 took place in 2003, and the least - 0 in 2010. The data has a dropping trend.
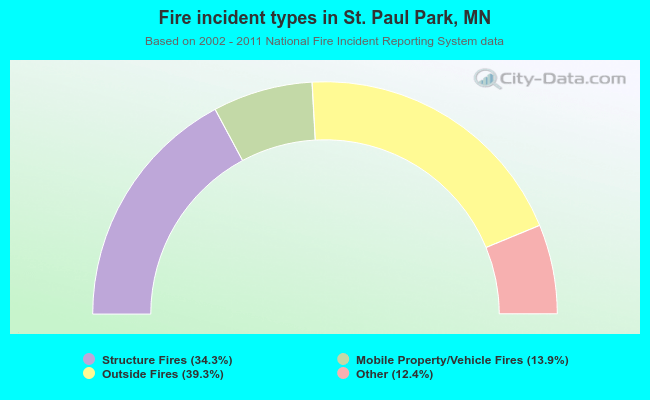 When looking into fire subcategories, the most reports belonged to: Outside Fires (39.3%), and Structure Fires (34.3%).
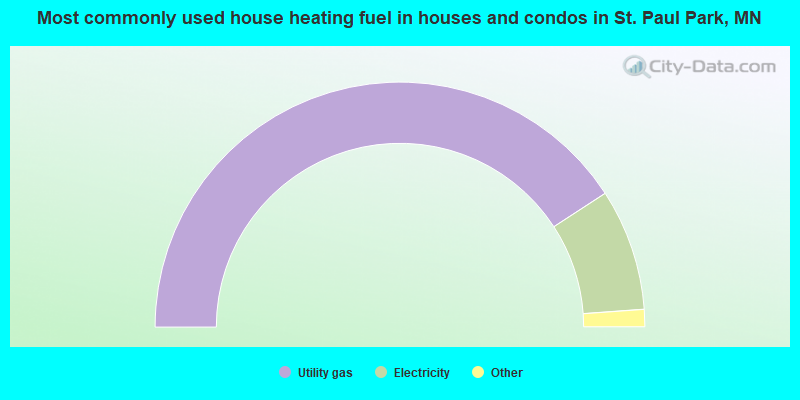
- 81.7%Utility gas
- 16.1%Electricity
- 1.3%Bottled, tank, or LP gas
- 0.7%Fuel oil, kerosene, etc.
- 0.2%No fuel used
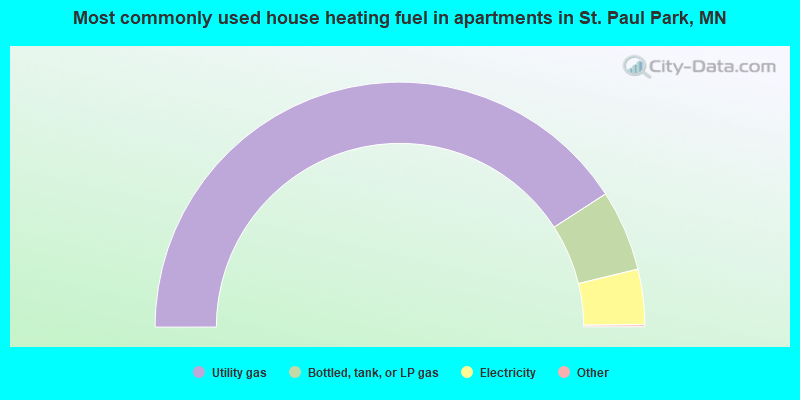
- 81.9%Utility gas
- 10.7%Bottled, tank, or LP gas
- 7.3%Electricity
St. Paul Park compared to Minnesota state average:
- Unemployed percentage significantly below state average.
- Black race population percentage below state average.
- Hispanic race population percentage above state average.
- Median age significantly below state average.
- Renting percentage below state average.
St. Paul Park on our top lists:
- #14 on the list of "Top 101 cities with largest percentage of females in industries: information (population 5,000+)"
- #69 on the list of "Top 101 cities with largest percentage of females in occupations: office and administrative support occupations (population 5,000+)"
- #80 on the list of "Top 101 cities with largest percentage of females in industries: finance and insurance (population 5,000+)"
- #84 on the list of "Top 101 cities with largest percentage of males in occupations: transportation occupations (population 5,000+)"
- #36 on the list of "Top 101 counties with the largest increase in the number of deaths per 1000 residents 2000-2006 to 2007-2013 (pop. 50,000+)"
- #54 on the list of "Top 101 counties with the lowest number of deaths per 1000 residents 2007-2013 (pop. 50,000+)"
- #56 on the list of "Top 101 counties with the largest number of children under 18 without health insurance coverage in 2000"
- #82 on the list of "Top 101 counties with the lowest Ozone (1-hour) air pollution readings in 2012 (ppm)"
- #93 on the list of "Top 101 counties with the largest decrease in the number of births per 1000 residents 2000-2006 to 2007-2013 (pop 50,000+)"

|
|
Total of 37 patent applications in 2008-2024.