Hill County, Texas (TX)
County owner-occupied free and clear houses and condos in 2010: 5,243
County owner-occupied houses and condos in 2000: 9,149
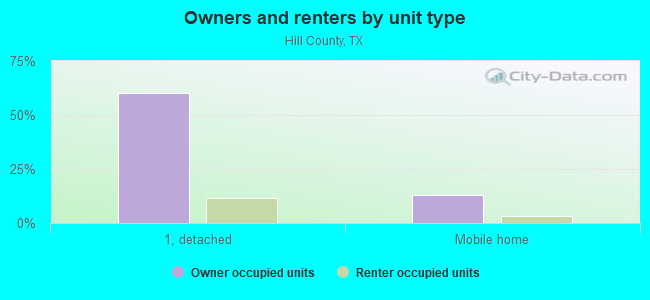
Renter-occupied apartments: 3,239 (it was 3,055 in 2000)
| % of renters here: | 25% |
| State: | 36% |
Land area: 962 sq. mi.
Water area: 23.3 sq. mi.
Population density: 39 people per square mile (low).
Industries providing employment: Educational, health and social services (20.4%), Retail trade (12.6%), Manufacturing (12.3%), Construction (11.6%).
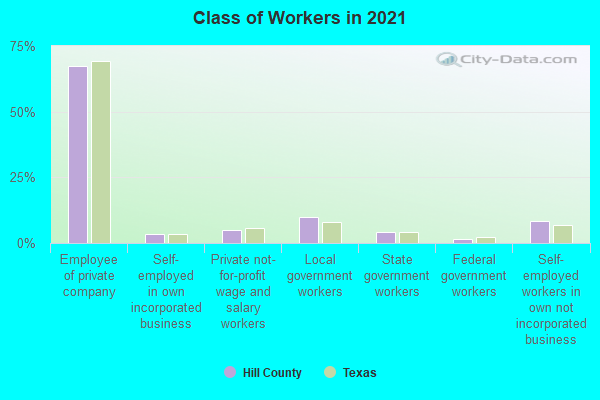
Type of workers:
- Private wage or salary: 76%
- Government: 15%
- Self-employed, not incorporated: 9%
- Unpaid family work: 0%
- OSM Map
- General Map
- Google Map
- MSN Map

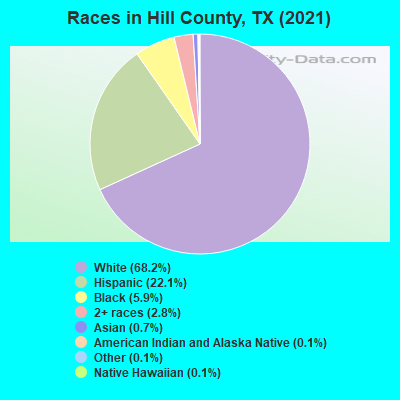
- 24,76467.6%White Non-Hispanic Alone
- 8,18422.3%Hispanic or Latino
- 2,1996.0%Black Non-Hispanic Alone
- 1,0222.8%Two or more races
- 2330.6%Asian alone
- 1630.4%Some other race alone
- 630.2%American Indian and Alaska Native alone
| Median resident age: | 41.7 years |
| Texas median age: | 35.6 years |
| Males: 18,653 | |
| Females: 18,456 |

 | When will Sherman/Denison Be In DFW Metro? (68 replies) |
| Texas population estimates 2020-2022 (37 replies) |
| How is San Antonio still growing so fast? (101 replies) |
| Nelson Wolff (40 replies) |
| Texas County Courthouses (13 replies) |
| Neighborhoods to live in or around San Antonio (44 replies) |
| Hill County: | 2.0 people |
| Texas: | 3 people |
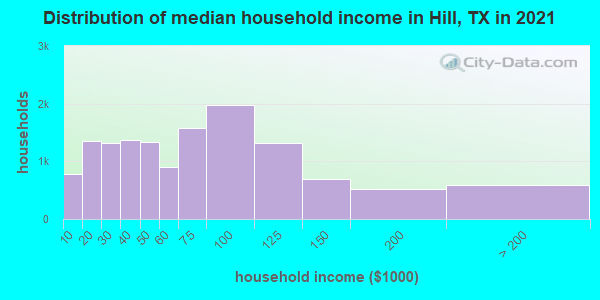
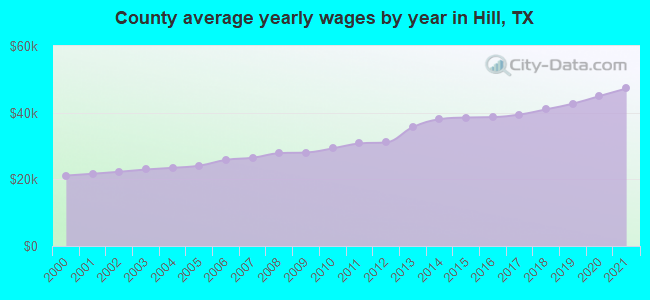
Estimated median household income in 2022: $60,045 ($31,600 in 1999)
| This county: | $60,045 |
| Texas: | $72,284 |
Median contract rent in 2022 for apartments: $697 (lower quartile is $494, upper quartile is $889)
| This county: | $697 |
| State: | $1117 |
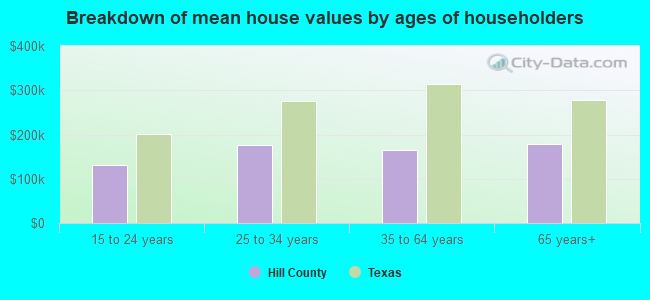
Estimated median house or condo value in 2022: $164,314 (it was $55,200 in 2000)
| Hill: | $164,314 |
| Texas: | $275,400 |
Mean price in 2022:
Median monthly housing costs for homes and condos with a mortgage: $1,383Detached houses: $232,647
Here: $232,647 State: $369,058 Townhouses or other attached units: $351,083
Here: $351,083 State: $327,631 Mobile homes: $109,131
Here: $109,131 State: $124,413 Occupied boats, RVs, vans, etc.: $90,196
Here: $90,196 State: $73,921
Median monthly housing costs for units without a mortgage: $495
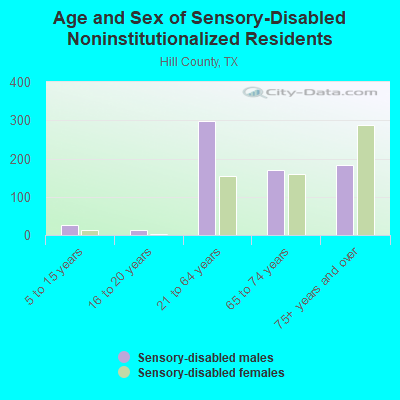
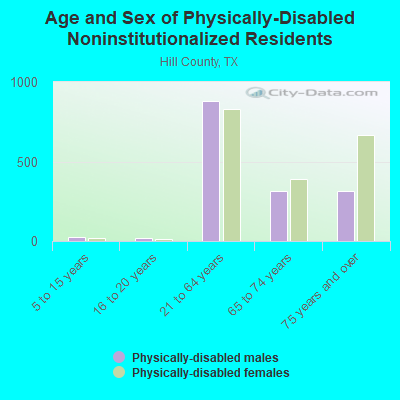
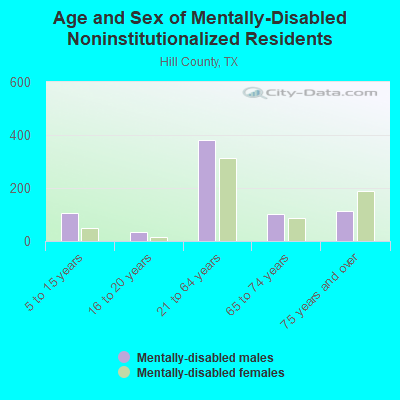
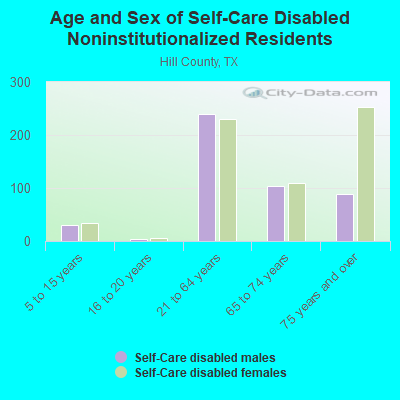
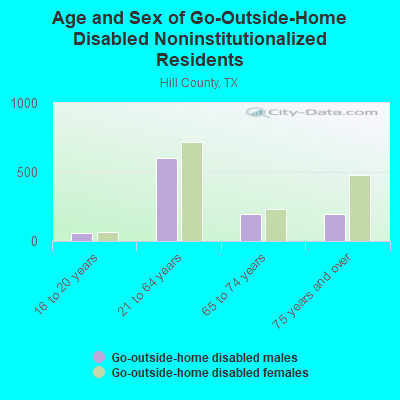
Institutionalized population: 581
Crime in 2021 (reported by the sheriff's office or county police, not the county total):
- Murders: 1
- Rapes: 25
- Robberies: 2
- Assaults: 49
- Burglaries: 43
- Thefts: 166
- Auto thefts: 26
Crime in 2020 (reported by the sheriff's office or county police, not the county total):
- Murders: 0
- Rapes: 9
- Robberies: 1
- Assaults: 21
- Burglaries: 75
- Thefts: 166
- Auto thefts: 24
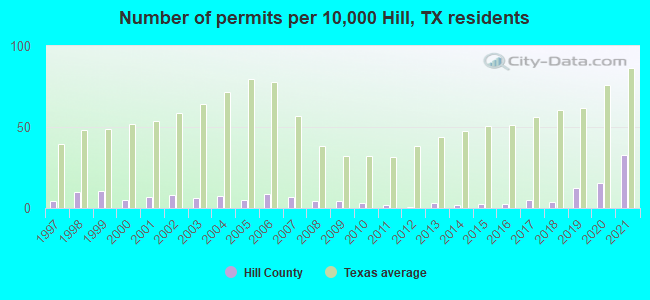
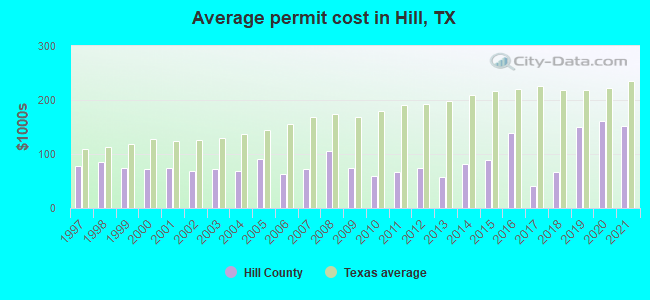
Single-family new house construction building permits:
- 2022: 59 buildings, average cost: $222,000
- 2021: 106 buildings, average cost: $152,400
- 2020: 50 buildings, average cost: $162,100
- 2019: 40 buildings, average cost: $149,500
- 2018: 11 buildings, average cost: $66,100
- 2017: 16 buildings, average cost: $41,400
- 2016: 8 buildings, average cost: $137,800
- 2015: 7 buildings, average cost: $87,700
- 2014: 6 buildings, average cost: $81,600
- 2013: 10 buildings, average cost: $58,000
- 2012: 2 buildings, average cost: $73,500
- 2011: 6 buildings, average cost: $66,000
- 2010: 9 buildings, average cost: $59,100
- 2009: 14 buildings, average cost: $75,400
- 2008: 14 buildings, average cost: $105,700
- 2007: 21 buildings, average cost: $72,300
- 2006: 28 buildings, average cost: $63,200
- 2005: 15 buildings, average cost: $89,900
- 2004: 24 buildings, average cost: $69,300
- 2003: 20 buildings, average cost: $72,300
- 2002: 25 buildings, average cost: $68,700
- 2001: 22 buildings, average cost: $74,300
- 2000: 16 buildings, average cost: $72,500
- 1999: 33 buildings, average cost: $75,300
- 1998: 31 buildings, average cost: $85,900
- 1997: 14 buildings, average cost: $78,000
Median real estate property taxes paid for housing units with mortgages in 2022: $2,779 (1.3%)
Median real estate property taxes paid for housing units with no mortgage in 2022: $1,452 (1.2%)


| Hill County: | 13.4% |
| Texas: | 14.0% |
Median age of residents in 2022: 41.7 years old
(Males: 40.6 years old, Females: 43.1 years old)
(Median age for: White residents: 48.0 years old, Black residents: 38.5 years old, American Indian residents: 42.4 years old, Asian residents: 48.7 years old, Hispanic or Latino residents: 27.7 years old, Other race residents: 33.8 years old)
Fair market rent in 2006 for a 1-bedroom apartment in Hill County is $437 a month.
Fair market rent for a 2-bedroom apartment is $484 a month.
Fair market rent for a 3-bedroom apartment is $685 a month.
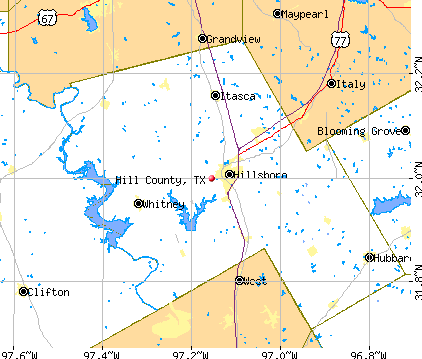
Cities in this county include: Hillsboro, Whitney, Hubbard, Itasca, Blum, Mount Calm, Abbott, Covington, Malone, Bynum.
Notable locations in this county outside city limits:
Notable locations in Hill County: De Leon Pumping Station (A), Lightning C Ranch (B), Mercers Gap (C), Pounds (D), Soda Springs Community Hall (E), Stag Creek Community Center (F), Promontory Park Volunteer Fire Department (G), Energy Volunteer Fire Department (H), Proctor Volunteer Fire Department (I), Sipe Springs Volunteer Fire Department (J), Comanche County Museum (K). Display/hide their locations on the map
Churches in Hill County include: Pleasant Home Church (A), Rock Bluff Church (B), Sand Hill Church (C), Shiloh Church (D), Sweetwater Church (E), Taylors Chapel (F), White Point Church (G), Amity Church (H), Baggett Creek Church (I). Display/hide their locations on the map
Cemeteries: Midway Cemetery (1), Sardis Cemetery (2), Miller Cemetery (3), Albin Cemetery (4), Antioch Cemetery (5), Baggett Cemetery (6), Reid Cemetery (7). Display/hide their locations on the map
Reservoirs: Davis Lake (A), Proctor Lake (B), Lake Eanes (C), Lake Comanche (D), Soil Conservation Service Site 26 Reservoir (E), Spruill Lake Number 1 (F), McGinnis Lake (G), Golden Lake (H). Display/hide their locations on the map
Streams, rivers, and creeks: Walker Creek (A), Turkey Creek (B), Sweetwater Creek (C), Stag Creek (D), Sipe Springs Creek (E), Shinoak Branch (F), Rush Creek (G), Resley Creek (H), Rabbit Creek (I). Display/hide their locations on the map
Parks in Hill County include: High Point Park (1), Sowell Creek Park (2), Promontory Park (3), Copperas Creek Park (4), Lake Eanes Park (5). Display/hide their locations on the map
Neighboring counties: Pima County, Arizona  , Santa Cruz County, Arizona , Crisp County, Georgia
  , Coleman County , Taylor County, Georgia .
| Here: | 3.2% |
| Texas: | 3.5% |
Current college students: 1,100
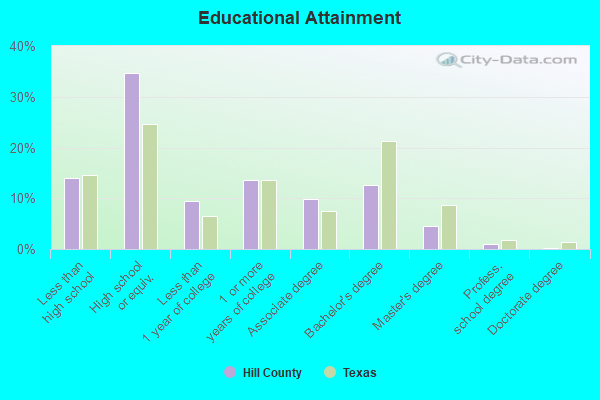
People 25 years of age or older with a high school degree or higher: 85.6%
People 25 years of age or older with a bachelor's degree or higher: 17.5%
Number of foreign born residents: 2,382 (42.9% naturalized citizens)
| Hill County: | 6.4% |
| Whole state: | 17.2% |

- Year of entry for the foreign-born population
- 5162010 or later
- 5882000 to 2009
- 4611990 to 1999
- 2941980 to 1989
- 2831970 to 1979
- 186Before 1970
Mean travel time to work (commute): minutes
Percentage of county residents living and working in this county: 99.6%
Housing units in structures:
- One, detached: 12,284
- One, attached: 97
- Two: 308
- 3 or 4: 381
- 5 to 9: 430
- 10 to 19: 52
- 20 to 49: 277
- 50 or more: 71
- Mobile homes: 2,667
- Boats, RVs, vans, etc.: 197
Housing units in Hill County with a mortgage: 4,381 (104 second mortgage, 0 home equity loan, 83 both second mortgage and home equity loan)
Houses without a mortgage: 67
| Here: | 5.6% with mortgage |
| State: | 98.4% with mortgage |
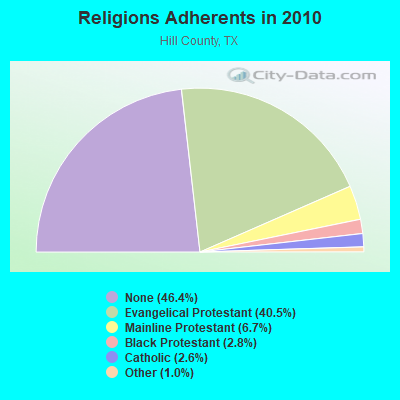
Religion statistics for Hill County
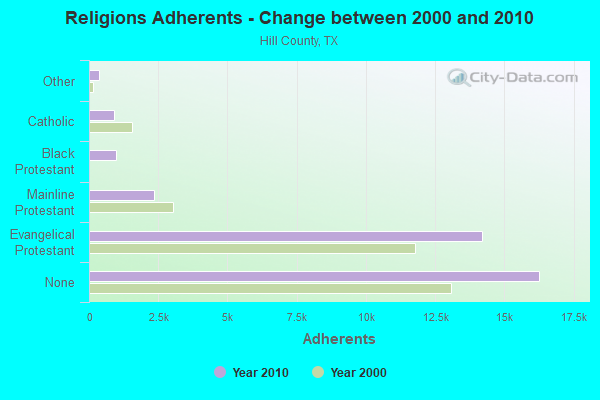
| Religion | Adherents | Congregations |
|---|---|---|
| Evangelical Protestant | 14,202 | 78 |
| Mainline Protestant | 2,363 | 15 |
| Black Protestant | 987 | 5 |
| Catholic | 915 | 3 |
| Other | 354 | 4 |
| None | 16,268 | - |
Source: Clifford Grammich, Kirk Hadaway, Richard Houseal, Dale E.Jones, Alexei Krindatch, Richie Stanley and Richard H.Taylor. 2012. 2010 U.S.Religion Census: Religious Congregations & Membership Study. Association of Statisticians of American Religious Bodies. Jones, Dale E., et al. 2002. Congregations and Membership in the United States 2000. Nashville, TN: Glenmary Research Center.
Food Environment Statistics:
| Hill County: | 1.71 / 10,000 pop. |
| State: | 1.47 / 10,000 pop. |
| Here: | 0.28 / 10,000 pop. |
| Texas: | 0.14 / 10,000 pop. |
| This county: | 1.14 / 10,000 pop. |
| Texas: | 1.11 / 10,000 pop. |
| Hill County: | 8.82 / 10,000 pop. |
| Texas: | 3.95 / 10,000 pop. |
| This county: | 4.83 / 10,000 pop. |
| State: | 6.13 / 10,000 pop. |
| Hill County: | 9.4% |
| Texas: | 8.9% |
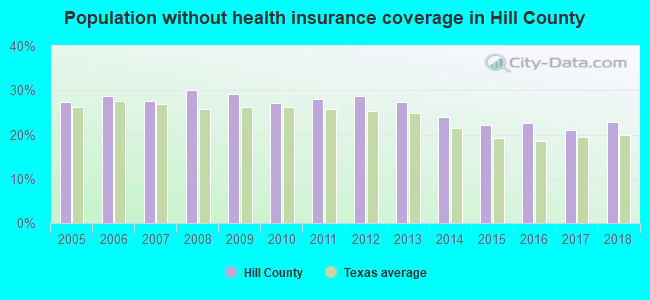
| Hill County: | 28.5% |
| State: | 26.6% |
| Here: | 14.9% |
| State: | 15.7% |
Agriculture in Hill County:
Average size of farms: 250 acresAverage value of agricultural products sold per farm: $26,822
Average value of crops sold per acre for harvested cropland: $141.13
The value of nursery, greenhouse, floriculture, and sod as a percentage of the total market value of agricultural products sold: 0.15%
The value of livestock, poultry, and their products as a percentage of the total market value of agricultural products sold: 44.82%
Average total farm production expenses per farm: $28,840
Harvested cropland as a percentage of land in farms: 41.88%
Irrigated harvested cropland as a percentage of land in farms: 1.51%
Average market value of all machinery and equipment per farm: $42,506
The percentage of farms operated by a family or individual: 94.99%
Average age of principal farm operators: 56 years
Average number of cattle and calves per 100 acres of all land in farms: 12.63
Milk cows as a percentage of all cattle and calves: 4.56%
Corn for grain: 44251 harvested acres
All wheat for grain: 48118 harvested acres
Upland cotton: 15387 harvested acres
Soybeans for beans: 312 harvested acres
Vegetables: 375 harvested acres
Land in orchards: 467 acres
Tornado activity:
Hill County historical area-adjusted tornado activity is significantly below Texas state average. It is 2440390.3 times below overall U.S. average.Tornadoes in this county have caused 21 injuries recorded between 1950 and 2004.
On 10/12/1993, a category 2 (max. wind speeds 113-157 mph) tornado injured 12 people and caused between $500,000 and $5,000,000 in damages.
Earthquake activity:
Hill County-area historical earthquake activity is significantly above Texas state average. It is 377% greater than the overall U.S. average.On 11/6/2011 at 03:53:10, a magnitude 5.7 (5.7 MW, Depth: 3.2 mi, Class: Moderate, Intensity: VI - VII) earthquake occurred 245.6 miles away from Hill County center
On 9/3/2016 at 12:02:44, a magnitude 5.8 (5.8 MW, Depth: 3.5 mi) earthquake occurred 306.6 miles away from the county center
On 6/16/1978 at 11:46:54, a magnitude 5.3 (4.4 MB, 4.6 UK, 5.3 ML) earthquake occurred 222.3 miles away from the county center
On 5/17/2012 at 08:12:00, a magnitude 4.8 (4.8 MW, Depth: 3.1 mi, Class: Light, Intensity: IV - V) earthquake occurred 163.7 miles away from the county center
On 5/7/2015 at 22:58:05, a magnitude 4.0 (4.0 MW, Depth: 1.6 mi) earthquake occurred 33.7 miles away from Hill County center
On 10/20/2011 at 12:24:41, a magnitude 4.8 (4.8 MW, Depth: 3.1 mi) earthquake occurred 223.5 miles away from the county center
Magnitude types: body-wave magnitude (MB), local magnitude (ML), moment magnitude (MW)
Most recent natural disasters:
- Texas Covid-19 Pandemic, Incident Period: January 20, 2020, FEMA Id: 4485, Natural disaster type: Other
- Texas Severe Storms And Flooding, Incident Period: September 10, 2018 - November 2, 2018, FEMA Id: 4416, Natural disaster type: Storm, Flood
- Texas Severe Storms, Tornadoes, Straight-line Winds, and Flooding, Incident Period: October 22, 2015 to October 31, 2015, Major Disaster (Presidential) Declared DR-4245: November 25, 2015, FEMA Id: 4245, Natural disaster type: Storm, Tornado, Flood, Wind
- Texas Severe Storms, Tornadoes, Straight-line Winds, and Flooding, Incident Period: May 04, 2015 to June 23, 2015, Major Disaster (Presidential) Declared DR-4223: May 29, 2015, FEMA Id: 4223, Natural disaster type: Storm, Tornado, Flood, Wind
- Texas Wildfires, Incident Period: August 30, 2011 to December 31, 2011, Major Disaster (Presidential) Declared DR-4029: September 09, 2011, FEMA Id: 4029, Natural disaster type: Fire
- Texas Hurricane Ike, Incident Period: September 07, 2008 to September 26, 2008, Emergency Declared EM-3294: September 10, 2008, FEMA Id: 3294, Natural disaster type: Hurricane
- Texas Wildfires, Incident Period: March 14, 2008 to September 01, 2008, Emergency Declared EM-3284: March 14, 2008, FEMA Id: 3284, Natural disaster type: Fire
- Texas Severe Storms, Tornadoes, and Flooding, Incident Period: June 16, 2007 to August 03, 2007, Major Disaster (Presidential) Declared DR-1709: June 29, 2007, FEMA Id: 1709, Natural disaster type: Storm, Tornado, Flood
- Texas Hurricane Rita, Incident Period: September 23, 2005 to October 14, 2005, Major Disaster (Presidential) Declared DR-1606: September 24, 2005, FEMA Id: 1606, Natural disaster type: Hurricane
- Texas Hurricane Rita, Incident Period: September 20, 2005 to October 14, 2005, Emergency Declared EM-3261: September 21, 2005, FEMA Id: 3261, Natural disaster type: Hurricane
- 9 other natural disasters have been reported since 1953.
The number of natural disasters in Hill County (19) is greater than the US average (15).
Major Disasters (Presidential) Declared: 10
Emergencies Declared: 6
Causes of natural disasters: Floods: 8, Storms: 7, Tornadoes: 6, Fires: 5, Hurricanes: 4, Winds: 3, Heavy Rain: 1, Other: 1 (Note: some incidents may be assigned to more than one category).
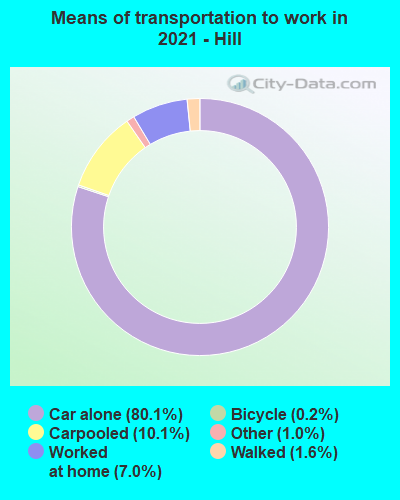
Means of transportation to work:
- Drove a car alone: 9,054 (76.2%)
- Carpooled: 1,148 (9.7%)
- Bus: 10 (0.1%)
- Taxicab, motorcycle, or other means: 129 (1.1%)
- Bicycle: 10 (0.1%)
- Walked: 176 (1.5%)
- Worked at home: 1,202 (10.1%)

- Health care and social assistance (14%)
- Educational services (14%)
- Retail trade (11%)
- Accommodation and food services (7%)
- Finance and insurance (4%)
- Manufacturing (4%)
- Other services, except public administration (4%)
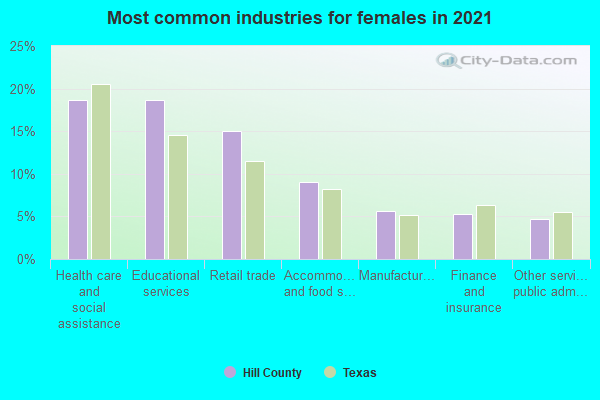
- Health care and social assistance (18%)
- Educational services (18%)
- Retail trade (14%)
- Accommodation and food services (8%)
- Finance and insurance (5%)
- Manufacturing (5%)
- Other services, except public administration (5%)
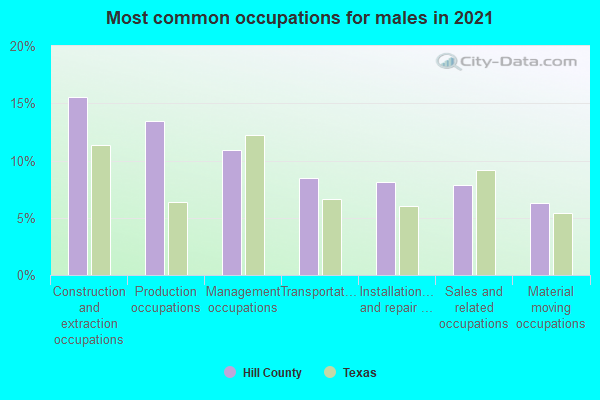
- Construction and extraction occupations (15%)
- Production occupations (14%)
- Management occupations (12%)
- Transportation occupations (8%)
- Installation, maintenance, and repair occupations (8%)
- Sales and related occupations (8%)
- Material moving occupations (7%)
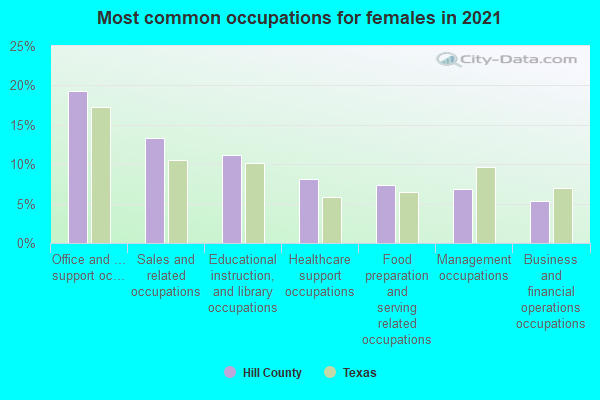
- Office and administrative support occupations (20%)
- Sales and related occupations (12%)
- Educational instruction, and library occupations (11%)
- Management occupations (8%)
- Food preparation and serving related occupations (7%)
- Healthcare support occupations (7%)
- Business and financial operations occupations (4%)
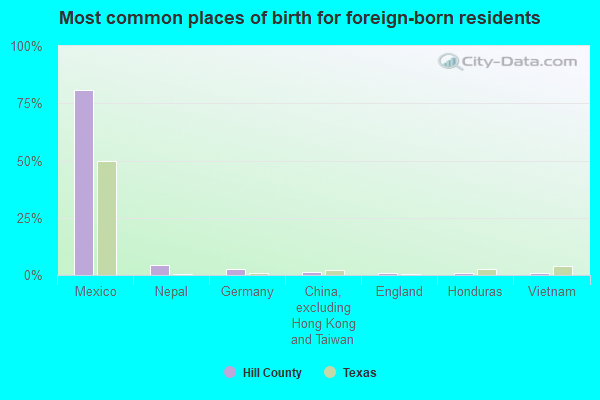
- Mexico (80%)
- Nepal (3%)
- Vietnam (2%)
- Germany (2%)
- China, excluding Hong Kong and Taiwan (2%)
- Korea (1%)
- Nigeria (1%)
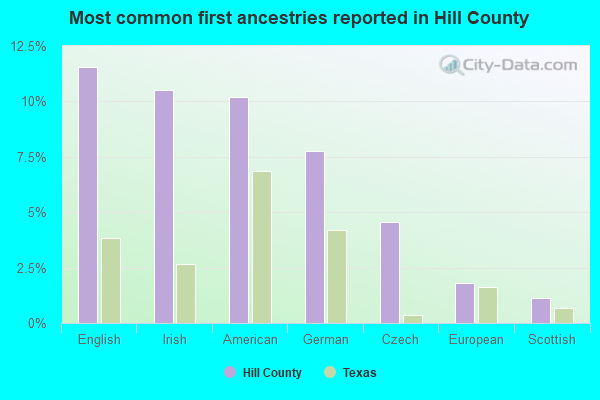
- English (13%)
- American (10%)
- Irish (9%)
- German (7%)
- Czech (4%)
- European (2%)
- Scottish (1%)
People in group quarters in Hill County, Texas in 2010:
- 406 people in nursing facilities/skilled-nursing facilities
- 246 people in college/university student housing
- 139 people in local jails and other municipal confinement facilities
- 36 people in group homes for juveniles (non-correctional)
- 2 people in group homes intended for adults
People in group quarters in Hill County, Texas in 2000:
- 429 people in nursing homes
- 192 people in college dormitories (includes college quarters off campus)
- 103 people in other group homes
- 80 people in local jails and other confinement facilities (including police lockups)
- 11 people in mental (psychiatric) hospitals or wards
- 5 people in other noninstitutional group quarters
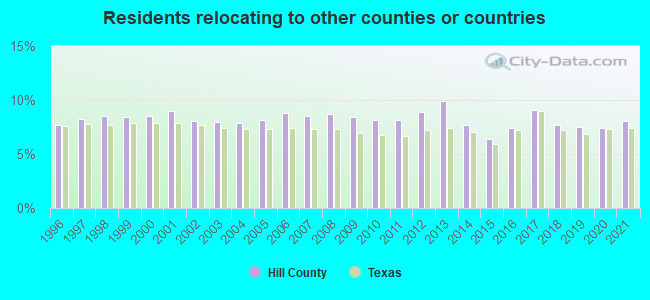
10.25% of this county's 2021 resident taxpayers lived in other counties in 2020 ($57,794 average adjusted gross income)
| Here: | 10.25% |
| Texas average: | 8.12% |
10 or fewer of this county's residents moved from foreign countries.
8.75% relocated from other counties in Texas ($49,352 average AGI)
1.50% relocated from other states ($8,443 average AGI)
Hill County: 1.50% Texas average: 2.83%

Top counties from which taxpayers relocated into this county between 2020 and 2021:
| from Johnson County, TX | |
| from Tarrant County, TX | |
| from McLennan County, TX | |
| from Ellis County, TX | |
| from Dallas County, TX | |
| from Bosque County, TX | |
| from Navarro County, TX |
8.01% of this county's 2020 resident taxpayers moved to other counties in 2021 ($44,598 average adjusted gross income)
| Here: | 8.01% |
| Texas average: | 7.40% |
10 or fewer of this county's residents moved to foreign countries.
6.95% relocated to other counties in Texas ($38,168 average AGI)
1.06% relocated to other states ($6,431 average AGI)
Hill County: 1.06% Texas average: 2.08%
Top counties to which taxpayers relocated from this county between 2020 and 2021:
| to McLennan County, TX | |
| to Johnson County, TX | |
| to Tarrant County, TX | |
| to Bosque County, TX | |
| to Dallas County, TX | |
| to Ellis County, TX | |
| to Navarro County, TX |
Births per 1000 population from 1990 to 1999: 12.9
Births per 1000 population from 2000 to 2006: 14.1

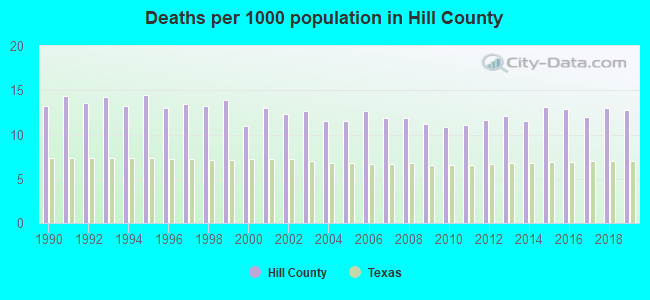
Deaths per 1000 population from 1990 to 1999: 13.7
Deaths per 1000 population from 2000 to 2009: 12.0
Deaths per 1000 population from 2010 to 2020: 12.3
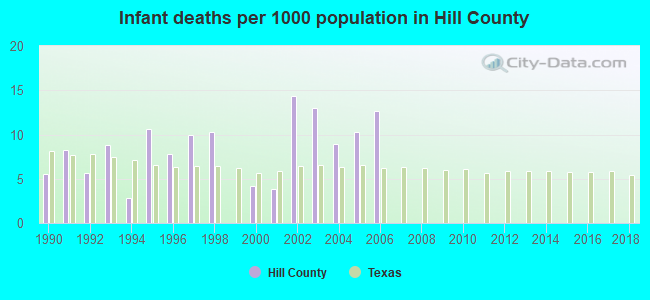
Infant deaths per 1000 live births from 1990 to 1999: 7.0
Infant deaths per 1000 live births from 2000 to 2006: 9.6
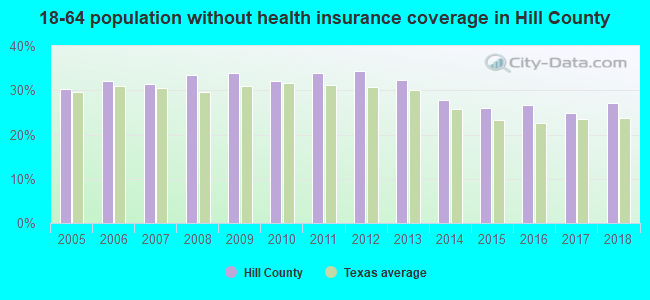
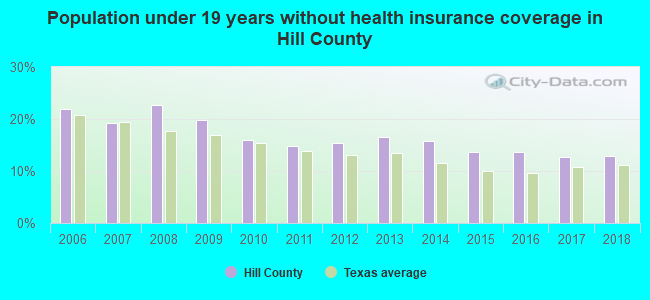
Persons under 19 years old without health insurance coverage in 2018: 12.9%
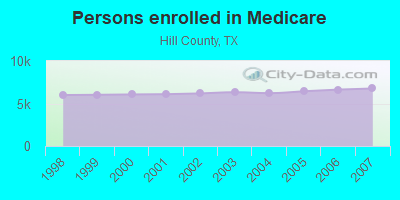
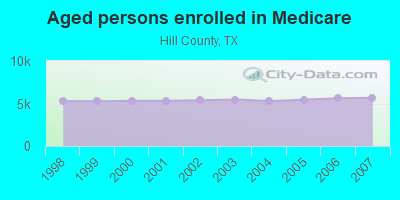
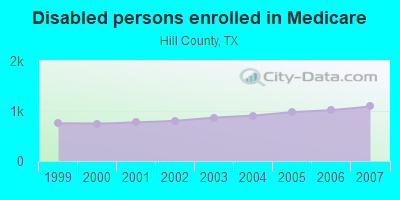
Persons enrolled in hospital insurance and/or supplemental medical insurance (Medicare) in July 1, 2007: 6,766 (5,674 aged, 1,092 disabled)
Children under 18 without health insurance coverage in 2007: 1,640 (18%)
Most common underlying causes of death in Hill County, Texas in 1999 - 2019:
- Acute myocardial infarction, unspecified (845)
- Bronchus or lung, unspecified - Malignant neoplasms (590)
- Chronic obstructive pulmonary disease, unspecified (455)
- Atherosclerotic heart disease (398)
- Unspecified dementia (368)
- Alzheimer disease, unspecified (249)
- Stroke, not specified as haemorrhage or infarction (238)
- Congestive heart failure (160)
- Atherosclerotic cardiovascular disease, so described (49)
- Other ill-defined and unspecified causes of mortality (45)
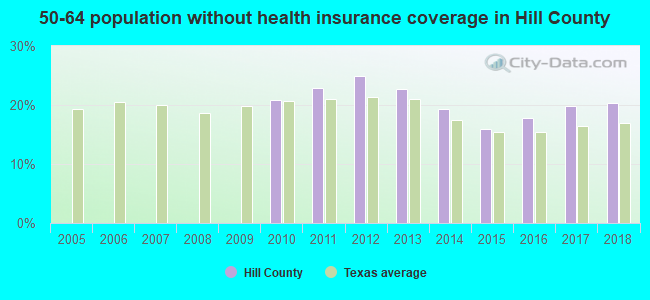
Population without health insurance coverage in 2000: 19%
Children under 18 without health insurance coverage in 2000: 18%
Short term general hospital admissions per 100,000 population in 2004: 13,087
Short term general hospital beds per 100,000 population in 2004: 296
Emergency room visits per 100,000 population in 2004: 38,456
General practice office based MDs per 100,000 population in 2005: 1,383
Medical specialist MDs per 100,000 population in 2005: 1,132
Dentists per 100,000 population in 1998: 8
Total births per 100,000 population, July 2005 - July 2006 : 20
Total deaths per 100,000 population, July 2005 - July 2006: 88
Limited-service eating places per 100,000 population in 2005 : 11
Suicides per 1,000,000 population from 2000 to 2006: 164.7. This is more than state average.

- Firearm - 114.0
- Other - 50.7
Household type by relationship:
Households: 37,109- Male householders: 7,147 (1,861 living alone), Female householders: 7,004 (2,373 living alone)
7,095 spouses (7,072 opposite-sex spouses), 721 unmarried partners, (695 opposite-sex unmarried partners), 10,579 children (9,409 natural, 381 adopted, 793 stepchildren), 1,258 grandchildren, 252 brothers or sisters, 593 parents, 49 foster children, 799 other relatives, 705 non-relatives
- In group quarters: 933
Size of family households: 4,311 2-persons, 2,250 3-persons, 1,403 4-persons, 967 5-persons, 355 6-persons, 192 7-or-more-persons.
Size of nonfamily households: 4,234 1-person, 427 2-persons, 30 3-persons, 5 4-persons.
5,329 married couples with children.
1,783 single-parent households (380 men, 1,403 women).
85.0% of residents of Hill speak English at home.
14.0% of residents speak Spanish at home (68% speak English very well, 15% speak English well, 13% speak English not well, 3% don't speak English at all).
0.6% of residents speak other Indo-European language at home (74% speak English very well, 24% speak English well, 2% speak English not well).
0.5% of residents speak Asian or Pacific Island language at home (42% speak English very well, 35% speak English well, 22% speak English not well, 2% don't speak English at all).
In fiscal year 2004:
Federal Government expenditure: $211,079,000 ($6,004 per capita)
Department of Defense expenditure: $7,306,000
Federal direct payments to individuals for retirement and disability: $100,789,000
Federal other direct payments to individuals: $51,242,000
Federal direct payments not to individuals: $7,057,000
Federal grants: $42,608,000
Federal procurement contracts: $3,696,000 ($1,618,000 Department of Defense)
Federal salaries and wages: $5,688,000 ($0,000 Department of Defense)
Federal Government direct loans: $823,000
Federal guaranteed/insured loans: $17,265,000
Federal Government insurance: $24,856,000
Population change from April 1, 2000 to July 1, 2005:
Births: 2,505| Here: | 71 per 1000 residents |
| State: | 85 per 1000 residents |
Deaths: 2,199
| Here: | 62 per 1000 residents |
| State: | 35 per 1000 residents |
Net international migration: +678
| Here: | +19 per 1000 residents |
| State: | +29 per 1000 residents |
Net internal migration: +2,186
| Here: | +62 per 1000 residents |
| State: | +10 per 1000 residents |
Total withdrawal of fresh water for public supply: 7.68 millions of gallons per day (33% from ground, 67% from surface)
| Here: | 5.7 |
| State: | 6.3 |
| Here: | 4.3 |
| State: | 4.0 |

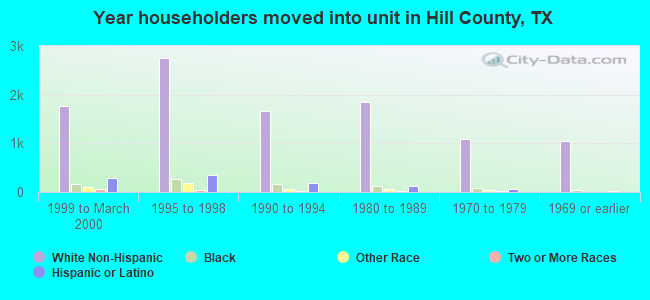
- Year house built in Hill County, Texas
- 1302020 or later
- 1,9982010 to 2019
- 2,4012000 to 2009
- 2,5911990 to 1999
- 2,2911980 to 1989
- 1,9321970 to 1979
- 1,3691960 to 1969
- 1,4461950 to 1959
- 6481940 to 1949
- 1,3651939 or earlier
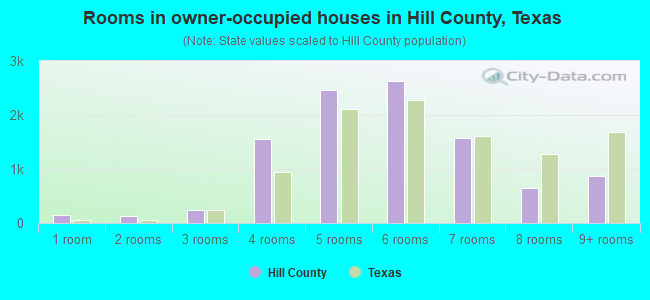
- Rooms in owner-occupied houses in Hill County, Texas
- 1271 room
- 2062 rooms
- 3143 rooms
- 1,5154 rooms
- 2,5715 rooms
- 2,6316 rooms
- 1,7187 rooms
- 7398 rooms
- 8799+ rooms
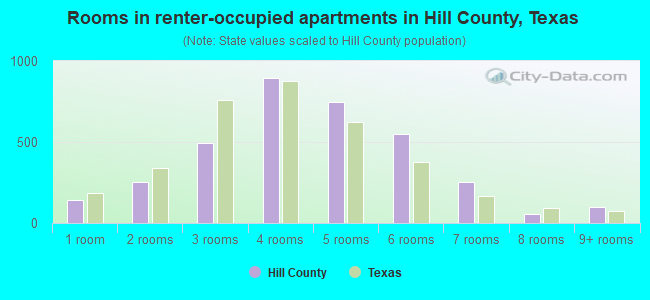
- Rooms in renter-occupied apartments in Hill County, Texas
- 1691 room
- 2452 rooms
- 5473 rooms
- 8854 rooms
- 6555 rooms
- 5706 rooms
- 2327 rooms
- 578 rooms
- 899+ rooms

- Bedrooms in owner-occupied houses in Hill County, Texas
- 146no bedroom
- 5271 bedroom
- 2,4112 bedrooms
- 5,6703 bedrooms
- 1,5054 bedrooms
- 3785+ bedrooms
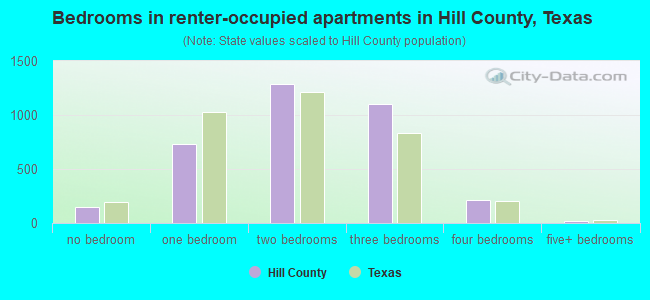
- Bedrooms in renter-occupied apartments in Hill County, Texas
- 168no bedroom
- 7991 bedroom
- 1,2212 bedrooms
- 1,0443 bedrooms
- 2024 bedrooms
- 285+ bedrooms
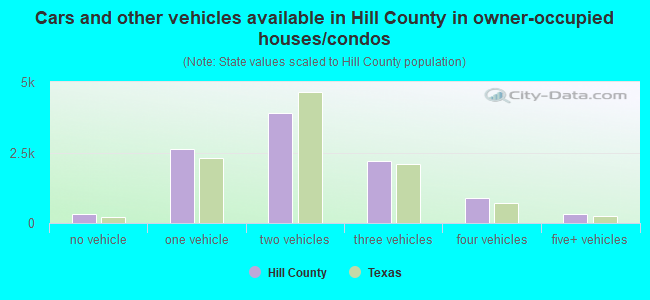
- Cars and other vehicles available in Hill County in owner-occupied houses/condos
- 210no vehicle
- 2,7071 vehicle
- 4,2562 vehicles
- 2,2203 vehicles
- 9524 vehicles
- 3265+ vehicles
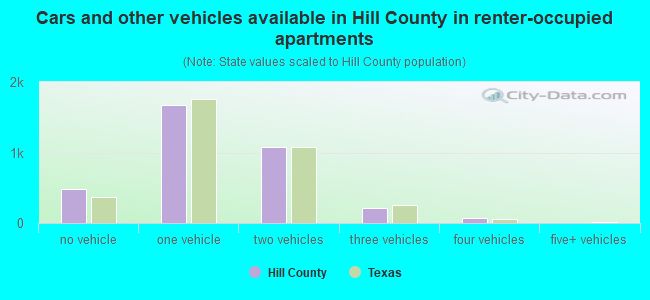
- Cars and other vehicles available in Hill County in renter-occupied apartments
- 587no vehicle
- 1,5071 vehicle
- 1,1102 vehicles
- 1993 vehicles
- 794 vehicles
- 05+ vehicles
88.2% of Hill County residents lived in the same house 1 years ago.
Out of people who lived in different houses, 29% lived in this county.
Out of people who lived in different counties, 93% lived in Texas.
| Hill County: | 88.2% |
| State average: | 85.7% |
Place of birth for U.S.-born residents:
- This state: 27,378
- Other state: 6,877
- Northeast: 857
- Midwest: 2,117
- South: 2,055
- West: 1,844
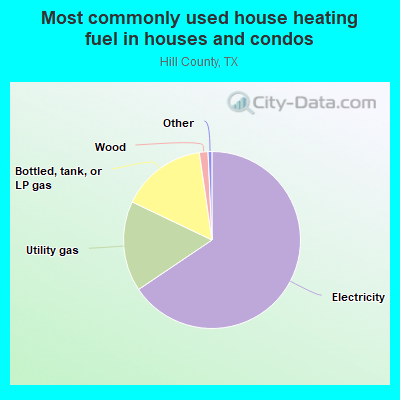
- 65.6%Electricity
- 15.9%Bottled, tank, or LP gas
- 15.7%Utility gas
- 1.3%Wood
- 1.1%No fuel used
- 0.2%Other fuel
- 0.1%Coal or coke
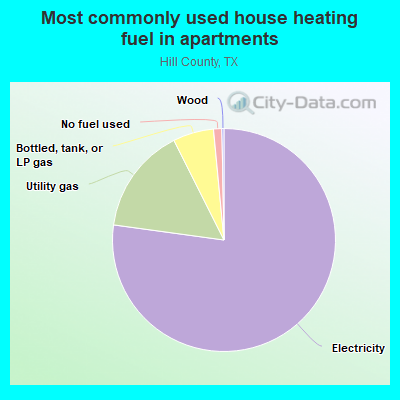
- 76.9%Electricity
- 15.4%Utility gas
- 6.2%Bottled, tank, or LP gas
- 1.2%No fuel used
- 0.4%Wood
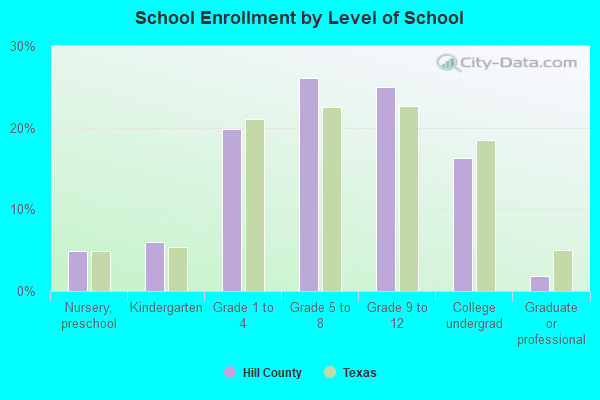
Private vs. public school enrollment:
| Here: | 5.3% |
| Texas: | 8.8% |
| Here: | 4.3% |
| Texas: | 8.0% |
| Here: | 9.3% |
| Texas: | 16.2% |

Hill County government finances - Expenditure in 2017:
- Charges - Other: $3,760,000
Regular Highways: $55,000
- Construction - Regular Highways: $248,000
- Current Operations - Judicial and Legal Services: $4,017,000
Regular Highways: $3,767,000
Police Protection: $3,723,000
Correctional Institutions: $3,186,000
Corrections - Other: $2,016,000
Financial Administration: $1,743,000
Public Welfare, Vendor Payments for Medical Care: $1,233,000
General - Other: $1,118,000
Central Staff Services: $939,000
General Public Buildings: $522,000
Public Welfare - Other: $255,000
Natural Resources - Other: $134,000
Health - Other: $77,000
- General - Interest on Debt: $216,000
- Long Term Debt - Beginning Outstanding - Unspecified Public Purpose: $6,340,000
Outstanding Unspecified Public Purpose: $5,965,000
Retired Unspecified Public Purpose: $375,000
- Miscellaneous - Fines and Forfeits: $1,810,000
General Revenue - Other: $327,000
Sale of Property: $265,000
Interest Earnings: $190,000
- Other Capital Outlay - Regular Highways: $813,000
Financial Administration: $112,000
General - Other: $52,000
Police Protection: $50,000
Central Staff Services: $30,000
Correctional Institutions: $9,000
Natural Resources - Other: $6,000
- Other Funds - Cash and Securities: $11,730,000
- Sinking Funds - Cash and Securities: $144,000
- State Intergovernmental - Other: $2,220,000
Highways: $227,000
General Local Government Support: $48,000
- Tax - Property: $11,682,000
General Sales and Gross Receipts: $1,853,000
Motor Vehicle License: $989,000
Other Selective Sales: $95,000
- Total Salaries and Wages: $7,158,000
Hill County government finances - Revenue in 2017:
- Charges - Other: $3,760,000
Regular Highways: $55,000
- Construction - Regular Highways: $248,000
- Current Operations - Judicial and Legal Services: $4,017,000
Regular Highways: $3,767,000
Police Protection: $3,723,000
Correctional Institutions: $3,186,000
Corrections - Other: $2,016,000
Financial Administration: $1,743,000
Public Welfare, Vendor Payments for Medical Care: $1,233,000
General - Other: $1,118,000
Central Staff Services: $939,000
General Public Buildings: $522,000
Public Welfare - Other: $255,000
Natural Resources - Other: $134,000
Health - Other: $77,000
- General - Interest on Debt: $216,000
- Long Term Debt - Beginning Outstanding - Unspecified Public Purpose: $6,340,000
Outstanding Unspecified Public Purpose: $5,965,000
Retired Unspecified Public Purpose: $375,000
- Miscellaneous - Fines and Forfeits: $1,810,000
General Revenue - Other: $327,000
Sale of Property: $265,000
Interest Earnings: $190,000
- Other Capital Outlay - Regular Highways: $813,000
Financial Administration: $112,000
General - Other: $52,000
Police Protection: $50,000
Central Staff Services: $30,000
Correctional Institutions: $9,000
Natural Resources - Other: $6,000
- Other Funds - Cash and Securities: $11,730,000
- Sinking Funds - Cash and Securities: $144,000
- State Intergovernmental - Other: $2,220,000
Highways: $227,000
General Local Government Support: $48,000
- Tax - Property: $11,682,000
General Sales and Gross Receipts: $1,853,000
Motor Vehicle License: $989,000
Other Selective Sales: $95,000
- Total Salaries and Wages: $7,158,000
Hill County government finances - Debt in 2017:
- Charges - Other: $3,760,000
Regular Highways: $55,000
- Construction - Regular Highways: $248,000
- Current Operations - Judicial and Legal Services: $4,017,000
Regular Highways: $3,767,000
Police Protection: $3,723,000
Correctional Institutions: $3,186,000
Corrections - Other: $2,016,000
Financial Administration: $1,743,000
Public Welfare, Vendor Payments for Medical Care: $1,233,000
General - Other: $1,118,000
Central Staff Services: $939,000
General Public Buildings: $522,000
Public Welfare - Other: $255,000
Natural Resources - Other: $134,000
Health - Other: $77,000
- General - Interest on Debt: $216,000
- Long Term Debt - Beginning Outstanding - Unspecified Public Purpose: $6,340,000
Outstanding Unspecified Public Purpose: $5,965,000
Retired Unspecified Public Purpose: $375,000
- Miscellaneous - Fines and Forfeits: $1,810,000
General Revenue - Other: $327,000
Sale of Property: $265,000
Interest Earnings: $190,000
- Other Capital Outlay - Regular Highways: $813,000
Financial Administration: $112,000
General - Other: $52,000
Police Protection: $50,000
Central Staff Services: $30,000
Correctional Institutions: $9,000
Natural Resources - Other: $6,000
- Other Funds - Cash and Securities: $11,730,000
- Sinking Funds - Cash and Securities: $144,000
- State Intergovernmental - Other: $2,220,000
Highways: $227,000
General Local Government Support: $48,000
- Tax - Property: $11,682,000
General Sales and Gross Receipts: $1,853,000
Motor Vehicle License: $989,000
Other Selective Sales: $95,000
- Total Salaries and Wages: $7,158,000
Hill County government finances - Cash and Securities in 2017:
- Charges - Other: $3,760,000
Regular Highways: $55,000
- Construction - Regular Highways: $248,000
- Current Operations - Judicial and Legal Services: $4,017,000
Regular Highways: $3,767,000
Police Protection: $3,723,000
Correctional Institutions: $3,186,000
Corrections - Other: $2,016,000
Financial Administration: $1,743,000
Public Welfare, Vendor Payments for Medical Care: $1,233,000
General - Other: $1,118,000
Central Staff Services: $939,000
General Public Buildings: $522,000
Public Welfare - Other: $255,000
Natural Resources - Other: $134,000
Health - Other: $77,000
- General - Interest on Debt: $216,000
- Long Term Debt - Beginning Outstanding - Unspecified Public Purpose: $6,340,000
Outstanding Unspecified Public Purpose: $5,965,000
Retired Unspecified Public Purpose: $375,000
- Miscellaneous - Fines and Forfeits: $1,810,000
General Revenue - Other: $327,000
Sale of Property: $265,000
Interest Earnings: $190,000
- Other Capital Outlay - Regular Highways: $813,000
Financial Administration: $112,000
General - Other: $52,000
Police Protection: $50,000
Central Staff Services: $30,000
Correctional Institutions: $9,000
Natural Resources - Other: $6,000
- Other Funds - Cash and Securities: $11,730,000
- Sinking Funds - Cash and Securities: $144,000
- State Intergovernmental - Other: $2,220,000
Highways: $227,000
General Local Government Support: $48,000
- Tax - Property: $11,682,000
General Sales and Gross Receipts: $1,853,000
Motor Vehicle License: $989,000
Other Selective Sales: $95,000
- Total Salaries and Wages: $7,158,000
Supplemental Security Income (SSI) in 2006:
- Total number of recipients: 828
- Number of aged recipients: 109
- Number of blind and disabled recipients: 719
- Number of recipients under 18: 136
- Number of recipients between 18 and 64: 490
- Number of recipients older than 64: 202
- Number of recipients also receiving OASDI: 330
- Amount of payments (thousands of dollars): 360
| Most common first names in Hill County, TX among deceased individuals | ||
| Name | Count | Lived (average) |
|---|---|---|
| William | 334 | 75.6 years |
| Mary | 310 | 81.0 years |
| James | 309 | 74.8 years |
| John | 263 | 76.8 years |
| Robert | 176 | 75.2 years |
| Willie | 145 | 78.5 years |
| George | 138 | 76.0 years |
| Charles | 121 | 74.2 years |
| Joe | 110 | 75.4 years |
| Thomas | 102 | 73.7 years |
| Most common last names in Hill County, TX among deceased individuals | ||
| Last name | Count | Lived (average) |
|---|---|---|
| Smith | 155 | 78.4 years |
| Williams | 127 | 73.1 years |
| Johnson | 116 | 76.0 years |
| Brown | 97 | 77.0 years |
| Davis | 91 | 81.0 years |
| Moore | 84 | 77.6 years |
| Jones | 81 | 74.0 years |
| Miller | 67 | 75.3 years |
| Lewis | 65 | 77.3 years |
| Hill | 62 | 77.1 years |
| Businesses in Hill County, TX | ||||
| Name | Count | Name | Count | |
|---|---|---|---|---|
| 7-Eleven | 1 | Jones New York | 1 | |
| Ace Hardware | 3 | KFC | 1 | |
| Aeropostale | 1 | La Quinta | 1 | |
| Arby's | 1 | Lane Bryant | 1 | |
| AutoZone | 1 | Maurices | 1 | |
| Bath & Body Works | 1 | McDonald's | 1 | |
| Best Western | 1 | Motel 6 | 1 | |
| Cinnabon | 1 | Nike | 1 | |
| ColorTyme | 1 | Pac Sun | 1 | |
| Comfort Inn | 1 | Payless | 1 | |
| Curves | 1 | Pizza Hut | 1 | |
| Dairy Queen | 2 | RadioShack | 1 | |
| Days Inn | 1 | Rue21 | 1 | |
| DressBarn | 1 | SONIC Drive-In | 2 | |
| Dressbarn | 1 | Starbucks | 1 | |
| FedEx | 4 | Subway | 3 | |
| Ford | 2 | Super 8 | 1 | |
| Gap | 1 | T-Mobile | 1 | |
| Gymboree | 1 | Taco Bell | 1 | |
| H&R Block | 2 | U-Haul | 3 | |
| Hilton | 1 | UPS | 4 | |
| Holiday Inn | 1 | Walmart | 1 | |
| IHOP | 1 | Wendy's | 1 | |
| Jack In The Box | 1 | |||